ASIC Sues Equity Trustees Over $65M Shield Master Fund Failures
1 hr ago

Options markets priced in a $355 billion swing in Nvidia’s market capitalisation heading into 20 May. The company delivered its strongest quarter in history. Shares fell anyway.
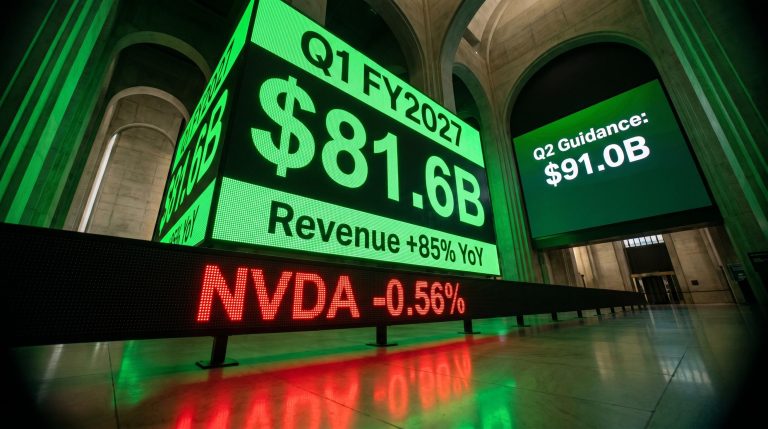
Nvidia reported Q1 FY27 results after market close on 20 May 2026, posting $81.6 billion in revenue, up 85% year over year, with a record $75.2 billion in Data Center sales and Q2 guidance of $91 billion that cleared analyst consensus by roughly $5 billion. The backdrop was extraordinary: speculative short positions in Nasdaq 100 futures sat at multi-year highs according to Wolfe Research, and the implied options move was reportedly the largest ever recorded for a mega-cap company. What follows is a breakdown of the numbers, why the market’s muted reaction is not a bearish signal, what the $91 billion guide reveals about AI infrastructure demand, and the specific risks that could complicate the path from here.
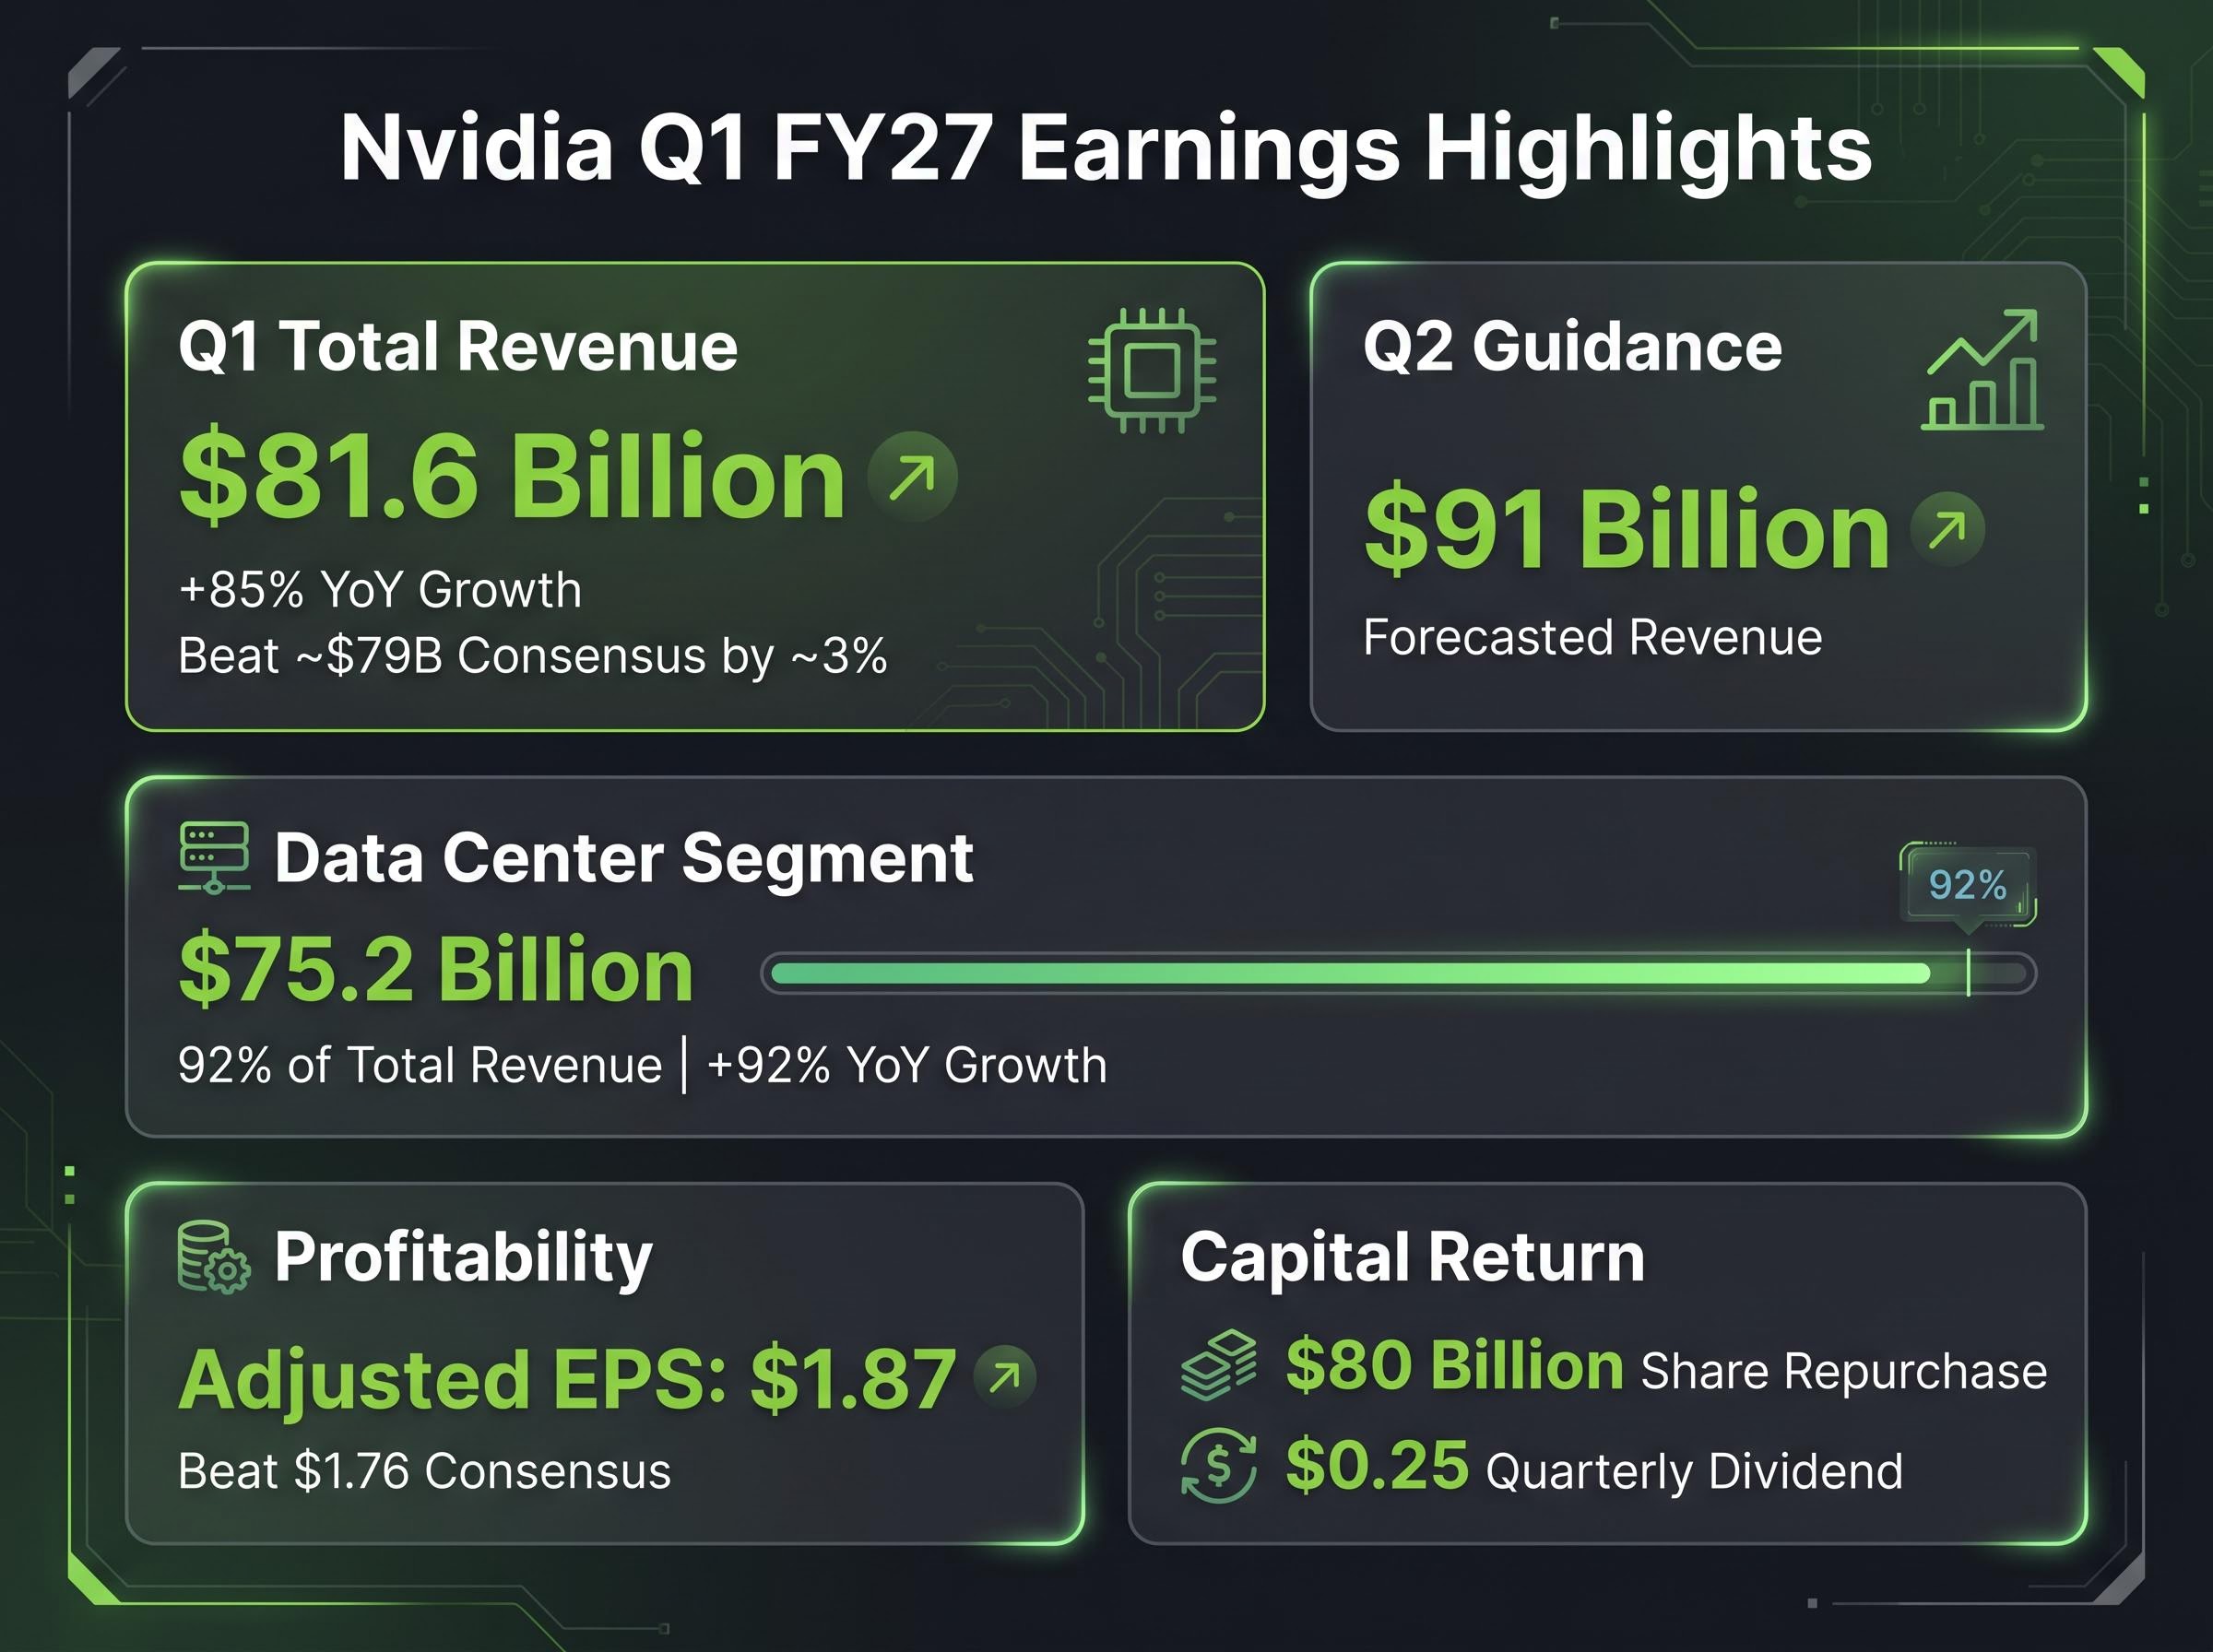
$81.62 billion in a single quarter. That is the figure Nvidia printed for Q1 FY27, beating consensus estimates by approximately 3% and representing 85% growth over the same period a year earlier.
The engine behind it was Data Center, which generated $75.2 billion of the total, accounting for 92% of revenue and growing 92% year over year within that segment alone. Adjusted earnings per share came in at $1.87, above the $1.76 consensus, while GAAP EPS reached $2.39. The profitability picture matched the revenue story point for point.
| Metric | Q1 FY27 Actual | Consensus / Prior Year | Beat / YoY Change |
|---|---|---|---|
| Total Revenue | $81.62B | ~$79B (consensus) | ~3% beat |
| Data Center Revenue | $75.2B | Prior year comparison | +92% YoY |
| Adjusted EPS | $1.87 | $1.76 (consensus) | +$0.11 beat |
| GAAP EPS | $2.39 | — | — |
Capital return announcements reinforced the confidence embedded in the result:
For investors tracking the semiconductor cycle, this is the most significant single-company data point of the quarter, and it confirms that AI infrastructure spending is not plateauing.
Nvidia dropped approximately 1.5% in after-hours trading. A record quarter, a guidance beat, and a red candle. The contradiction is only apparent.
The options market had priced in a roughly $355 billion swing in Nvidia’s market capitalisation, the largest implied earnings move ever recorded for a mega-cap company.
That figure meant a strong beat was the base case, not a surprise. Any outcome short of the most aggressive buy-side estimates was likely to compress the stock once the uncertainty resolved. The Q2 guidance of $91 billion, while $5 billion above the $86 billion analyst consensus, fell within the range that aggressive positioning had already anticipated.
Separately, Wolfe Research data (reported via CNBC) showed speculative short positions in Nasdaq 100 futures at their largest net short since the 2023 low. That positioning reflects the scale of hedging into a high-volatility single-stock event, not a directional macro bet against technology. When the event resolves and hedges are unwound, the initial price action can appear disconnected from the fundamental quality of the result.
The stock fell not because the numbers were weak but because the market had already paid for strength.
Stock prices respond to the expectations gap between actual results and prior positioning, not to whether the numbers are strong in absolute terms; a record-breaking quarter that lands inside the range the market already priced simply removes uncertainty rather than delivering a genuine surprise.
The $355 billion implied swing was visible on any options screen before the print. That number represents the options market’s collective estimate of how far Nvidia shares could move in either direction, a measure known as implied volatility.
Before a major earnings event, implied volatility rises because the outcome is uncertain and the potential magnitude of the move is large. This is the premium options buyers pay for exposure to a binary event. Once the event happens, however, the uncertainty disappears, and implied volatility collapses regardless of the result’s quality. The sequence runs as follows:
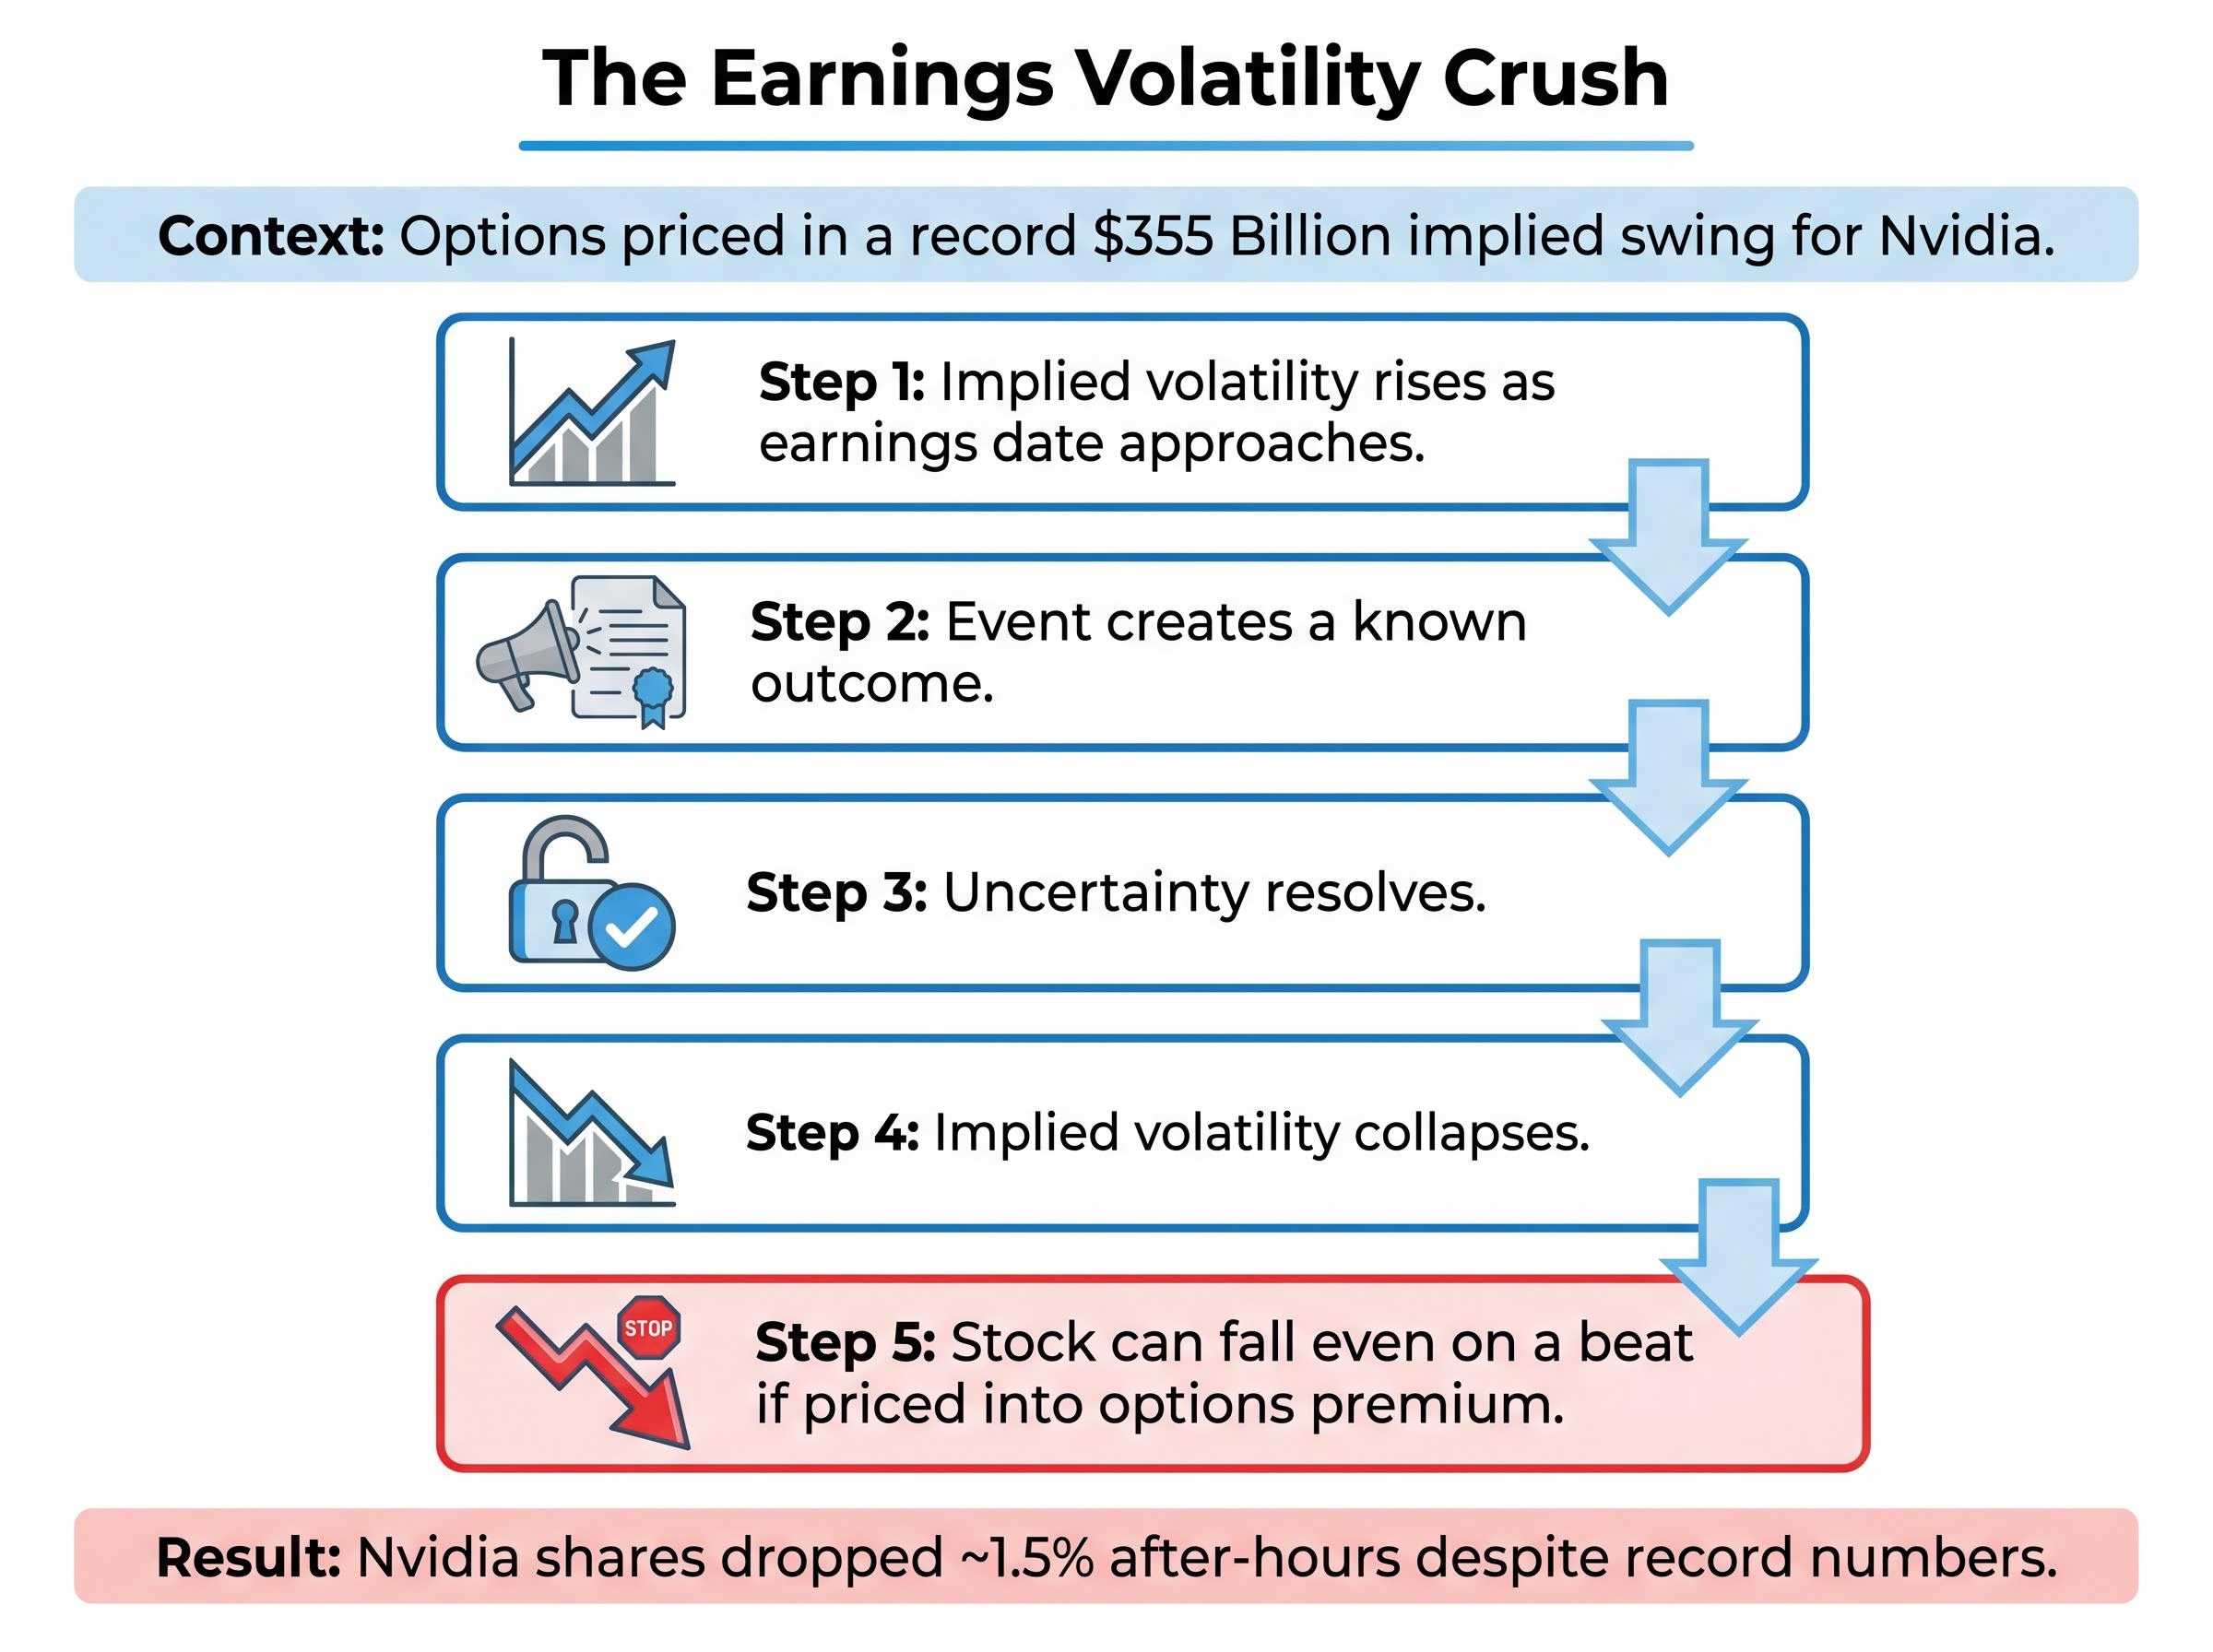
This is why a “sell the news” reaction can emerge from genuinely strong results. The event resolves uncertainty, and the positioning that was built around that uncertainty unwinds.
Large speculative short positions in index futures are a standard pre-event hedging tool used by institutional portfolio managers to limit downside exposure across broad equity holdings. They are not a bet against Nvidia or technology fundamentals specifically.
The Wolfe Research data showing the largest net short in Nasdaq 100 futures since the 2023 low reflected the scale and significance of the earnings event itself. Full positioning resolution will appear in the CFTC’s weekly Commitments of Traders (COT) report, and post-earnings options data from OCC and CME typically lags by 1-2 trading days.
Full positioning resolution will appear in the CFTC’s weekly Commitments of Traders (COT) report, and CME Group’s COT report data provides a categorised breakdown of speculative versus commercial participant positioning in Nasdaq 100 futures, with post-earnings updates typically reflecting the unwind within one to two weekly releases.
The Q2 FY27 guide of approximately $91 billion represents a sequential step-up from the $81.62 billion Q1 print. At the Q1 run rate alone, Nvidia’s Data Center segment implies an annualised revenue pace of roughly $300 billion, a figure that conveys the sheer scale of AI capital expenditure flowing through a single company’s supply chain.
Nvidia’s Data Center segment, at Q1 FY27’s run rate, implies approximately $300 billion in annualised revenue, reflecting the magnitude of global AI infrastructure procurement.
That figure did not materialise in isolation. Four hyperscalers have signalled sustained or increasing AI infrastructure investment throughout early 2026:
Nvidia’s Q1 print is the downstream confirmation of those capex commitments translating into actual chip procurement. Blackwell GPU shipments are confirmed at scale, which removes one of the key demand-versus-supply ambiguities analysts had flagged heading into this report. The guidance figure, more than the Q1 result itself, is what semiconductor analysts will use to recalibrate second-half 2026 models.
The Nvidia platform investment thesis being developed by analysts at Goldman Sachs, Morgan Stanley, and William Blair now decomposes Data Center revenue into four distinct layers, GPU silicon, networking, systems, and software, each carrying different margin and growth characteristics that headline revenue figures do not capture.
The $91 billion guide carries specific, identifiable risk vectors. Each has a distinct mechanism and timeline:
Export control risk carries a structural durability that distinguishes it from tariff-based trade restrictions: US AI chip export controls are grounded in national-security law with bipartisan Congressional backing, placing them outside the jurisdiction of trade negotiators and making them resistant to the kind of diplomatic resolution that recent summit-level meetings have produced.
Detailed analyst commentary from Morgan Stanley, Goldman Sachs, and Berenberg addressing these risks in direct response to the Q2 guide is still emerging within the 24-48 hour post-earnings window.
Nvidia’s quarter is not a single-stock story. It is a real-time survey of global AI capital expenditure, and the broader market read it that way. On 21 May, the Semiconductor ETF (SOXX) gained approximately 4.74% while the Nasdaq Composite rose 1.54%, reflecting institutional sentiment treating the print as a sector-wide positive despite Nvidia’s own modest after-hours dip.
AI capital expenditure has now reached 4.9% of US GDP in Q1 2026, surpassing the dot-com era peak of approximately 4.2% and the cloud buildout peak of approximately 3.8%, providing the macro-level context that explains why a single company’s quarterly revenue can carry this much weight as a forward indicator for the broader technology investment cycle.
The supply chain implications extend across Asia-Pacific semiconductor markets: TSMC’s advanced packaging demand, HBM memory procurement by SK Hynix, Samsung, and Micron, and broader AI infrastructure buildout timelines all receive forward confirmation from this result.
The specific data points investors should monitor in the days ahead:
The muted stock reaction does not reflect weak fundamentals. It reflects how thoroughly the market had already priced in a strong outcome, which is itself a signal of how dominant Nvidia’s position has become in the AI semiconductor supply chain.
The Q1 FY27 result and $91 billion Q2 guide together represent the strongest confirmation yet that enterprise and hyperscaler AI infrastructure buildout is not decelerating heading into the second half of 2026. The forward signals identified above, from analyst notes to options positioning data to the CFTC COT report, will determine how this quarter’s story develops from here.
This article is for informational purposes only and should not be considered financial advice. Investors should conduct their own research and consult with financial professionals before making investment decisions. Past performance does not guarantee future results. Financial projections are subject to market conditions and various risk factors.
Nvidia reported Q1 FY27 revenue of $81.62 billion, up 85% year over year, with Data Center revenue of $75.2 billion and adjusted EPS of $1.87, beating analyst consensus on both metrics.
Nvidia shares fell because options markets had already priced in a roughly $355 billion swing in market capitalisation, meaning a strong beat was the base case rather than a surprise, and the Q2 guidance landed within the range aggressive positioning had anticipated.
The $91 billion Q2 FY27 guide signals that hyperscaler and enterprise AI infrastructure investment is accelerating, with Nvidia's Data Center segment running at an implied annualised pace of approximately $300 billion.
Volatility crush occurs when implied volatility collapses after an earnings event resolves uncertainty; in Nvidia's case, the record result removed the uncertainty that had driven options premiums higher, causing the stock to dip despite the strong beat.
The three key risks are US export controls on AI chips limiting access to China, growing competition from AMD accelerators and custom silicon developed by hyperscalers, and supply constraints in advanced packaging and high-bandwidth memory production.