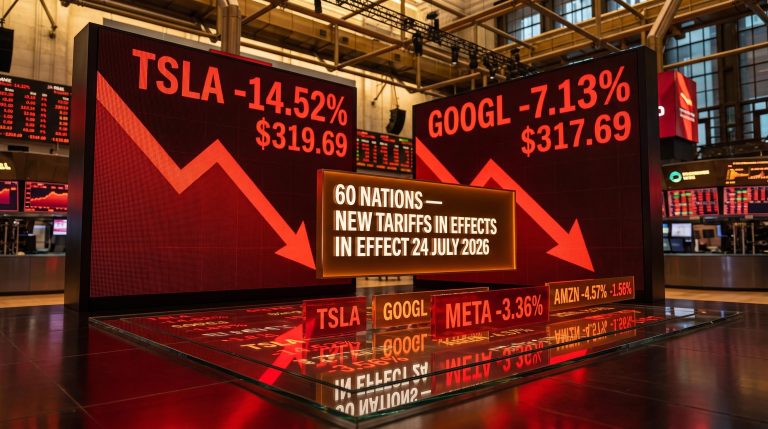
Bank of America has ranked last Friday’s Nasdaq-100 selloff as the 13th most severe volatility-adjusted decline in four decades of data, and the bank’s equity derivatives team warns the damage may only be half done. The Nasdaq-100 fell 4.8% on 6 June 2026, a single-session drop that Bank of America analyst Chintan Kotecha characterised as a fragility episode driven by exhaustion in AI-related momentum names. In a client note published on 8 June, Kotecha warned that the move appears to have triggered systematic deleveraging by commodity trading adviser (CTA) funds, but that at least half of their existing long positions may remain intact, leaving significant mechanical selling pressure ahead if the index slips another 1-2%. What follows is an explanation of the CTA unwind mechanics behind the warning, the specific thresholds Bank of America has identified as the next triggers, and what the breakdown of an unusually stable pre-selloff options environment means for the durability of any near-term recovery.
Nasdaq’s Friday plunge ranked among the rarest volatility-adjusted declines in four decades
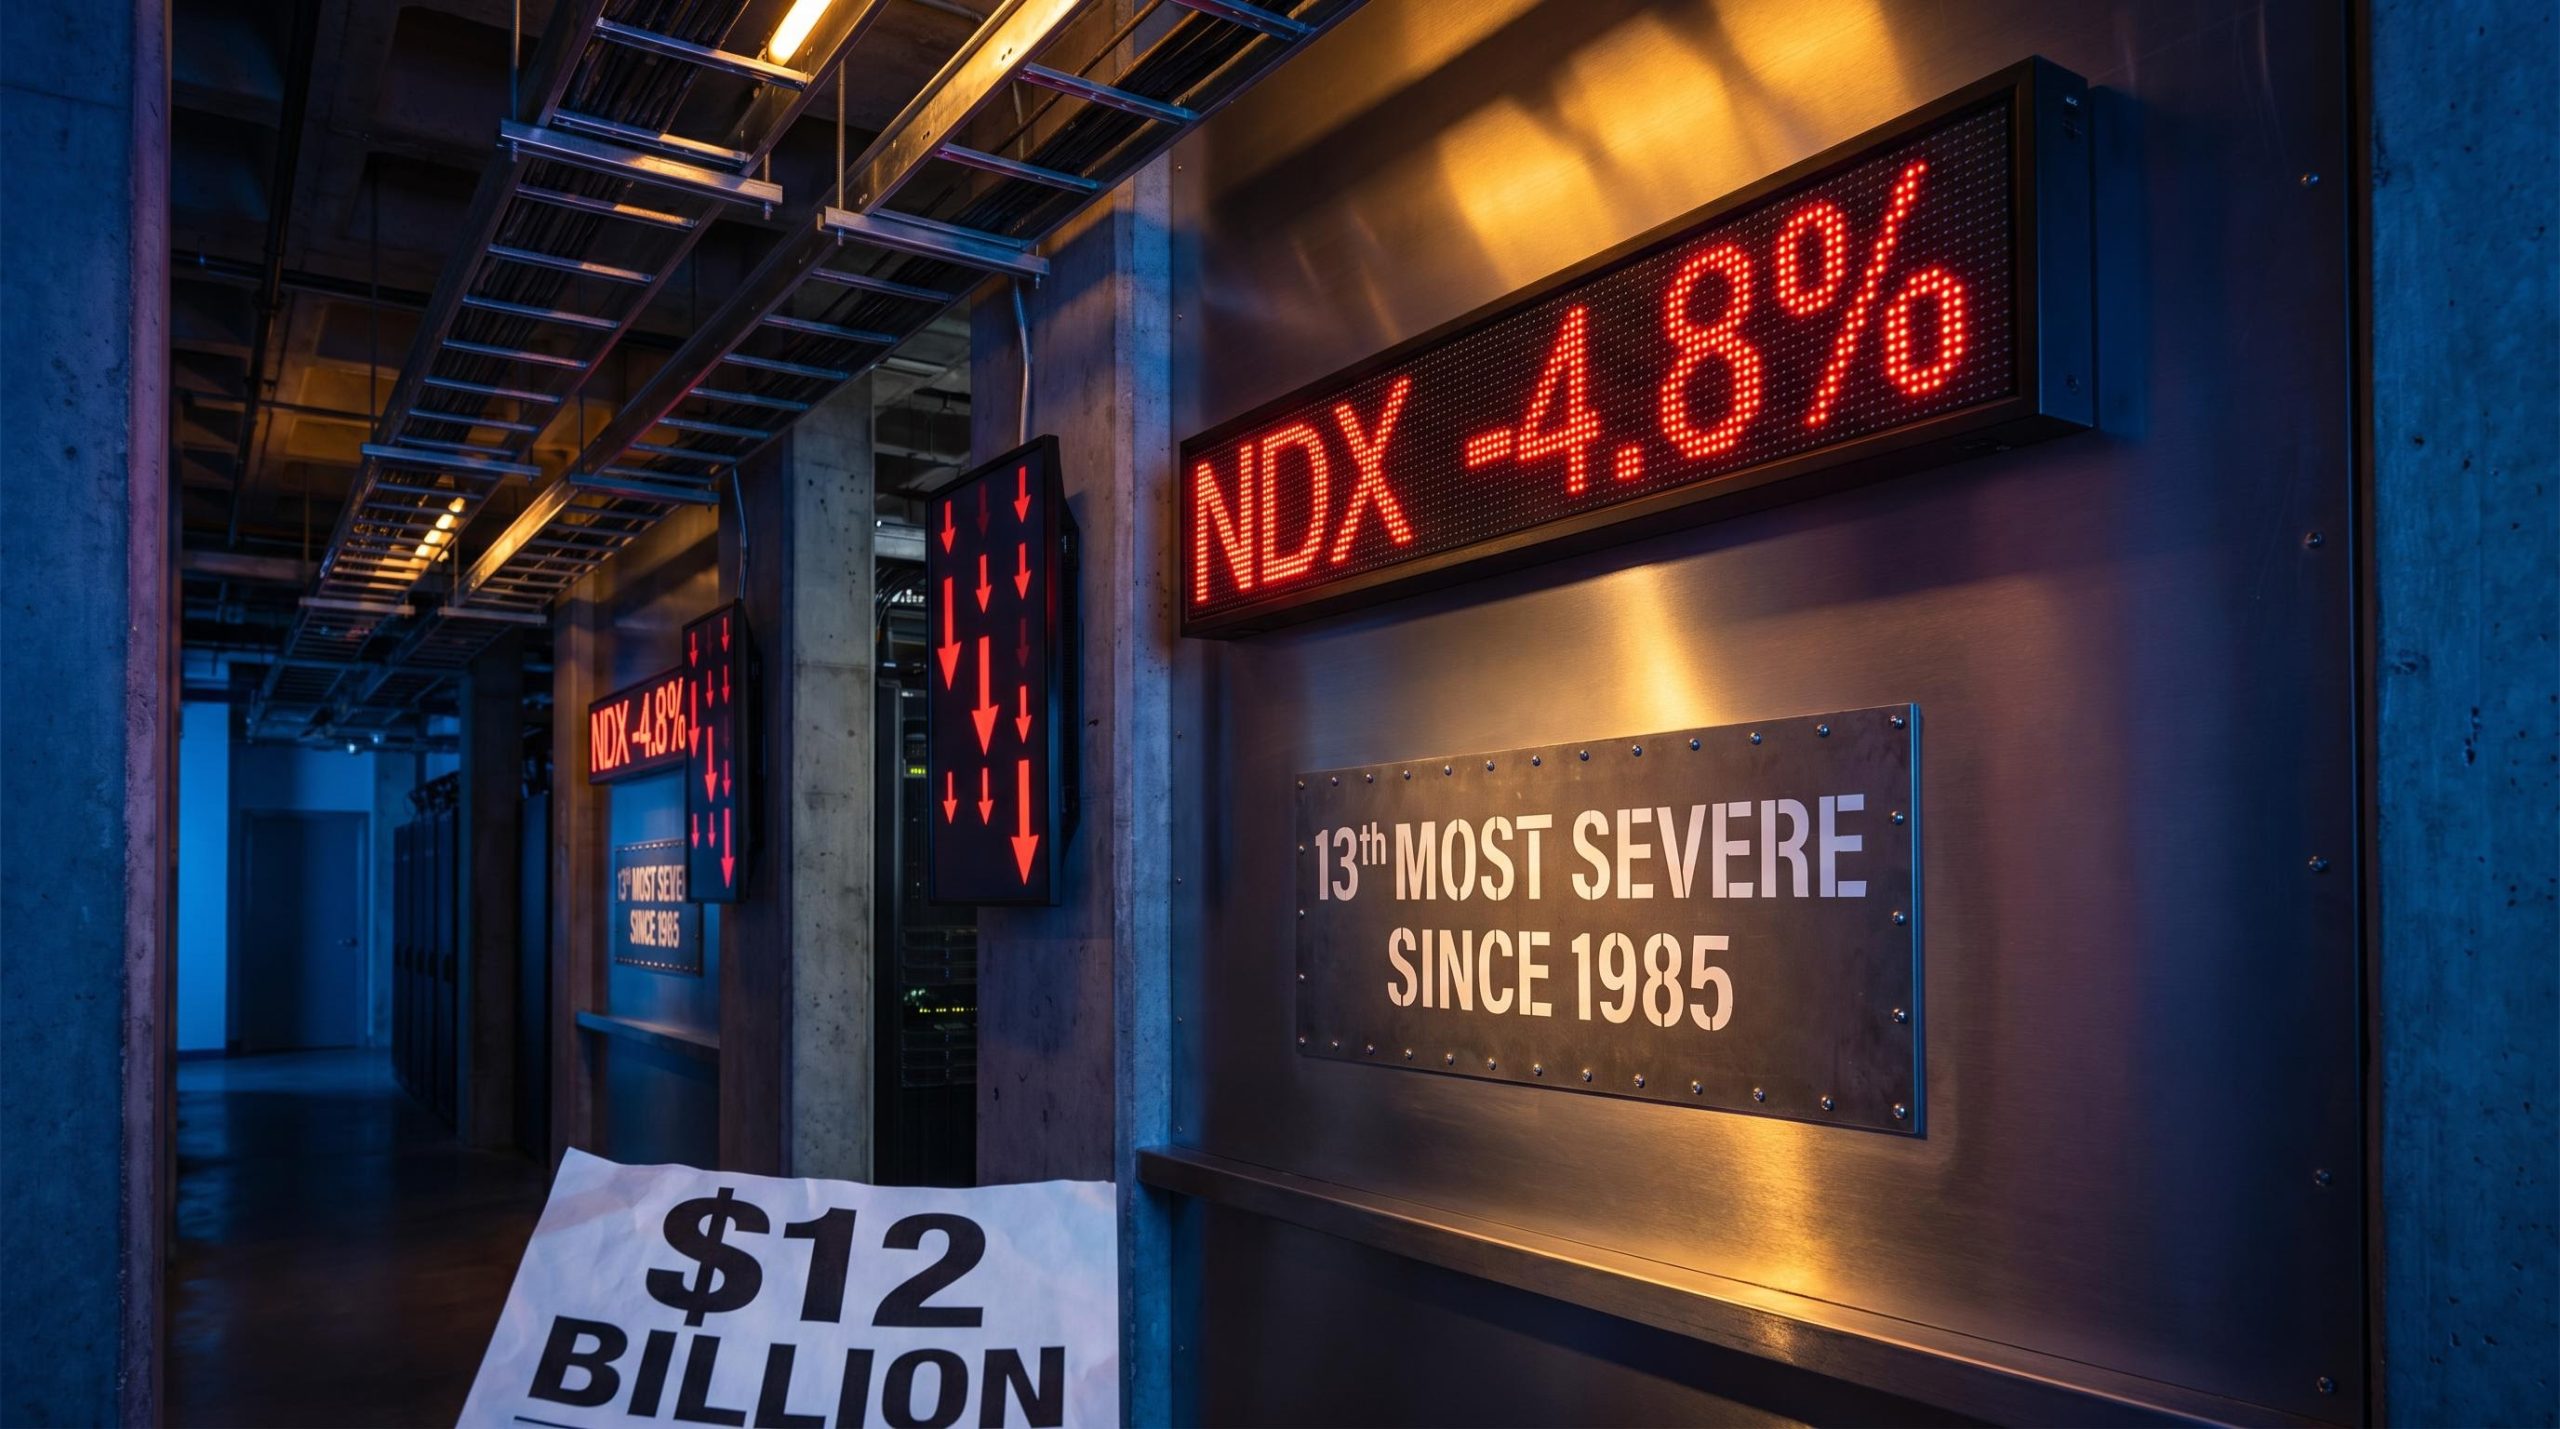
The 4.8% single-session decline on 6 June was not a routine pullback. Bank of America’s analysis placed it as the 13th most severe sigma-adjusted Nasdaq-100 drop since 1985, with the most recent comparable drawdown occurring in October 2025.
Leveraged and inverse exchange-traded fund products sold over $12 billion of NDX exposure during Friday’s session, a figure Kotecha’s note described as a record for such products. That volume alone signals the scale of mechanical pressure the session absorbed.
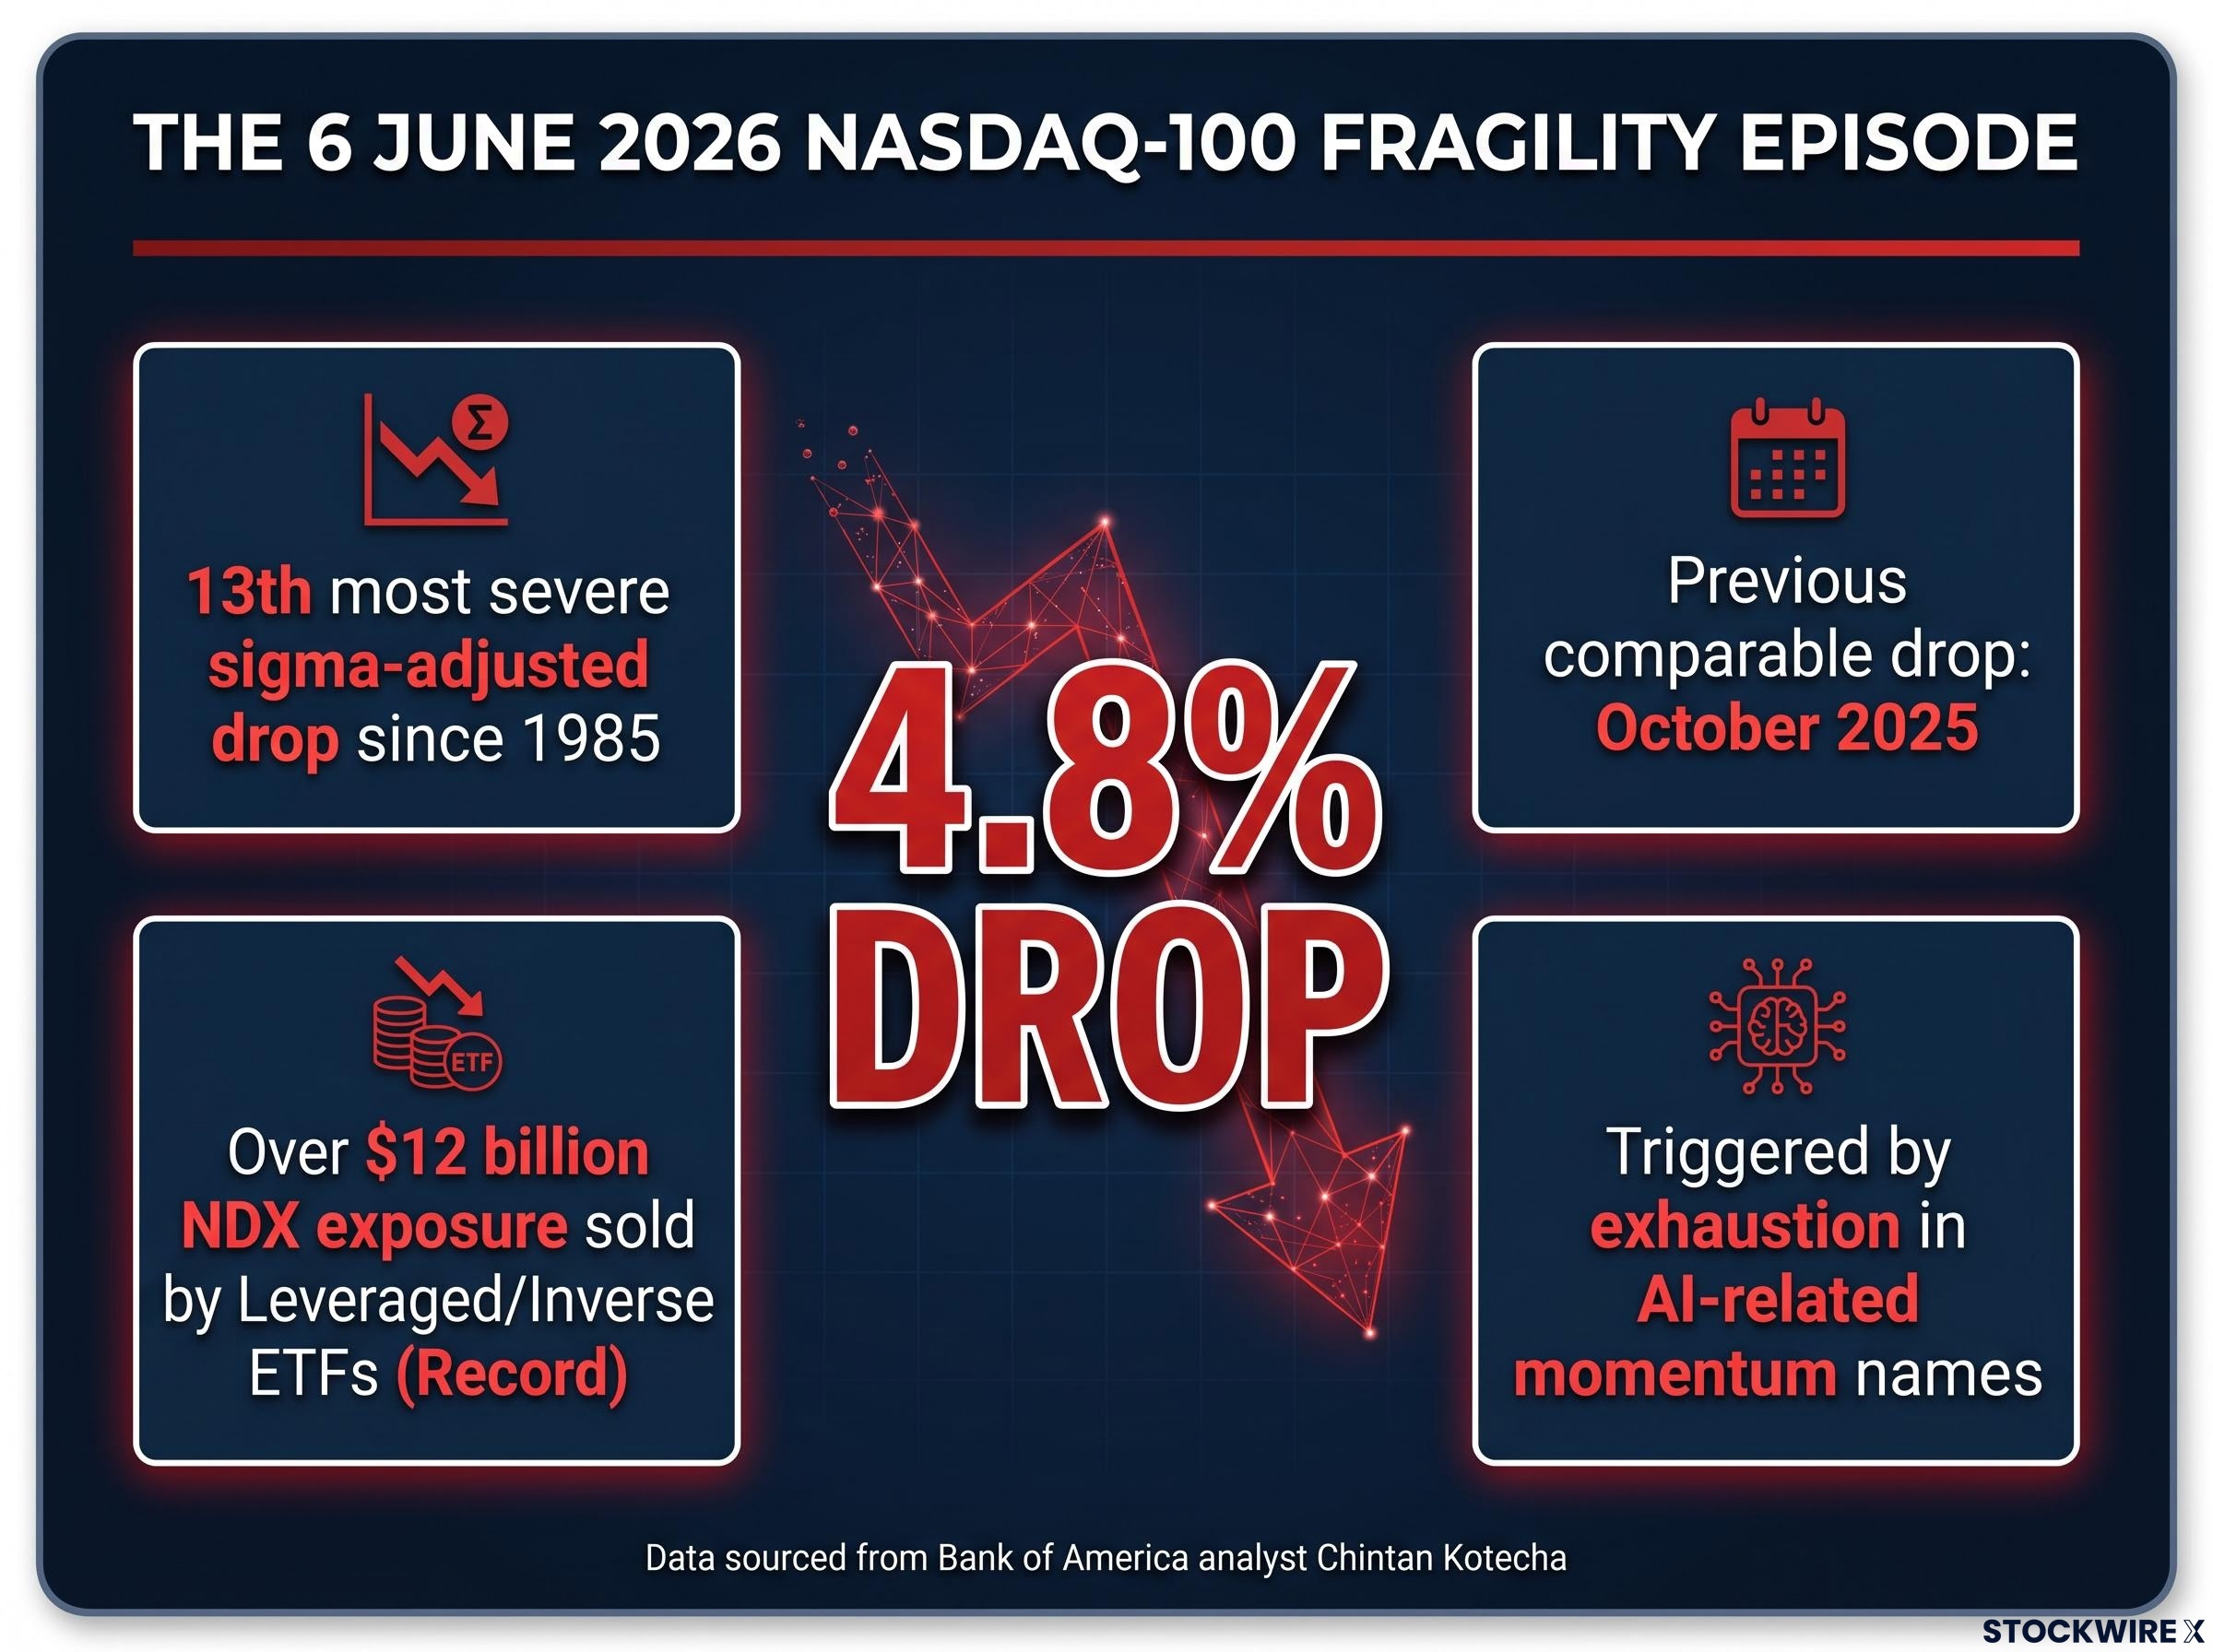
Kotecha characterised Friday’s move as a “fragility episode,” noting that extended upside momentum in AI-related names had reached an exhaustion point.
The session that preceded Friday’s selloff established the context for the fragility episode: the Broadcom AI miss on 5 June had already snapped a nine-consecutive-weekly-gains streak and concentrated losses in semiconductors, with passive investors in broad index funds carrying sector exposure close to five times higher than two years earlier, setting up the conditions BofA later described as momentum exhaustion.
The framing matters. A fragility episode implies structural vulnerability that preceded the drop, not a one-off reaction to a single catalyst. That distinction shapes everything that follows.
When big ASX news breaks, our subscribers know first
How CTA funds are wired to sell into falling markets
CTA funds, also known as managed futures strategies, generate buy and sell signals from price momentum and volatility inputs rather than discretionary views on earnings or the economy. When a trend-following model detects that an asset’s price has moved a defined distance against the prevailing trend, or that a moving average has been breached by a threshold margin, it reduces or exits the position automatically.
A second layer of mechanics compounds the effect. Volatility scaling means positions are sized to target a fixed risk budget. When realised volatility spikes, the same risk target requires smaller nominal positions, forcing reductions even when no new directional signal has fired.
Why the selling cascades
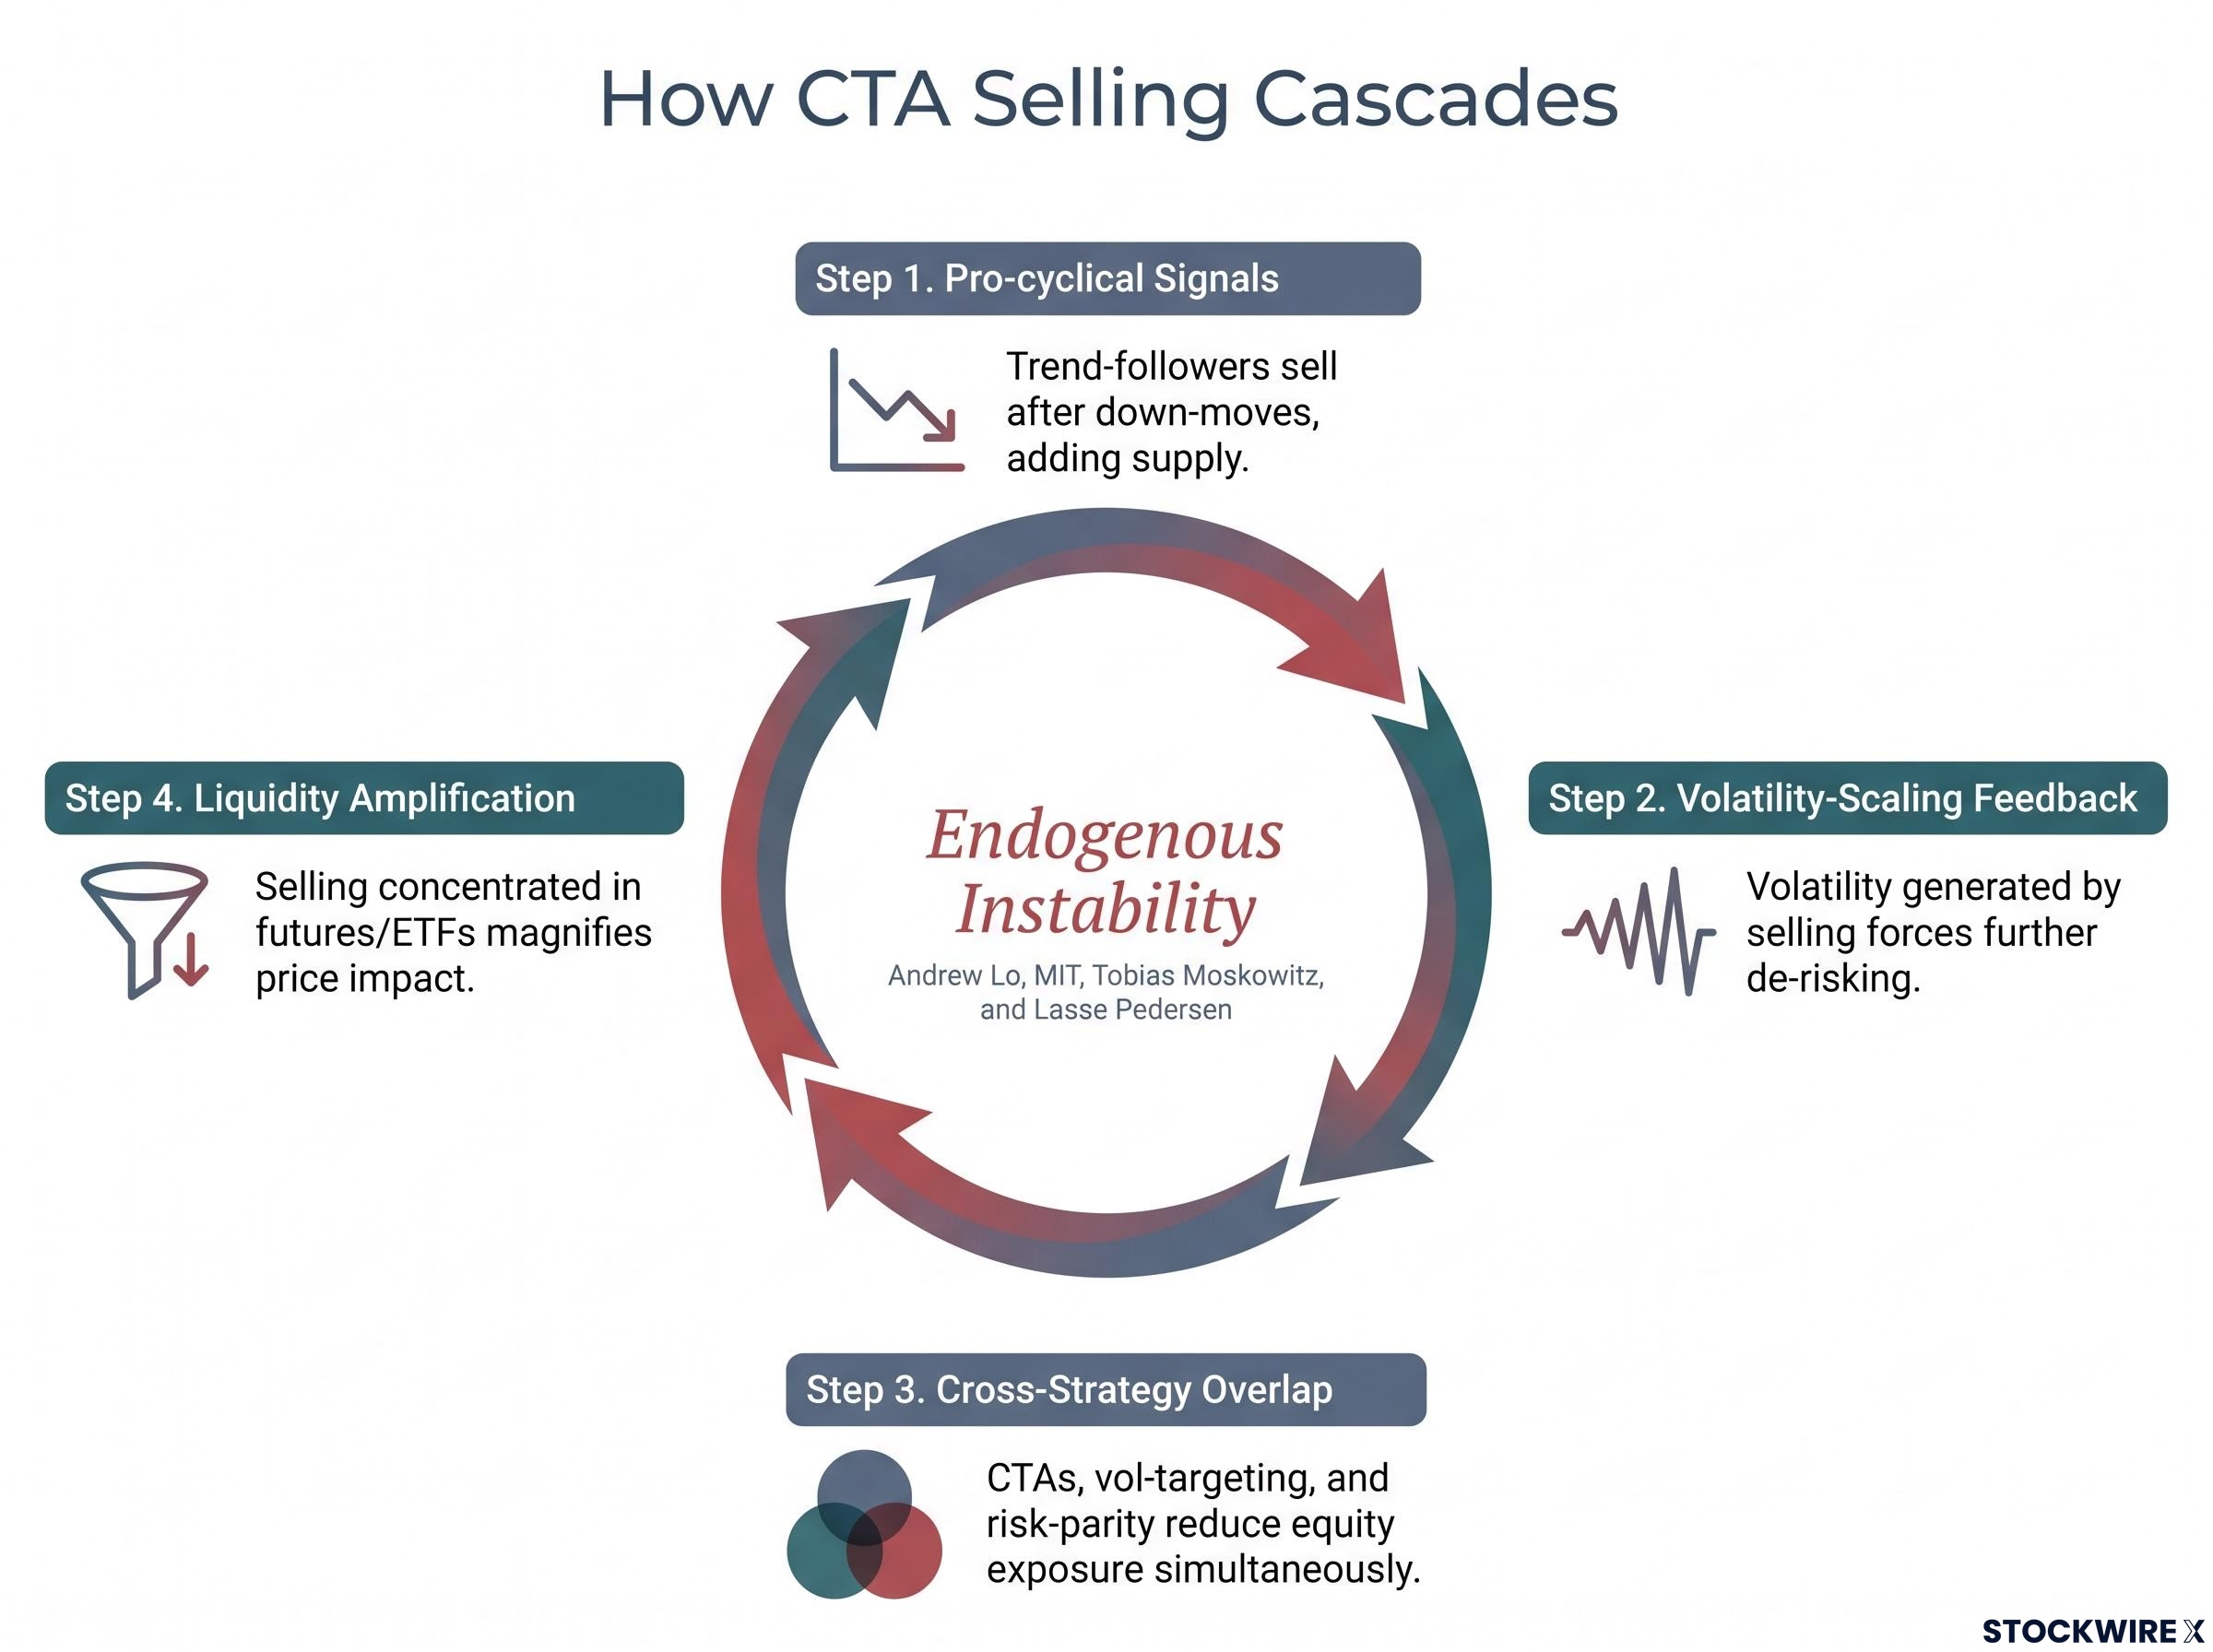
Academic work by Tobias Moskowitz and Lasse Pedersen on time-series momentum established that trend-following is inherently pro-cyclical: it buys after rises and sells after falls. Andrew Lo (MIT) has written extensively about how leverage and rules-based risk management can produce endogenous instability, where internal market dynamics amplify shocks. In practice, that academic framework plays out through four interacting mechanisms:
- Pro-cyclical signals: trend-followers sell after down-moves, adding supply into a falling market
- Volatility-scaling feedback: the volatility generated by selling forces further de-risking, which generates more selling
- Cross-strategy overlap: CTAs, volatility-targeting funds, and risk-parity strategies all reduce equity exposure simultaneously when volatility spikes, concentrating flows
- Liquidity amplification: selling concentrated in futures and major ETFs during thin liquidity magnifies price impact, potentially triggering additional model-level thresholds
Understanding that CTA selling is mechanical, not fundamental, explains why markets can drop sharply on no new news, and why the selling can accelerate in waves if price levels breach successive thresholds.
CTA long exposure remains largely intact as further trigger levels loom
Friday’s session absorbed heavy selling, but Kotecha’s analysis suggests the flush may be incomplete.
Bank of America estimated that at least half of existing CTA long positions may still be intact following Friday’s selloff, leaving meaningful further unwinding pressure ahead.
Goldman Sachs identified a parallel CTA selling threat in a note published days before Friday’s session, estimating that $93 billion in net long global equity exposure held by trend-following funds could trigger more than $100 billion in mechanical selling under a sustained one-month decline, a downside-to-upside ratio of approximately 2.7 to 1 compared with the maximum projected buying under stable conditions.
An additional Nasdaq-100 decline of roughly 90 basis points to 2% is BofA’s estimate of what is required to trigger broader CTA unwinds. The table below presents the bank’s model-implied stop-loss threshold estimates across three major U.S. indices. These are analyst estimates, not publicly disclosed fund rules.
| Index | Estimated additional decline to trigger unwind | BofA stop-loss range (pre-Friday) |
|---|---|---|
| Nasdaq-100 | ~90 bps to 2% | ~4.3% to 6.8% below prevailing levels |
| S&P 500 | ~40 bps to 2.6% | ~40 bps to 2.6% below current prices |
| Russell 2000 | ~2% to 5% | ~2% to 5% lower |
These thresholds give investors a concrete framework for understanding at what price levels systematic selling could intensify, rather than treating further downside as unpredictable.
How elevated options gamma masked Nasdaq fragility for weeks
The pre-selloff calm was not stability. It was suppression.
What dealer gamma does in a stable market
SPX gamma levels averaged approximately $6.4 billion per day across May and into early June 2026, a historically elevated figure. Kotecha estimated this gamma environment reduced realised volatility by approximately 1.3 volatility points over the preceding month.
BofA estimated that elevated dealer gamma suppressed realised volatility by approximately 1.3 volatility points over the month before the selloff.
When dealers are net long gamma, they buy index futures as the market falls and sell as it rises, dampening price swings. Goldman Sachs equity derivatives team members including Rocky Fishman have documented that in high-gamma regimes, options positioning can effectively pin the S&P 500 near large strike clusters, muting realised volatility until that gamma decays or is rolled. That low-volatility environment permitted CTA and volatility-targeting models to maintain or increase equity exposure, building the crowded long positions that became vulnerable when gamma support broke.
Barclays reached a parallel conclusion about AI rally hedging in early June, with analyst Stefano Pascale warning that standard put options may fail as protection due to strike drift risk and recommending lookback puts that set the strike retrospectively at the highest market level during the option’s life, a structure specifically designed for the kind of momentum-exhaustion selloff BofA characterised on Friday.
When gamma flips, dealer hedging becomes a tailwind for selling
When the market moves through levels where dealers’ net gamma changes sign, hedging flows reverse: dealers sell futures as the market falls rather than buying. Nomura’s Charlie McElligott documented these “gamma flip” dynamics across 2020-2022, linking them to abrupt accelerations in downside moves when indices broke below strikes with heavy open interest.
On 6 June, this dynamic interacted with CTA selling. Morgan Stanley equity strategists including Chris Metli have observed in prior stress episodes (2020-2023) that when dealers lose long-gamma exposure and CTAs simultaneously reduce risk, the combined effect produces non-linear downside where each incremental drop triggers additional mechanical selling from both sources.
What retail investors holding Nasdaq positions need to understand now
Systematic deleveraging produces large price moves that appear disproportionate to any single headline. This is a feature of the episode, not a signal about underlying company fundamentals. February 2018 demonstrated that the S&P 500 can drop over 4% in a single session driven primarily by mechanical rather than fundamental factors. The October to December 2018 period showed that when trend signals weaken over time, tech and growth names can underperform through a multi-month grind, not just a one-day shock.
The AMF analysis of the February 2018 VIX spike concluded that the episode was driven less by fundamental deterioration than by technical feedback loops in volatility-linked products, a finding that directly parallels the mechanical rather than fundamental character of Friday’s Nasdaq-100 drop.
The specific risks for Nasdaq-exposed portfolios in this environment include:
- Headline-disproportionate moves: systematic sellers target index futures and broad ETFs, producing outsized index-level declines on no new company-specific news
- Correlation spikes within tech: during systematic unwinds, AI and technology names move together because the selling is at the index and factor level, which means diversification within a Nasdaq-heavy portfolio offers limited protection
- Leveraged ETF path dependency: leveraged and inverse Nasdaq ETFs magnify both gains and losses through daily rebalancing mechanics; Friday’s record $12 billion in NDX sales by such products underscores their contribution to end-of-day stress flows
- Whipsaw and volatility clustering: after initial deleveraging, markets typically remain more volatile, with sharp rallies and declines that can trap investors who misinterpret short-covering bounces as fundamental “all clear” signals
Multi-year investors with intact fundamental theses face a different risk profile than leveraged or liquidity-constrained holders. The distinction matters: mechanical deleveraging is not a statement about company earnings or AI adoption trajectories.
The case that further unwinds follow depends on whether lower thresholds hold
The case for stability: mechanical overhang may be largely behind the market
After a sharp drop and volatility spike, trend signals flatten and vol-targeting models slash risk. Subsequent downside may see less systematic selling because there is simply less exposure remaining to unwind. Goldman Sachs derivatives research in various post-selloff notes (2020-2022) argued that once CTAs and vol-targeting have deleveraged, the forced-selling overhang is reduced and markets can stabilise if fundamentals are not deteriorating sharply. Discretionary investors may step in as CTAs exit, providing a stabilising bid, and dealers may rebuild long-gamma exposure at lower levels.
The case for a second wave: half the positions and lower stop bands still ahead
BofA’s estimate that at least half of CTA longs remain intact means lower stop bands, ranging from 4.3% to 6.8% below pre-Friday levels for the Nasdaq-100, could be hit in a second wave if the index continues to slide. Dealers potentially operating in a short-gamma regime would amplify each incremental decline rather than absorb it.
JPMorgan’s Marko Kolanovic argued in 2018 and subsequent years that high leverage combined with low-volatility regimes can reprice sharply, and that systematic unwinds can require multiple legs down to fully complete.
The stronger payrolls report on 6 June reinforced CTA short positions in Treasuries, according to BofA, adding a rates-market dimension to the systematic positioning story. The ambiguity between these two camps is not a failure of analysis. It is the actual state of the evidence.
BCA Research’s MacroQuant model adds a structural dimension to the mechanical picture: its composite equity valuation z-score reached -0.69 in June 2026, approaching the -1 threshold that has preceded every major bear market in the model’s 25-year history, with U.S. households holding equity exposure equivalent to roughly 230% of GDP against a personal saving rate of just 2.6%, a combination that amplifies the consequences of any sustained systematic deleveraging beyond a single-episode resolution.
Leveraged ETF selling at record levels signals a prolonged period of elevated risk
The unified picture is stark. A 4.8% single-session drop. The 13th most severe sigma event since 1985. A record $12 billion in leveraged ETF NDX sales. At least half of CTA long positions estimated to remain intact. And a threshold of just 1-2% additional Nasdaq-100 decline separating the current environment from broader systematic unwinds.
Bank of America’s Kotecha identified an additional 1-2% Nasdaq-100 decline as the threshold that could determine whether Friday’s deleveraging remains a single episode or becomes a cascading event.
All figures cited in this article are sourced from Bank of America analyst Chintan Kotecha’s client note, as reported by Investing.com on 8 June 2026. The question facing investors is not whether Friday was significant; the sigma ranking answers that. The question is whether systematic pressure resolves in one leg or two, and that answer depends on whether the lower thresholds hold.
This article is for informational purposes only and should not be considered financial advice. Investors should conduct their own research and consult with financial professionals before making investment decisions. Past performance does not guarantee future results. Forward-looking statements regarding CTA thresholds and positioning estimates are subject to change based on market developments.