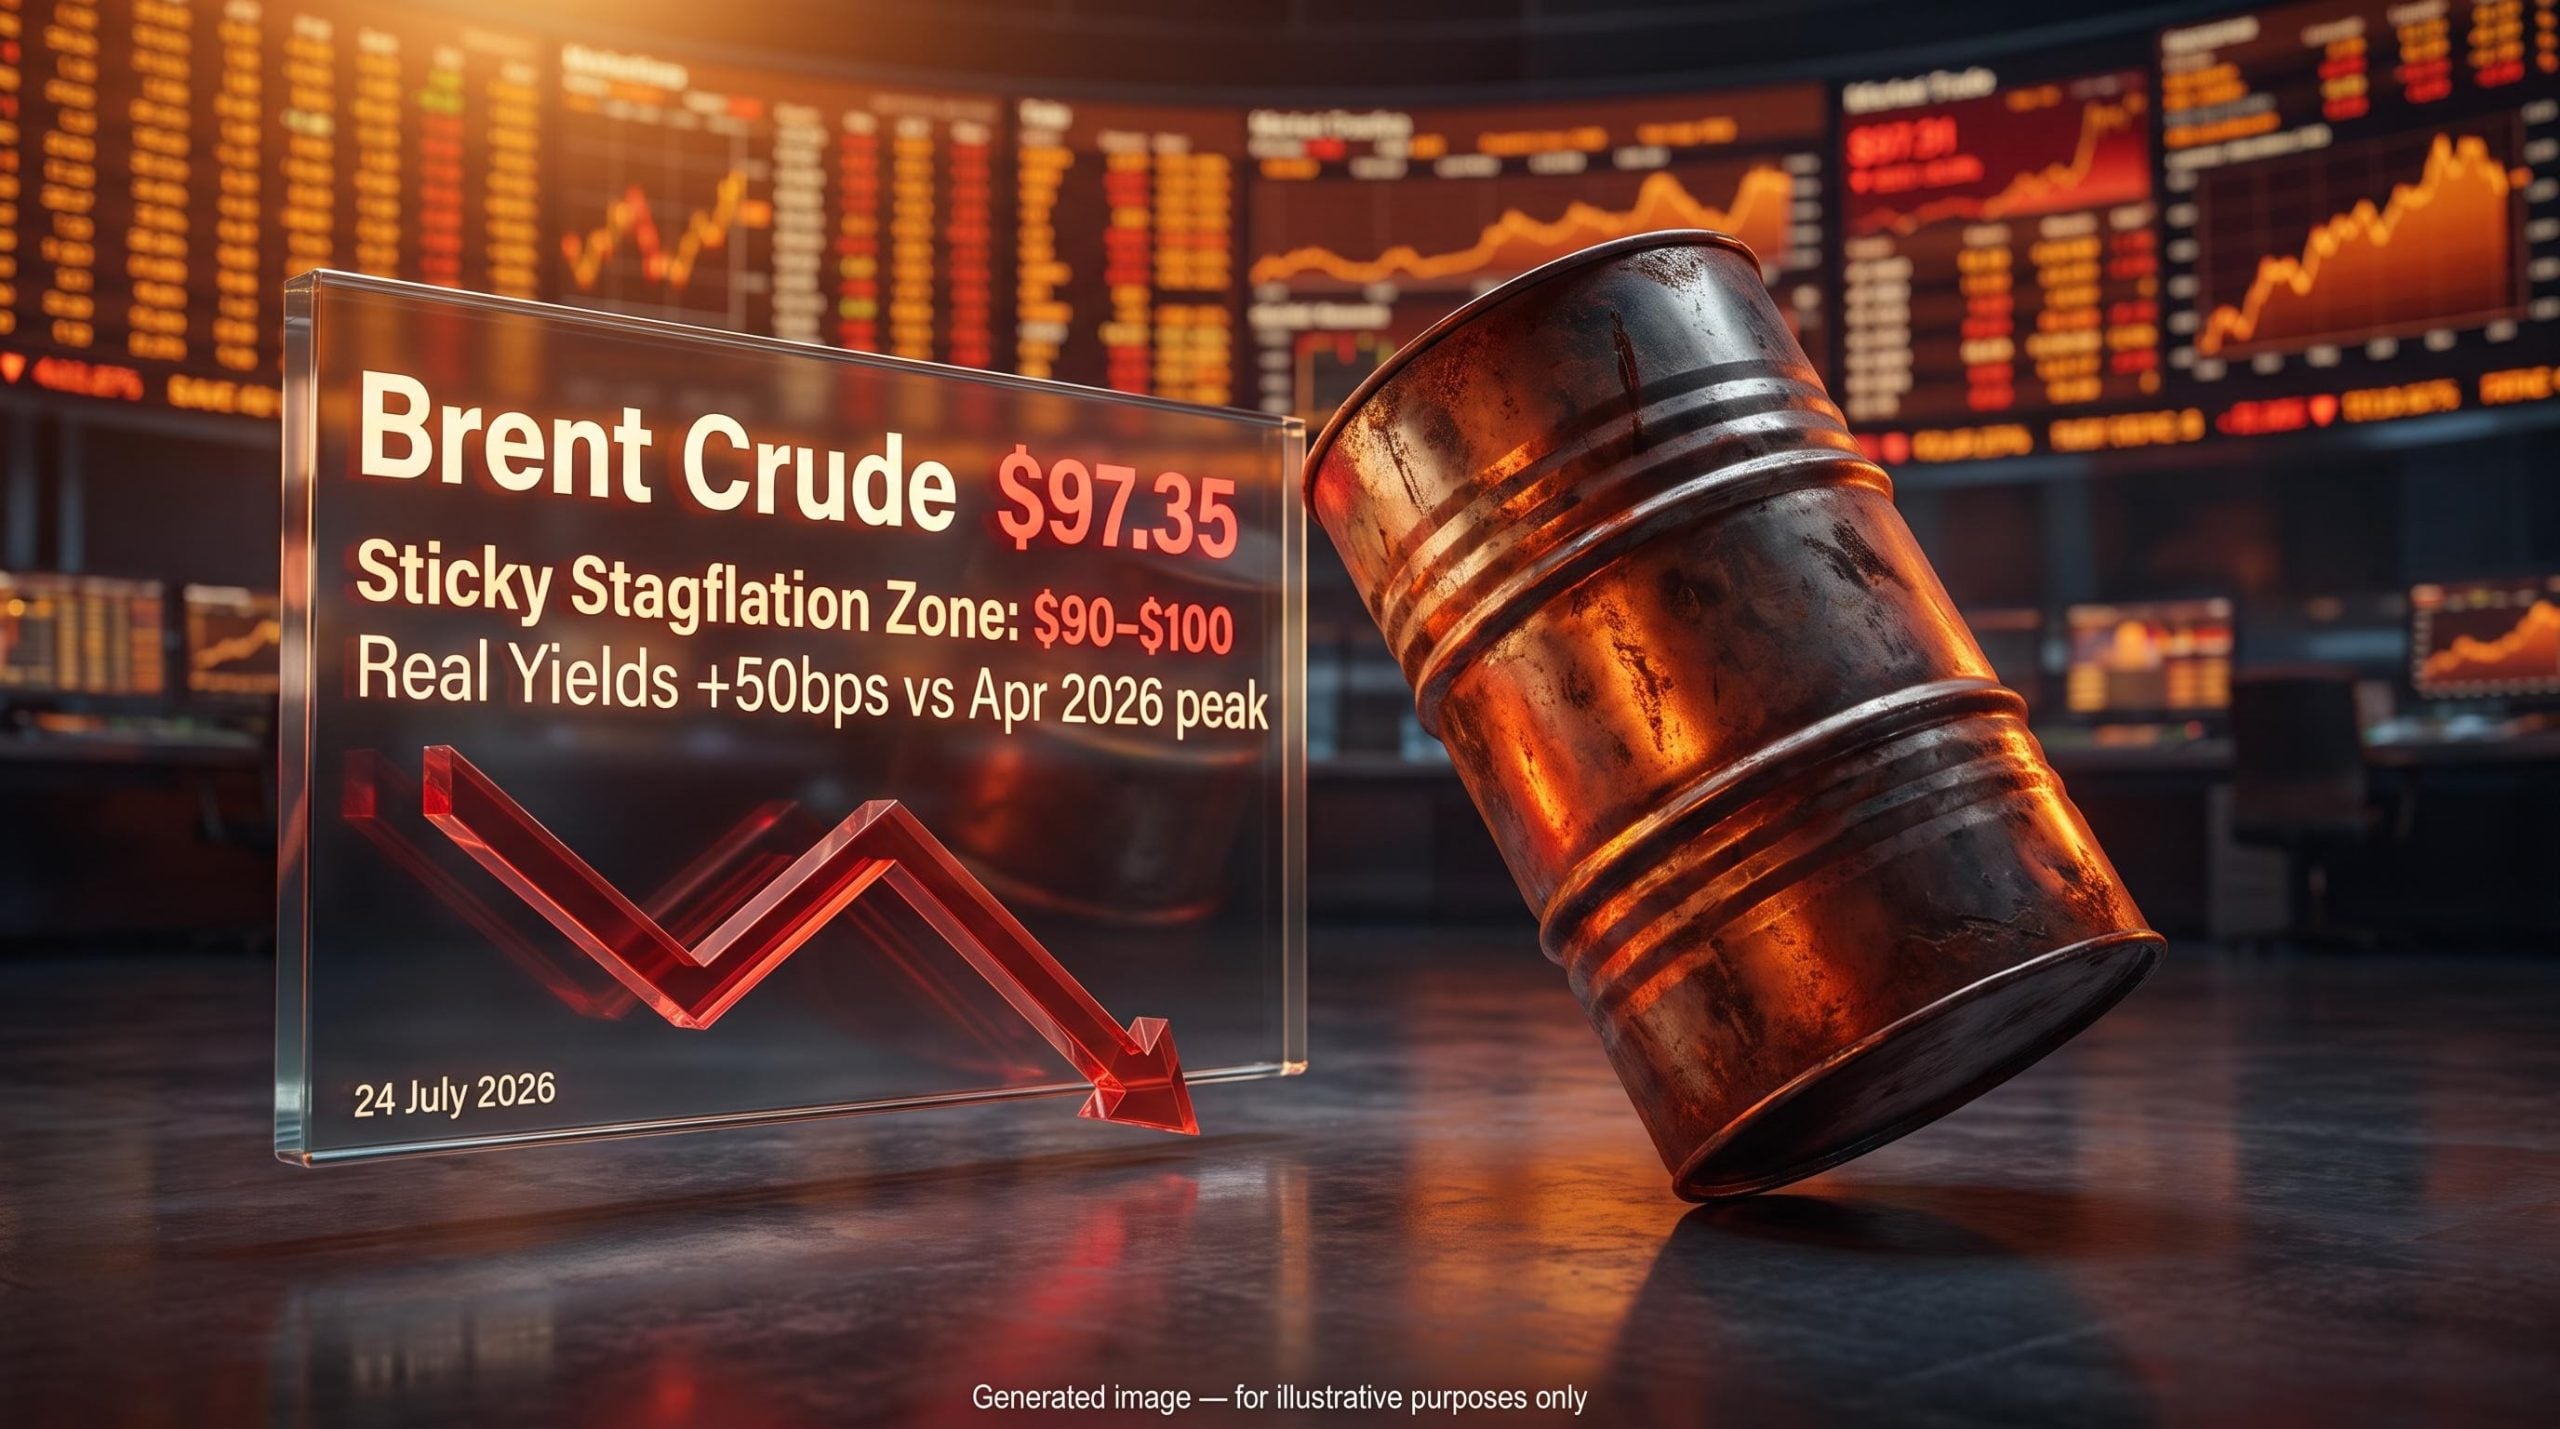
Oil at $97 is not simply an energy price. It is the level that activates a specific market configuration where inflation rises and growth does not, the combination that has historically done the most damage to equity portfolios. The rally investors have been watching since April, built on cyclical and financial sector leadership, is exactly what a supply-side oil shock dismantles first.
This moment is structurally distinct from the inflation episodes of 2022-2023. Those were demand-driven: earnings were rising, nominal GDP was expanding, and higher discount rates at least had partial cover from improving corporate profits. This episode has no such cover. Barclays strategists, led by Emmanuel Cau, made the distinction explicit on 24 July 2026: where prior inflation episodes were tied to strengthening demand, the current oil price environment reflects a supply-constrained shock rooted in unresolved U.S.-Iran tensions and OPEC+ policy choices rather than any acceleration in global economic activity. Brent crude at $97.35 per barrel changes the analytical framework, not just the energy sector outlook.
Here is the framework for understanding exactly how this shock transmits into equity markets, where the damage concentrates by sector and region, and the three scenarios you should be stress-testing your portfolio against before year-end.
This is not the inflation story investors navigated before
The temptation is to apply a 2022-2023 template: inflation ran hot, central banks hiked, markets eventually adjusted, and a broadening earnings recovery provided the floor. That template does not fit what is unfolding now, and the distinction is not academic. It is the difference between a market that can absorb higher rates and one that cannot.
The Fed’s frozen rate policy through five consecutive hold decisions has already demonstrated the policy paralysis that stagflation produces in practice, with JPMorgan raising its stagflation probability to 35% and Goldman Sachs projecting H2 2026 GDP growth of just 0.8% as of early May 2026.
In a demand-driven inflation episode:
- Earnings growth accelerates alongside prices, partially offsetting the drag from higher discount rates
- Nominal GDP expands, supporting revenue lines across cyclical sectors
- Central banks can tighten with some confidence that the economy can absorb it
In a supply-side shock:
- Input costs rise without a corresponding increase in revenues or incomes
- Real household purchasing power falls, compressing demand from below
- Earnings estimates face downward revision pressure at the same time discount rates are climbing
Barclays characterises the current episode as an “adverse supply-side energy shock,” explicitly distinguishing it from prior rate-driven inflation episodes tied to stronger growth expectations.
The numbers reinforce the distinction. Brent averaged approximately $85 in June, pulled back from an April peak, then rebounded sharply to $97.35 by 24 July. According to Barclays, U.S. real interest rates have climbed by approximately 50 basis points compared to their April 2026 peak. That repricing tells you the market has already adjusted once for the shifting inflation and rate environment, and that adjustment is not finished if oil stays at current levels.
When big ASX news breaks, our subscribers know first
Three channels through which an energy shock damages equity markets
The stagflation threat is not a single-vector problem. It compounds through three distinct channels, each reinforcing the others, and understanding the mechanics is what separates a considered portfolio response from a reactive one.
Channel A: Higher real yields compress valuations
Equity valuations rest on a simple principle: the present value of future cash flows. When the rate used to discount those cash flows rises, their present value falls. A supply-driven inflation flare pushes inflation expectations higher, keeps policy rates elevated for longer, and lifts real yields, which is the inflation-adjusted rate investors use to price future earnings.
In a stagflation setup, both sides of the valuation equation work against equities simultaneously. The discount rate moves up while the earnings outlook stays flat or deteriorates. Growth stocks and long-duration equities, whose cash flows sit furthest in the future, are disproportionately exposed to this compression. There is no earnings acceleration to cushion the blow.
Channel B: Energy as a universal cost that compresses margins
Energy is an input across virtually every industry. When oil prices spike on supply constraints, the cost pressure radiates outward into transport, agriculture, logistics, data infrastructure, and manufacturing. The margin problem splits companies into two camps, and neither outcome is good for markets as a whole.
Companies facing the most direct margin pressure include:
- Airlines and logistics operators with fuel as a dominant cost line
- Chemicals and petrochemicals producers
- Agricultural producers exposed to fertiliser and transport costs
- Industrial manufacturers with energy-intensive processes
- Data centre operators facing rising power costs
Companies with weak pricing power absorb the cost increase directly, shrinking margins. Companies with strong pricing power pass it through to customers, but that accelerates broader inflation, inviting further central bank restraint. Either way, the aggregate effect on equity earnings is negative.
Channel C: Cyclicals caught between weaker revenues and rising costs
Cyclical sectors face a double bind in this environment. Demand softens as consumer purchasing power falls, squeezing revenues from one side, while input costs simultaneously rise from the other. Industrials, autos, consumer discretionary, construction, and travel and leisure names are caught in this vice.
Financials have a more nuanced but still threatened profile. Higher rates initially support net interest margins, which is the spread between what banks earn on loans and what they pay on deposits. But stagflation raises credit risk as borrowers come under pressure, depresses loan demand, and can force higher provisions against potential losses. The April 2026 rally was led by financial and cyclical sectors, according to Barclays. That is the portfolio composition most exposed to exactly this kind of repricing, and it means the holdings that have performed best in recent months are likely the ones carrying the most risk right now.
What stagflation actually means: the central bank trap that extends the damage
Stagflation is the combination of stagnating economic growth and persistent inflation. It is the most difficult macro environment for policymakers because the standard monetary policy toolkit becomes self-defeating. Every lever they can pull solves one problem while worsening the other.
The dilemma breaks down cleanly:
- Tighten policy to fight inflation: Higher rates cool price pressures but further suppress an already weakening economy, raising recession risk and unemployment
- Ease policy to support growth: Lower rates or liquidity injection supports demand but risks unanchoring inflation expectations, potentially making the price problem worse and more entrenched
Neither path is clean, and this paralysis is the mechanism that keeps stagflation risk elevated for months rather than weeks. In a standard recessionary episode, central banks can cut aggressively. In a standard inflationary episode, they can hike with confidence that the economy can absorb it. In a supply-side stagflationary mix, they are stuck.
The Federal Reserve policy trap that stagflation creates is not a new analytical concept, but the June 2026 episode made the mechanism unusually visible: U.S.-Iran military escalation coincided with producer prices hitting 6.5% year-over-year on the same day, compressing the Fed’s decision space from both directions simultaneously.
Barclays cites “robust earnings momentum” as a partial counterweight to the stagflation risk, but flags its durability as explicitly uncertain if energy prices remain elevated at current levels.
Rising inflation breakeven rates on both sides of the Atlantic confirm that markets are already pricing this dilemma, even as recent inflation data had been showing softening trends. The policy trap is not a background macro condition you can ignore. It means portfolio decisions made today carry a longer time horizon of exposure than you may have assumed, and waiting for a central bank pivot to solve the problem is not a sound strategy in this environment.
Where the damage concentrates: Europe versus the United States, and sector by sector
Not all equity markets face this shock equally. The damage profile depends on index composition, energy import dependency, and which sectors led the most recent rally.
European equity markets are structurally more exposed in this specific shock type. Europe is more energy-import-dependent, carries heavier industrial and cyclical weighting in its major indices, and has historically been more sensitive to oil and gas price spikes. Barclays flagged that European markets have been driven higher since April 2026 by financial and cyclical sector outperformance, precisely the areas most at risk from a stagflation repricing. For a European equity holder whose portfolio reflects that April-to-July rally composition, the sector breakdown here is a direct map of current risk exposure.
U.S. markets are somewhat more insulated, though not immune. A larger domestic energy sector benefits directly from higher prices. Heavier weighting in mega-cap technology and quality growth names means U.S. indices are hit by higher real yields but less directly affected by imported energy cost shocks.
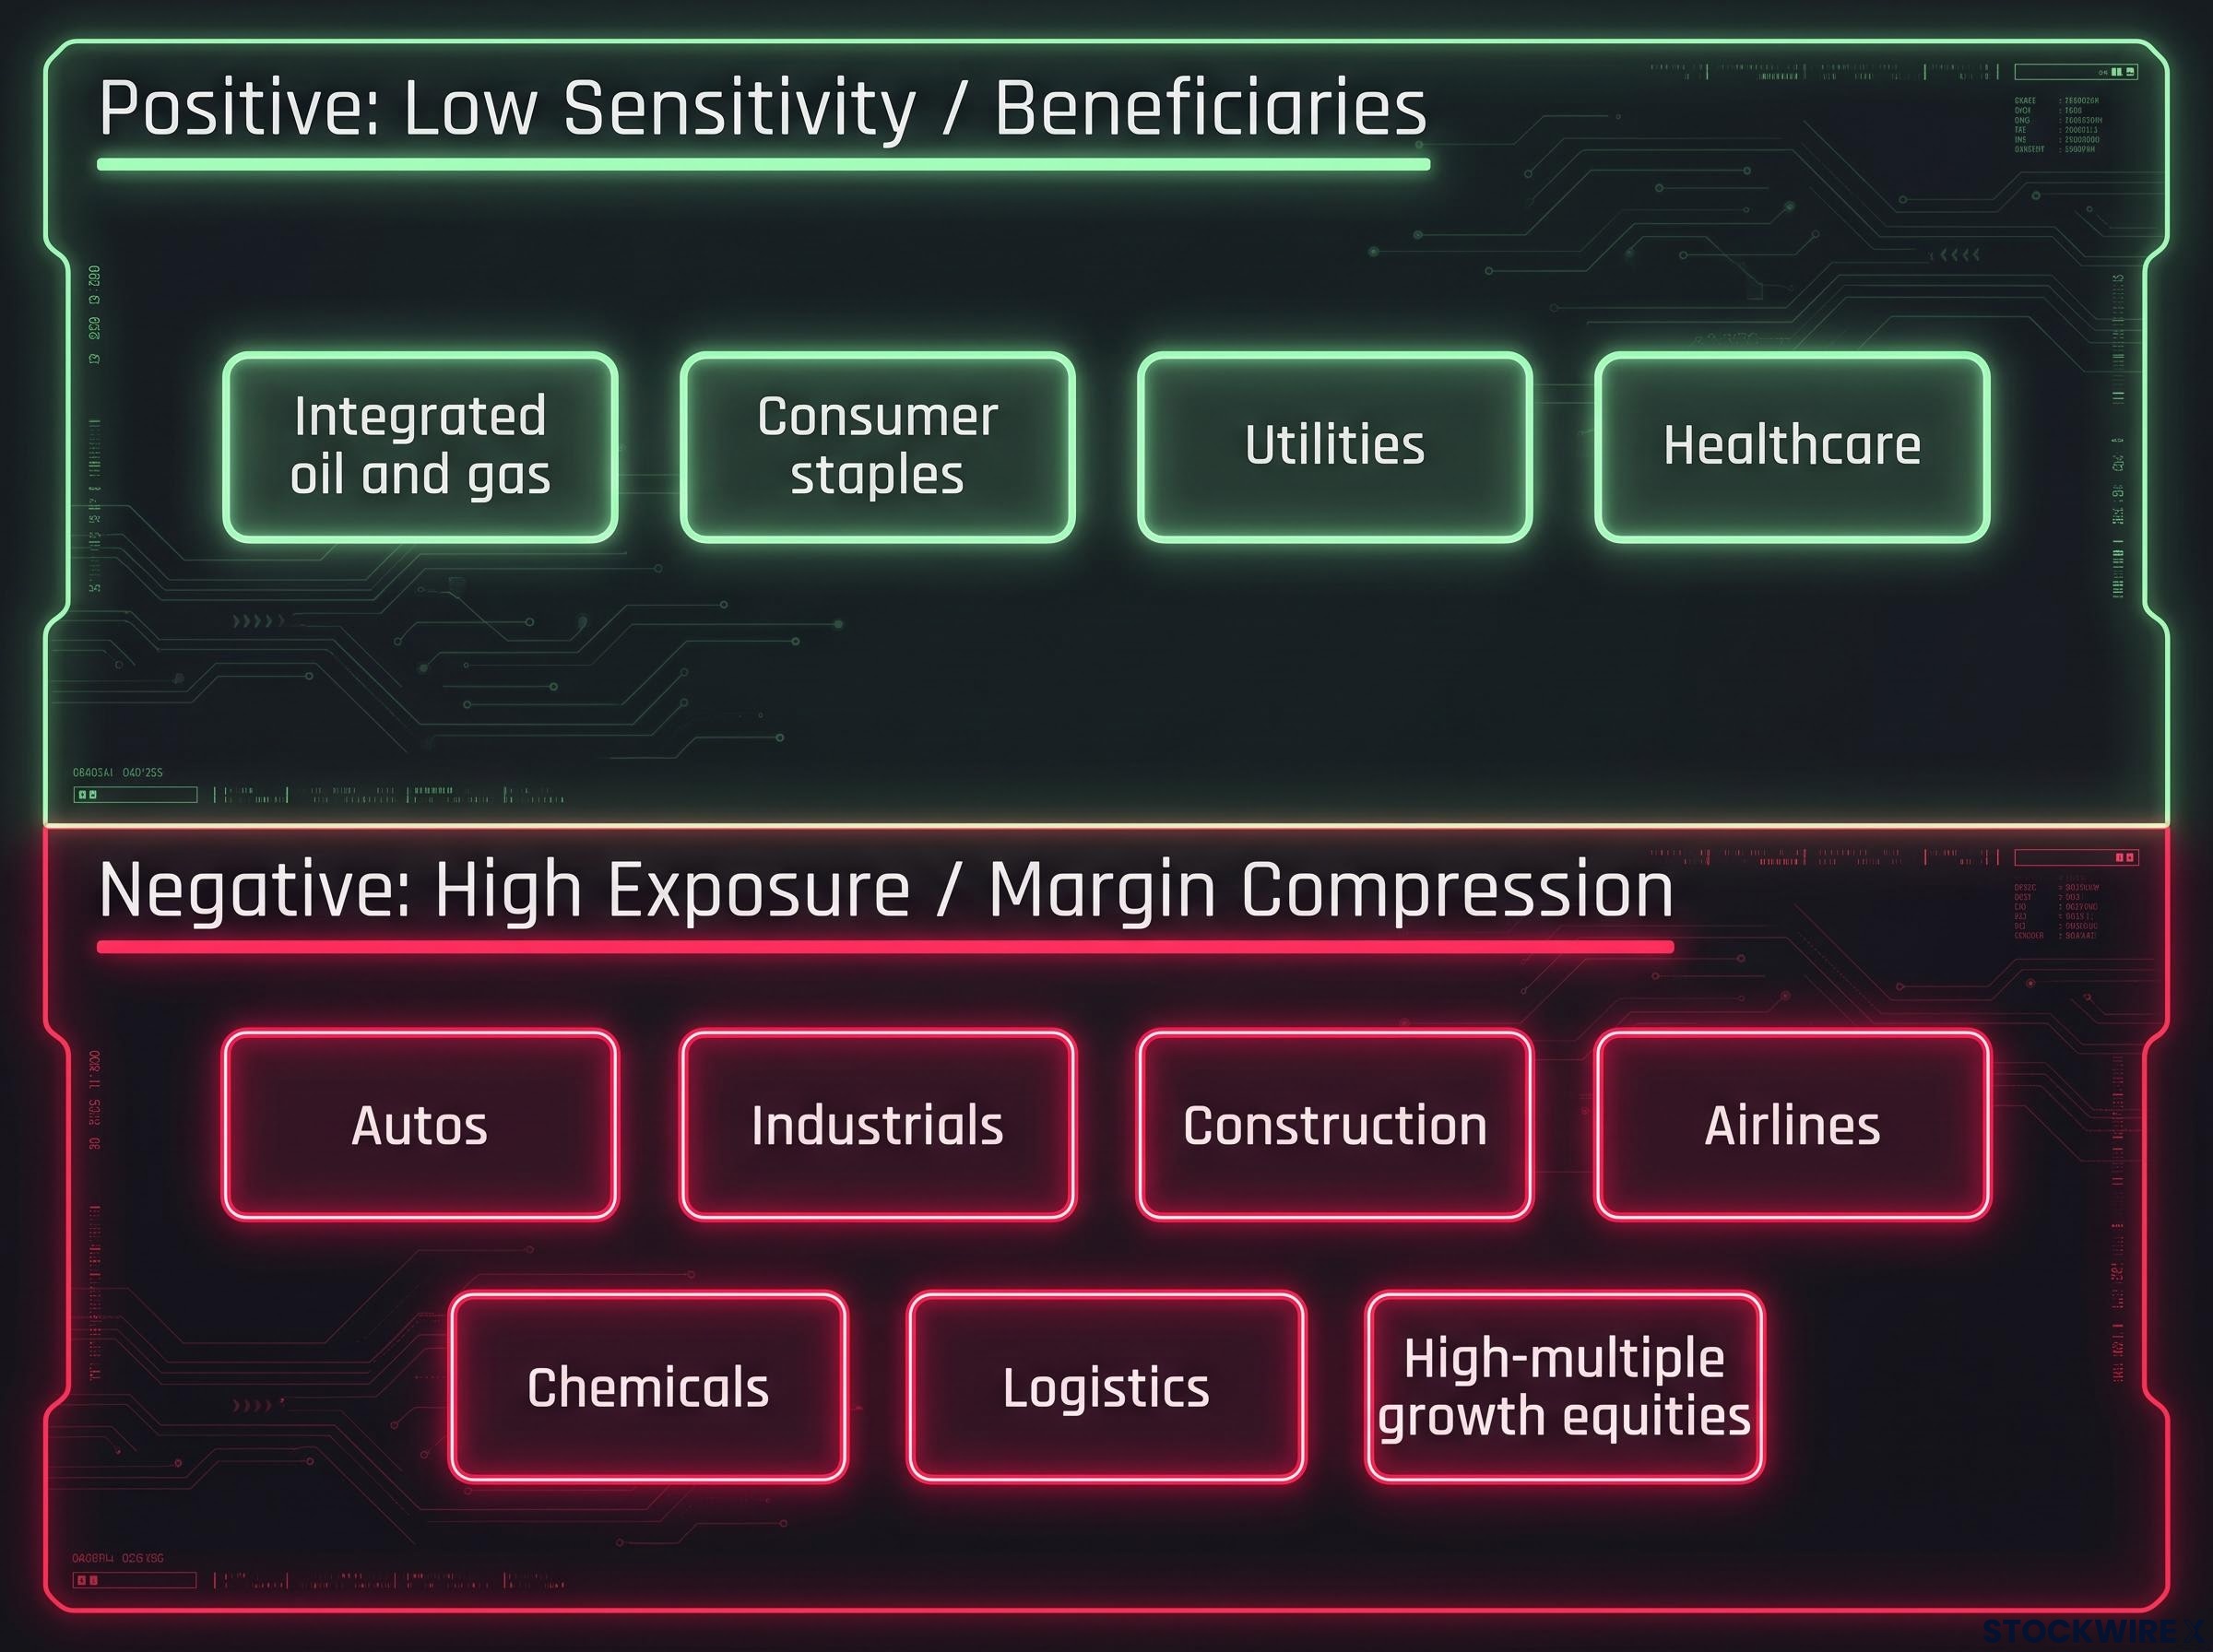
Relative winners in a stagflationary environment include:
- Energy and integrated oil and gas, the direct beneficiaries of higher prices
- Quality defensives: consumer staples, utilities, healthcare, and regulated infrastructure with more stable demand and inflation pass-through
- Value-oriented names with high free cash flow and near-term cash flows, which are less sensitive to rising real yields
| Sector / Category | Stagflation Exposure | Directional Read |
|---|---|---|
| Integrated oil and gas | Direct beneficiary | Positive: revenue uplift from higher prices |
| Consumer staples / Utilities / Healthcare | Low sensitivity | Positive: stable demand, inflation pass-through |
| Autos / Industrials / Construction | High: cost and demand squeeze | Negative: margin compression plus weaker volumes |
| Airlines / Chemicals / Logistics | High: direct energy cost exposure | Negative: fuel and power costs dominate cost base |
| High-multiple growth equities | High: discount rate sensitivity | Negative: valuation compression as real yields rise |
Three scenarios to stress-test before year-end
The value of a scenario framework is that it gives you a structured way to hold uncertainty rather than forcing a point forecast that will almost certainly be wrong. Barclays identifies Sticky Stagflation as the key near-term risk, and the variables that determine which scenario unfolds are primarily geopolitical rather than macroeconomic.
Oil shock history across the 2008, 2011, and 2022 episodes shows that every prior crossing of the $100 Brent threshold produced S&P 500 returns materially below the index’s long-run average over the following 12 months, a pattern that reinforces the case for stress-testing portfolios against sustained rather than transient price elevation.
Barclays identifies the Sticky Stagflation scenario, with Brent sustained in the $90-$100 range, as the key near-term risk for equity markets. Geopolitical supply constraints are flagged as more influential than traditional macro data releases in this environment.
| Scenario | Brent Range | Key Trigger | Market Implication |
|---|---|---|---|
| Reversal | $70-$80 | U.S.-Iran diplomatic progress or OPEC+ policy shift | Stagflation narrative fades; cyclicals and financials rebound sharply |
| Sticky Stagflation | $90-$100 | Geopolitical status quo; no supply resolution | Multiple compression plus slower EPS growth; defensives and energy outperform |
| Escalation | Above $100 sustained | Further geopolitical disruption; supply shock deepens | Recession risk rises materially; risk-off across most assets; credit spreads widen |
The three primary variables that determine which scenario unfolds are U.S.-Iran diplomatic progress, OPEC+ policy posture, and central bank reaction functions from the Fed and ECB specifically. The scenario framework is not a prediction exercise. It is a portfolio stress test, and your job is to identify which of your current positions only survive in Scenario 1 and whether those positions are sized appropriately for that single-outcome dependency.
What the oil price level changes, and what it does not
At $97 Brent, the probability of a stagflation-like mix in the near term is materially higher than it was two months ago. The portfolio logic that follows, as Barclays identifies, is more defensive, quality-tilted equity positioning with at least some explicit inflation and energy exposure, rather than an aggressive pro-cyclical bet on a smooth soft landing.
Three monitoring variables will signal which scenario is actually unfolding:
- Oil price trajectory relative to the $90-$100 sticky zone: Whether Brent holds in this range, breaks above $100, or retraces toward $80 determines which analytical framework applies
- Central bank communication on inflation tolerance: Specifically whether the Fed and ECB signal willingness to tolerate above-target inflation or commit to further tightening into slowing growth
- Earnings revision direction in cyclical sectors: The durability of earnings momentum is the key swing variable in the Sticky Stagflation scenario; downward revisions confirm the supply-shock transmission is reaching corporate profits
What has not changed is equally important. A diplomatic resolution on U.S.-Iran tensions or an OPEC+ policy shift could alter the picture materially. Investors who abandon all cyclical exposure on a single data point are making a different positioning error, one of overcorrection rather than complacency. The correct read is not “sell everything cyclical” but rather size cyclical positions for the risk that they only work in Scenario 1, and make sure your portfolio has explicit exposure to the scenarios where that does not play out.
Whether the current episode resolves or entrenches depends in part on whether it intersects with a structural inflation regime that predates the oil shock; the case that 13 simultaneous reversals of disinflationary forces have shifted the long-run inflation baseline upward argues that even a diplomatic resolution on Hormuz would not return markets to the pre-2022 rate environment.
Map your portfolio behaviour across Brent at $70, $90, and $110 by year-end. Any position that only survives in one of those three worlds is telling you something about its risk profile that the recent rally may have obscured.
This article is for informational purposes only and should not be considered financial advice. Investors should conduct their own research and consult with financial professionals before making investment decisions. Forward-looking statements, including scenario frameworks and price projections, are speculative and subject to change based on market developments, geopolitical outcomes, and central bank policy decisions.