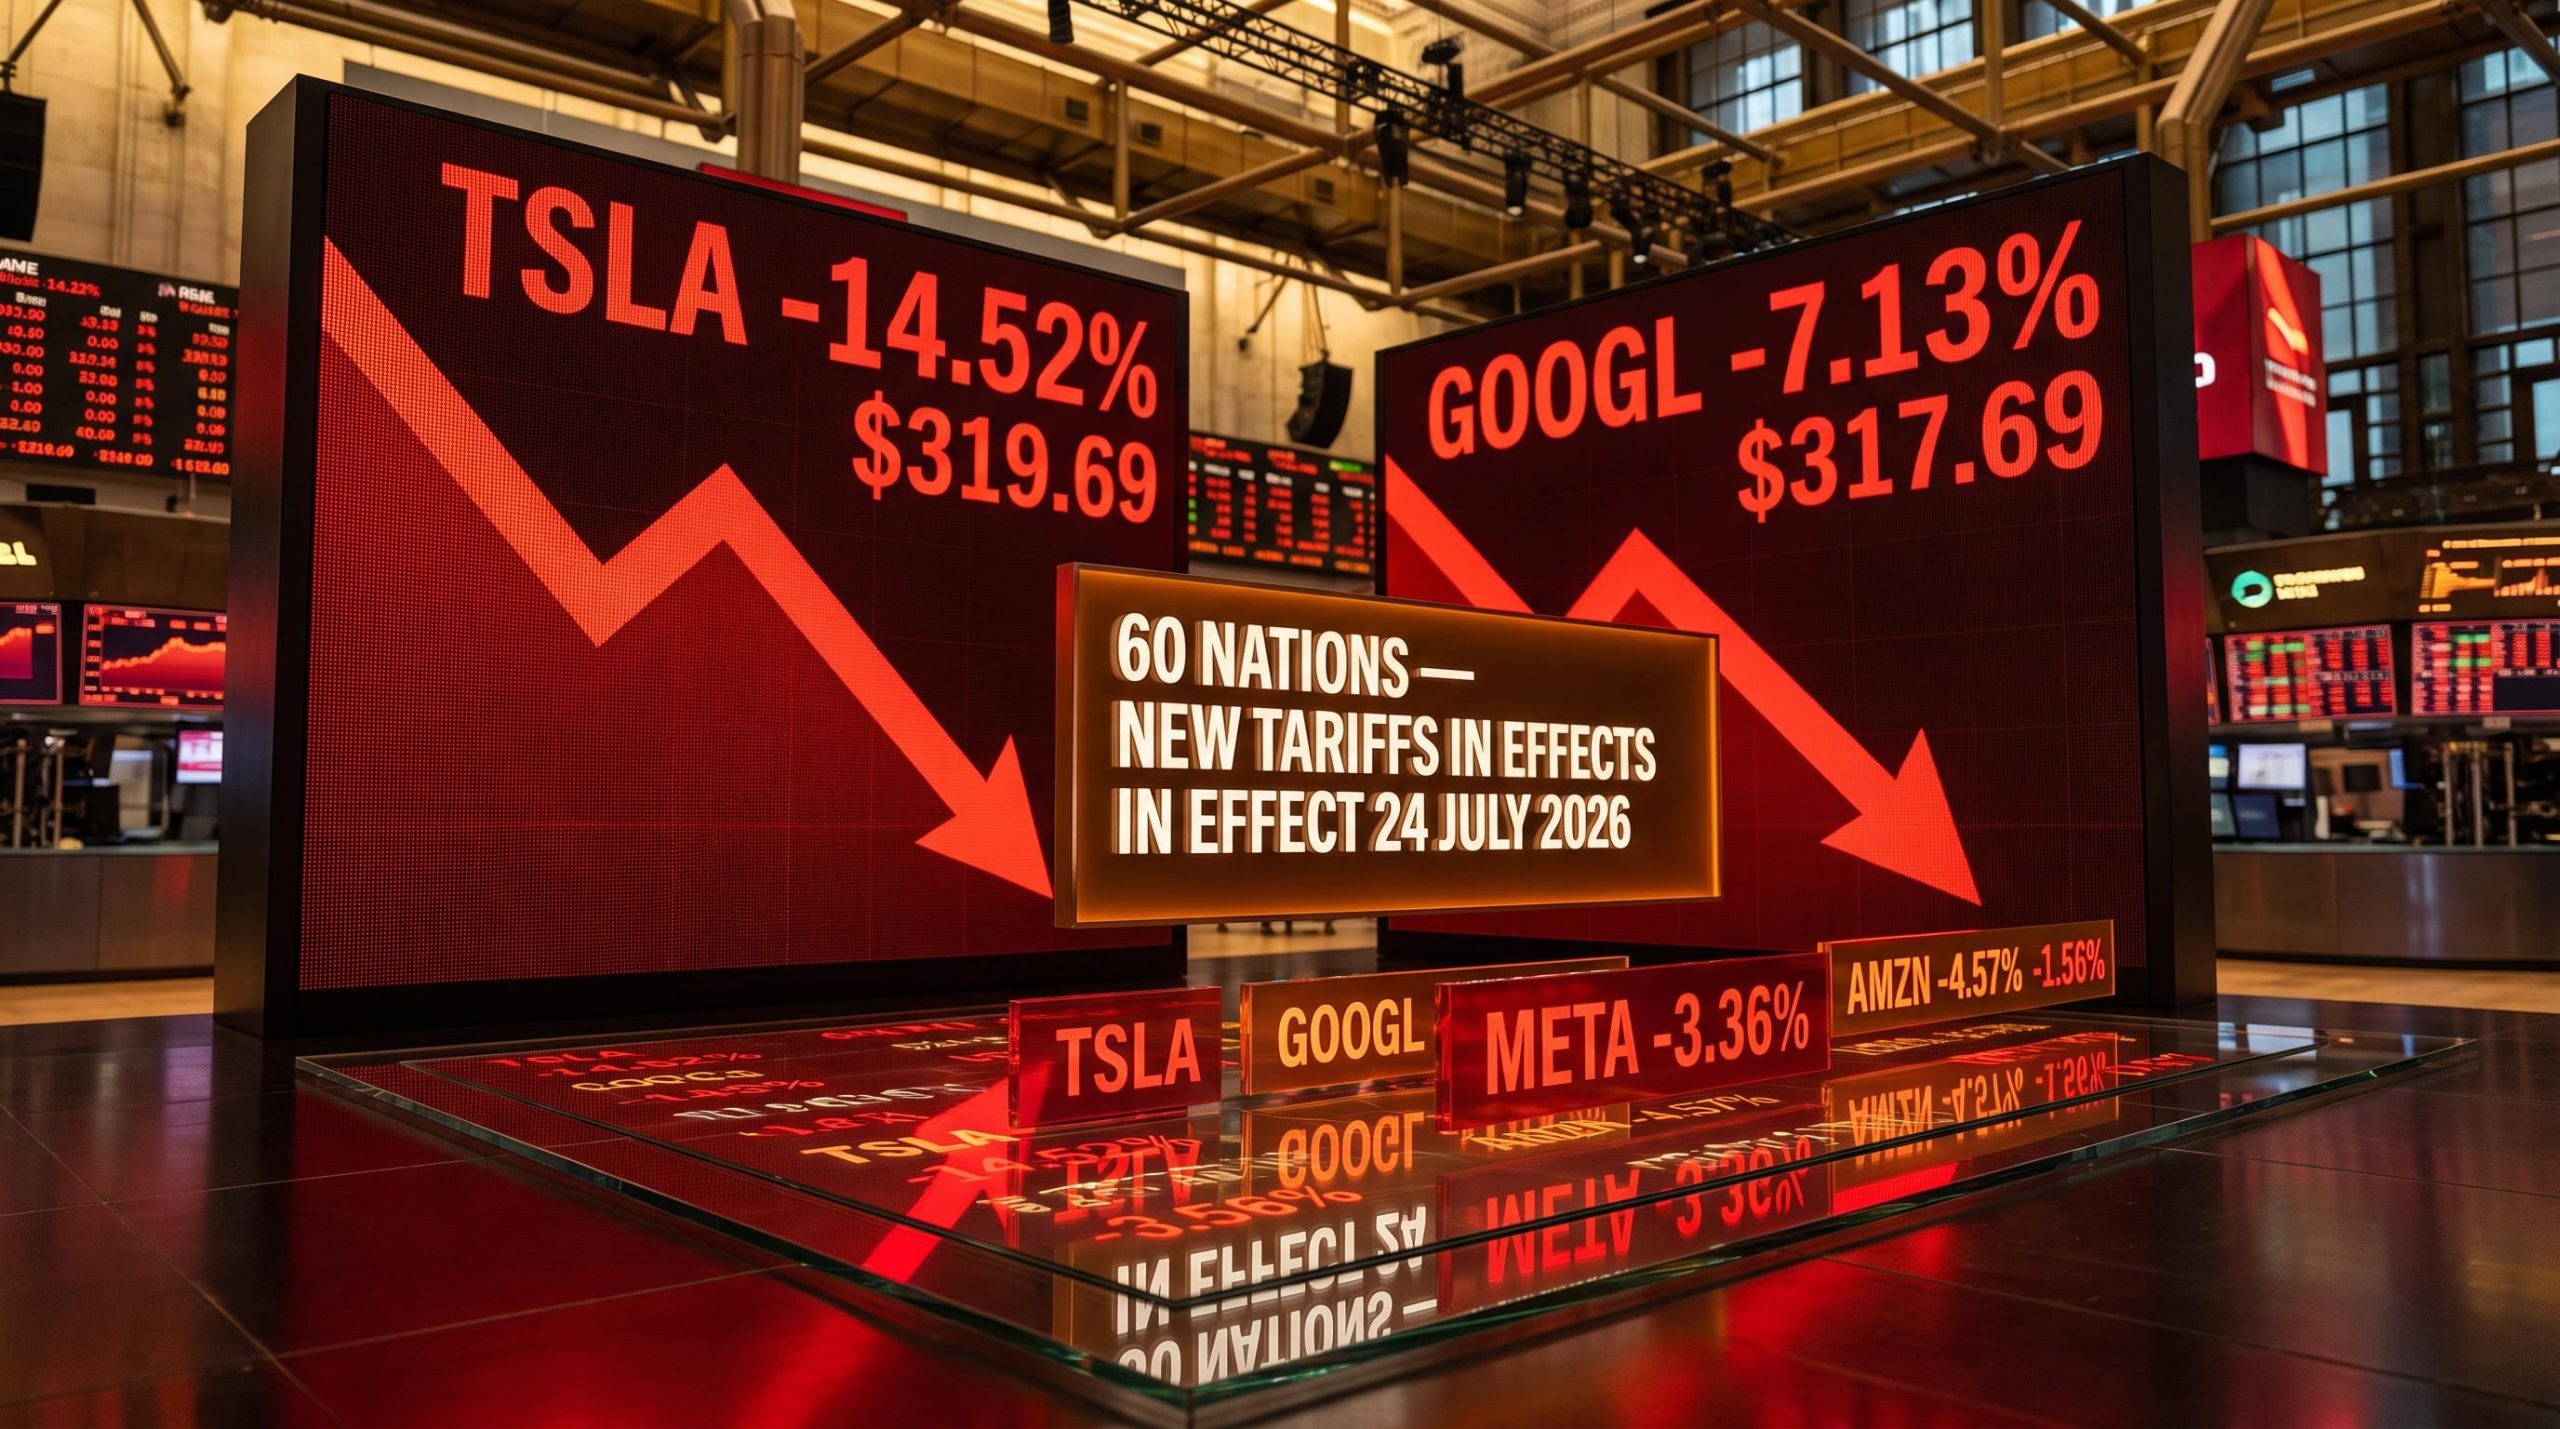
New tariffs covering 60 countries took effect on Friday 24 July 2026, the same morning investors woke up to a technology earnings season that had cracked open overnight. Two forces, one political and one fundamental, landed on the same trading day, and both carry direct implications for how U.S. equities get priced from here.
The coincidence matters. Trade policy just reinstated a risk premium many investors assumed the Supreme Court had capped earlier this year. Technology earnings just revealed that “AI” is not one trade; it is at least two, and they are moving in opposite directions. Together, these forces are rewriting the rules for equity exposure this week and likely beyond.
Here is what you need after reading this: which sectors and subsectors carry the heaviest exposure to each force, what specific signals to monitor next, and how tariffs and fractured tech earnings interact at the portfolio level to create a compound problem larger than either headline alone.
Why Trump reached for a 1974 trade law to build a new tariff wall
The Supreme Court invalidated President Trump’s emergency economic powers in February 2026, shutting down the broadest tool the administration had used to impose duties unilaterally. That ruling did not end tariff ambitions. It redirected them.
The instrument the administration chose instead is Section 301 of the Trade Act of 1974, a law under which the executive branch can levy duties on countries whose trade practices are judged to be “unjustifiable” or “discriminatory.” The stated justification here is that 60 economies have failed to adequately crack down on imports of goods made using forced labour. Reports suggest that further tariff action targeting manufacturing-sector practices is being prepared for announcement in the weeks ahead.
For investors, the legal mechanism matters as much as the rates themselves. A tariff grounded in a 50-year-old statute with a defensible evidentiary rationale is structurally harder to challenge in court than one resting on emergency powers the Supreme Court has already rejected. That means this risk is more likely to be a persistent feature of equity pricing than a temporary headline.
The legal durability of Section 301 becomes clearer when set against the February 2026 Supreme Court decision, and court rulings on tariff authority through May 2026 showed equity markets repricing trade risk from a binary executive shock model to a slower, more persistent legislative one.
Tariff rates, coverage, and what is exempt
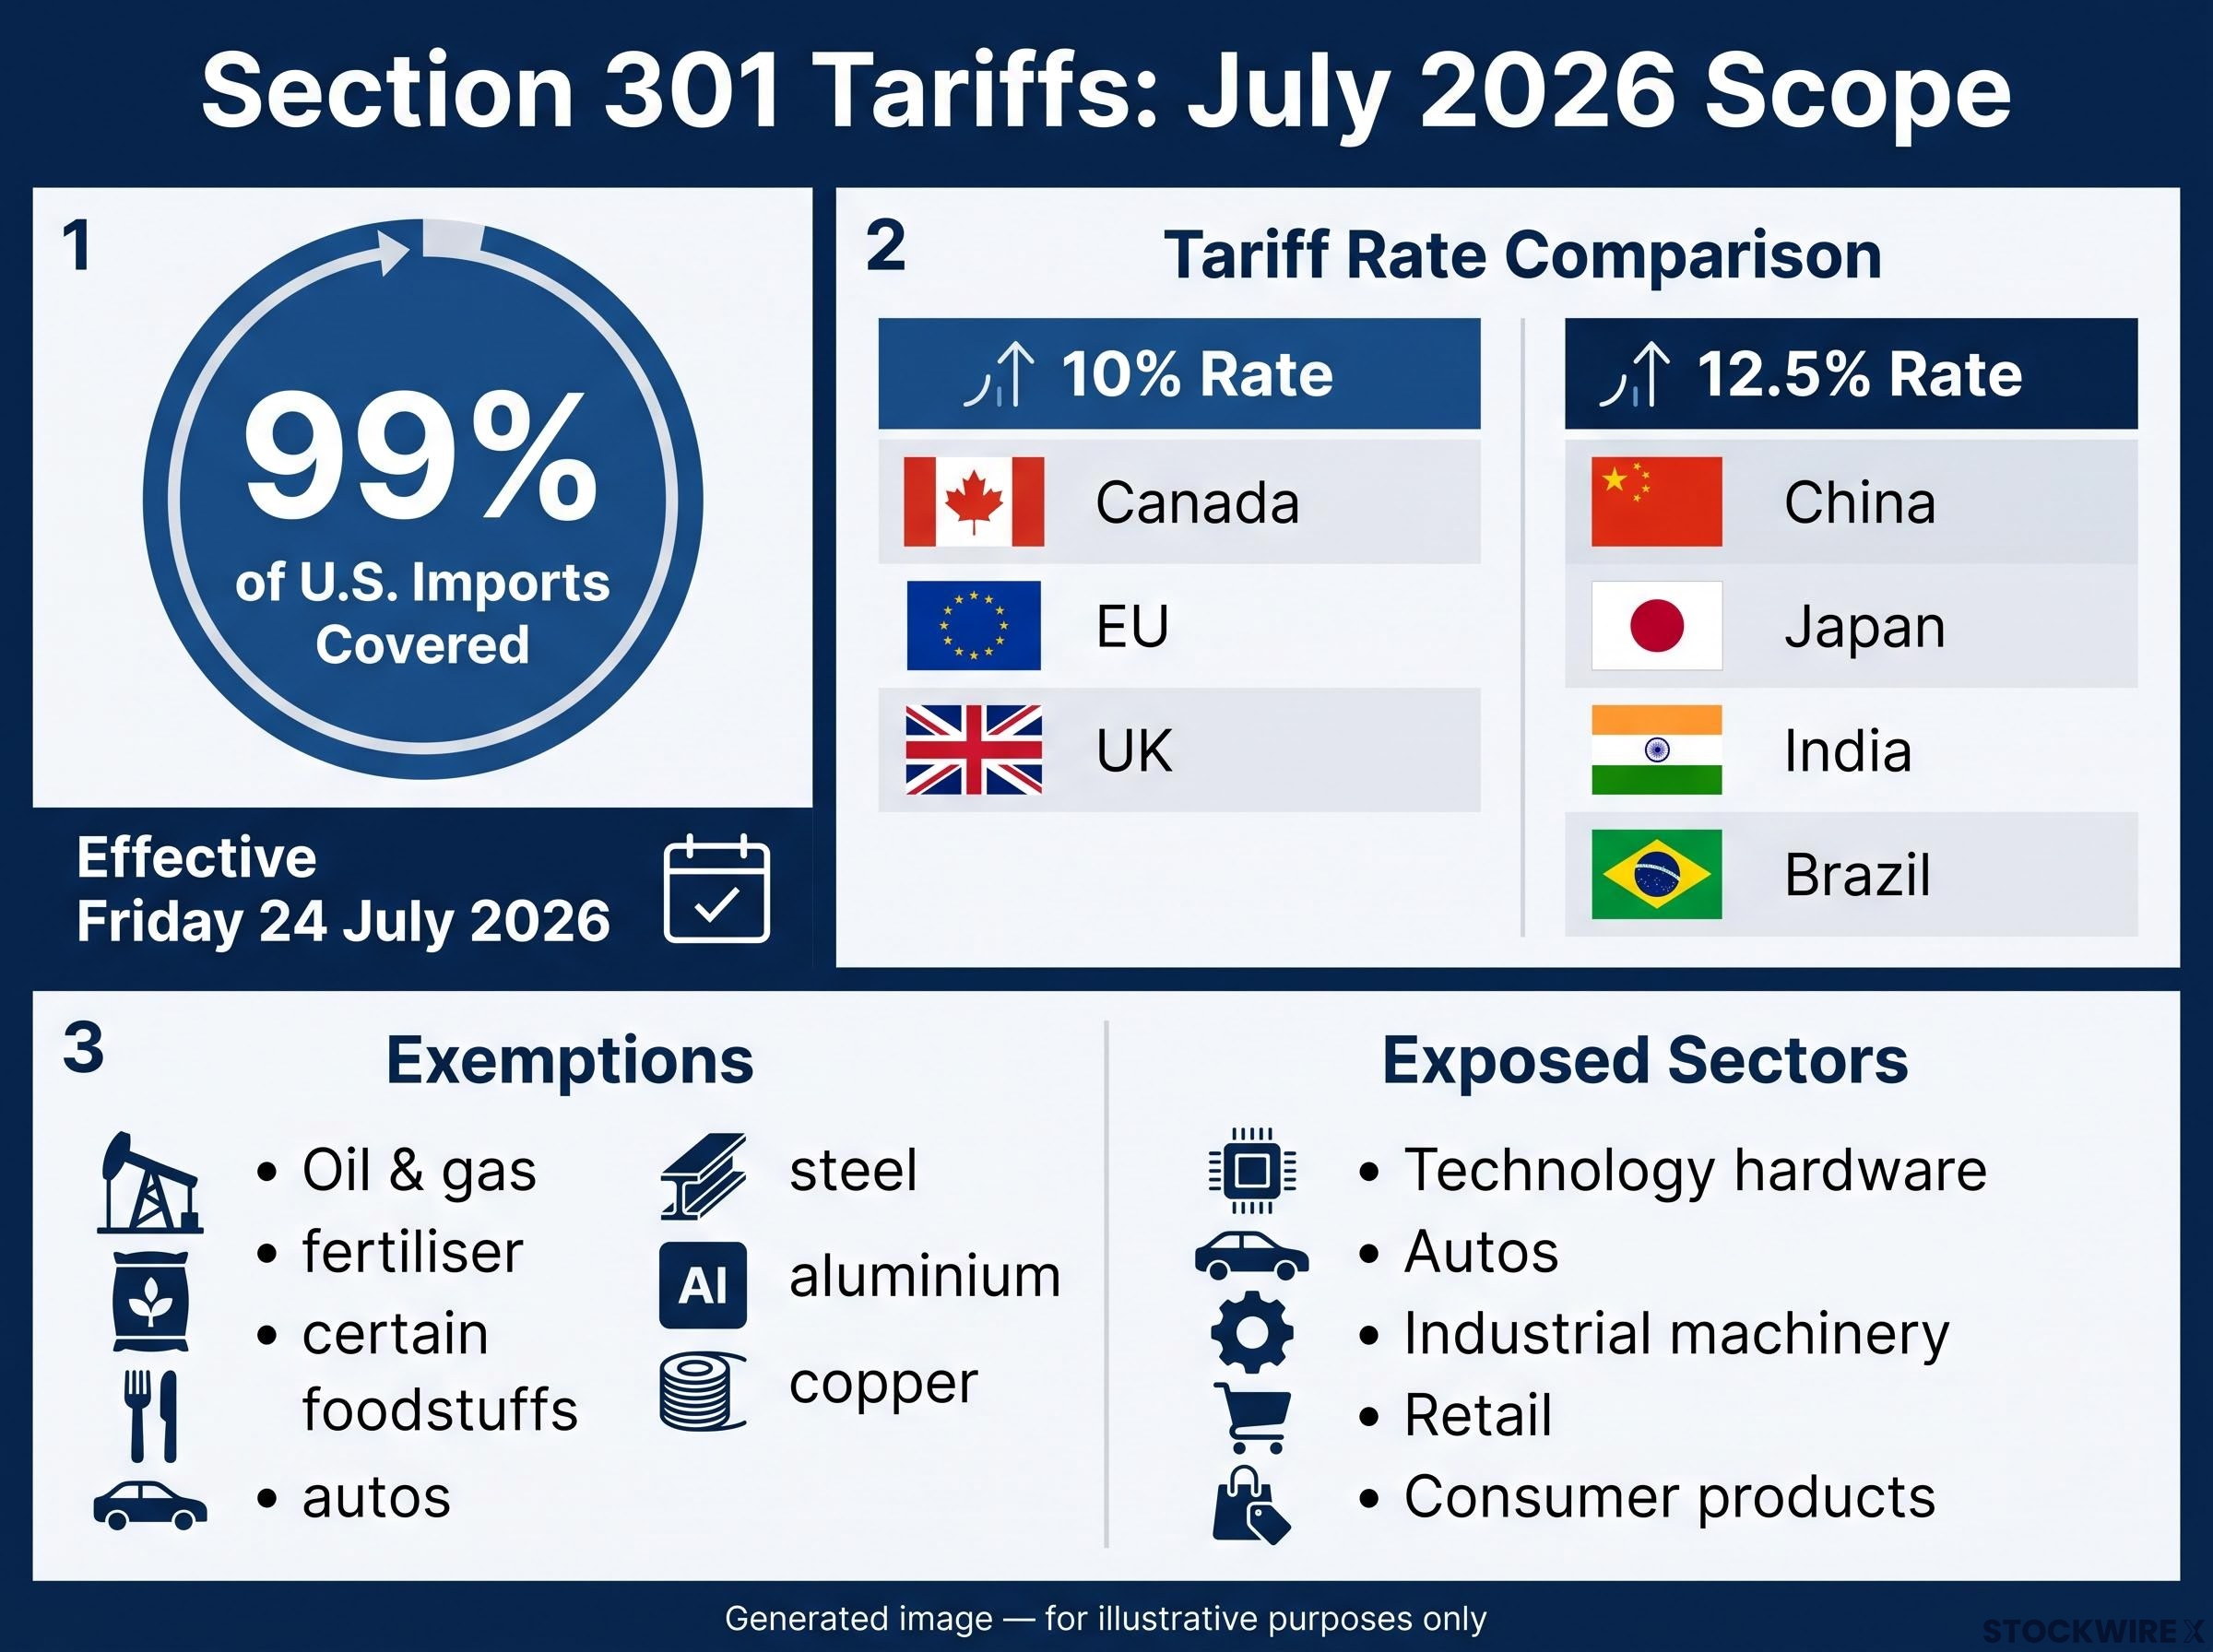
The rate structure splits into two tiers based on whether a country has formal forced-labour prohibitions in place.
| Country / Region | Tariff Rate |
|---|---|
| Canada, EU, UK | 10% |
| China, Japan, India, Brazil | 12.5% |
Coverage is extraordinarily broad, spanning approximately 99% of U.S. imports. The exemptions are narrow: oil and gas, fertiliser, certain foodstuffs, and goods already subject to national-security tariffs covering autos, steel, aluminium, and copper.
When big ASX news breaks, our subscribers know first
What these tariffs actually do to corporate margins and sector exposure
The new duties work through three layers, and each one compounds the last.
First, they raise input costs for any company sourcing materials, components, or finished goods from the 60 targeted nations. Those companies face a binary choice: absorb the cost and compress margins, or pass it through and risk softening demand.
Second, they reinstall a trade-policy risk premium on equity valuations. The administration has already signalled further Section 301 actions, and trading partners including Canada, the EU, China, Japan, and Mexico are weighing retaliatory responses. That uncertainty is not a one-day event; it stays in the price.
Third, they shift relative attractiveness toward domestically oriented businesses with limited import dependence.
The sectors carrying the heaviest direct exposure include:
- Technology hardware
- Autos
- Industrial machinery
- Retail
- Consumer products
The inclusion of deeply integrated partners like Canada and the EU is what makes this action unusually broad. The impact is not confined to niche sourcing categories.
The global trade realignment already underway before this week’s Section 301 action includes three major trade agreements ratified without US participation, with international ETFs absorbing $26.3 billion in net inflows through April 2026 as capital repositioned away from US large-cap equities.
On Thursday 23 July, the equal-weighted S&P 500 proved relatively resilient, buoyed by stronger results from companies outside the technology sector. That gap versus the cap-weighted index is an early signal: domestic-oriented names are already acting as a relative safe harbour.
For a U.S. equity investor, the combination of active retaliation risk and signalled further Section 301 actions means the tariff risk premium stays elevated for globally sourced sectors through at least the next earnings cycle. This is not a single shock to price in and move on.
Inside the tech earnings split: what Alphabet and Tesla actually revealed
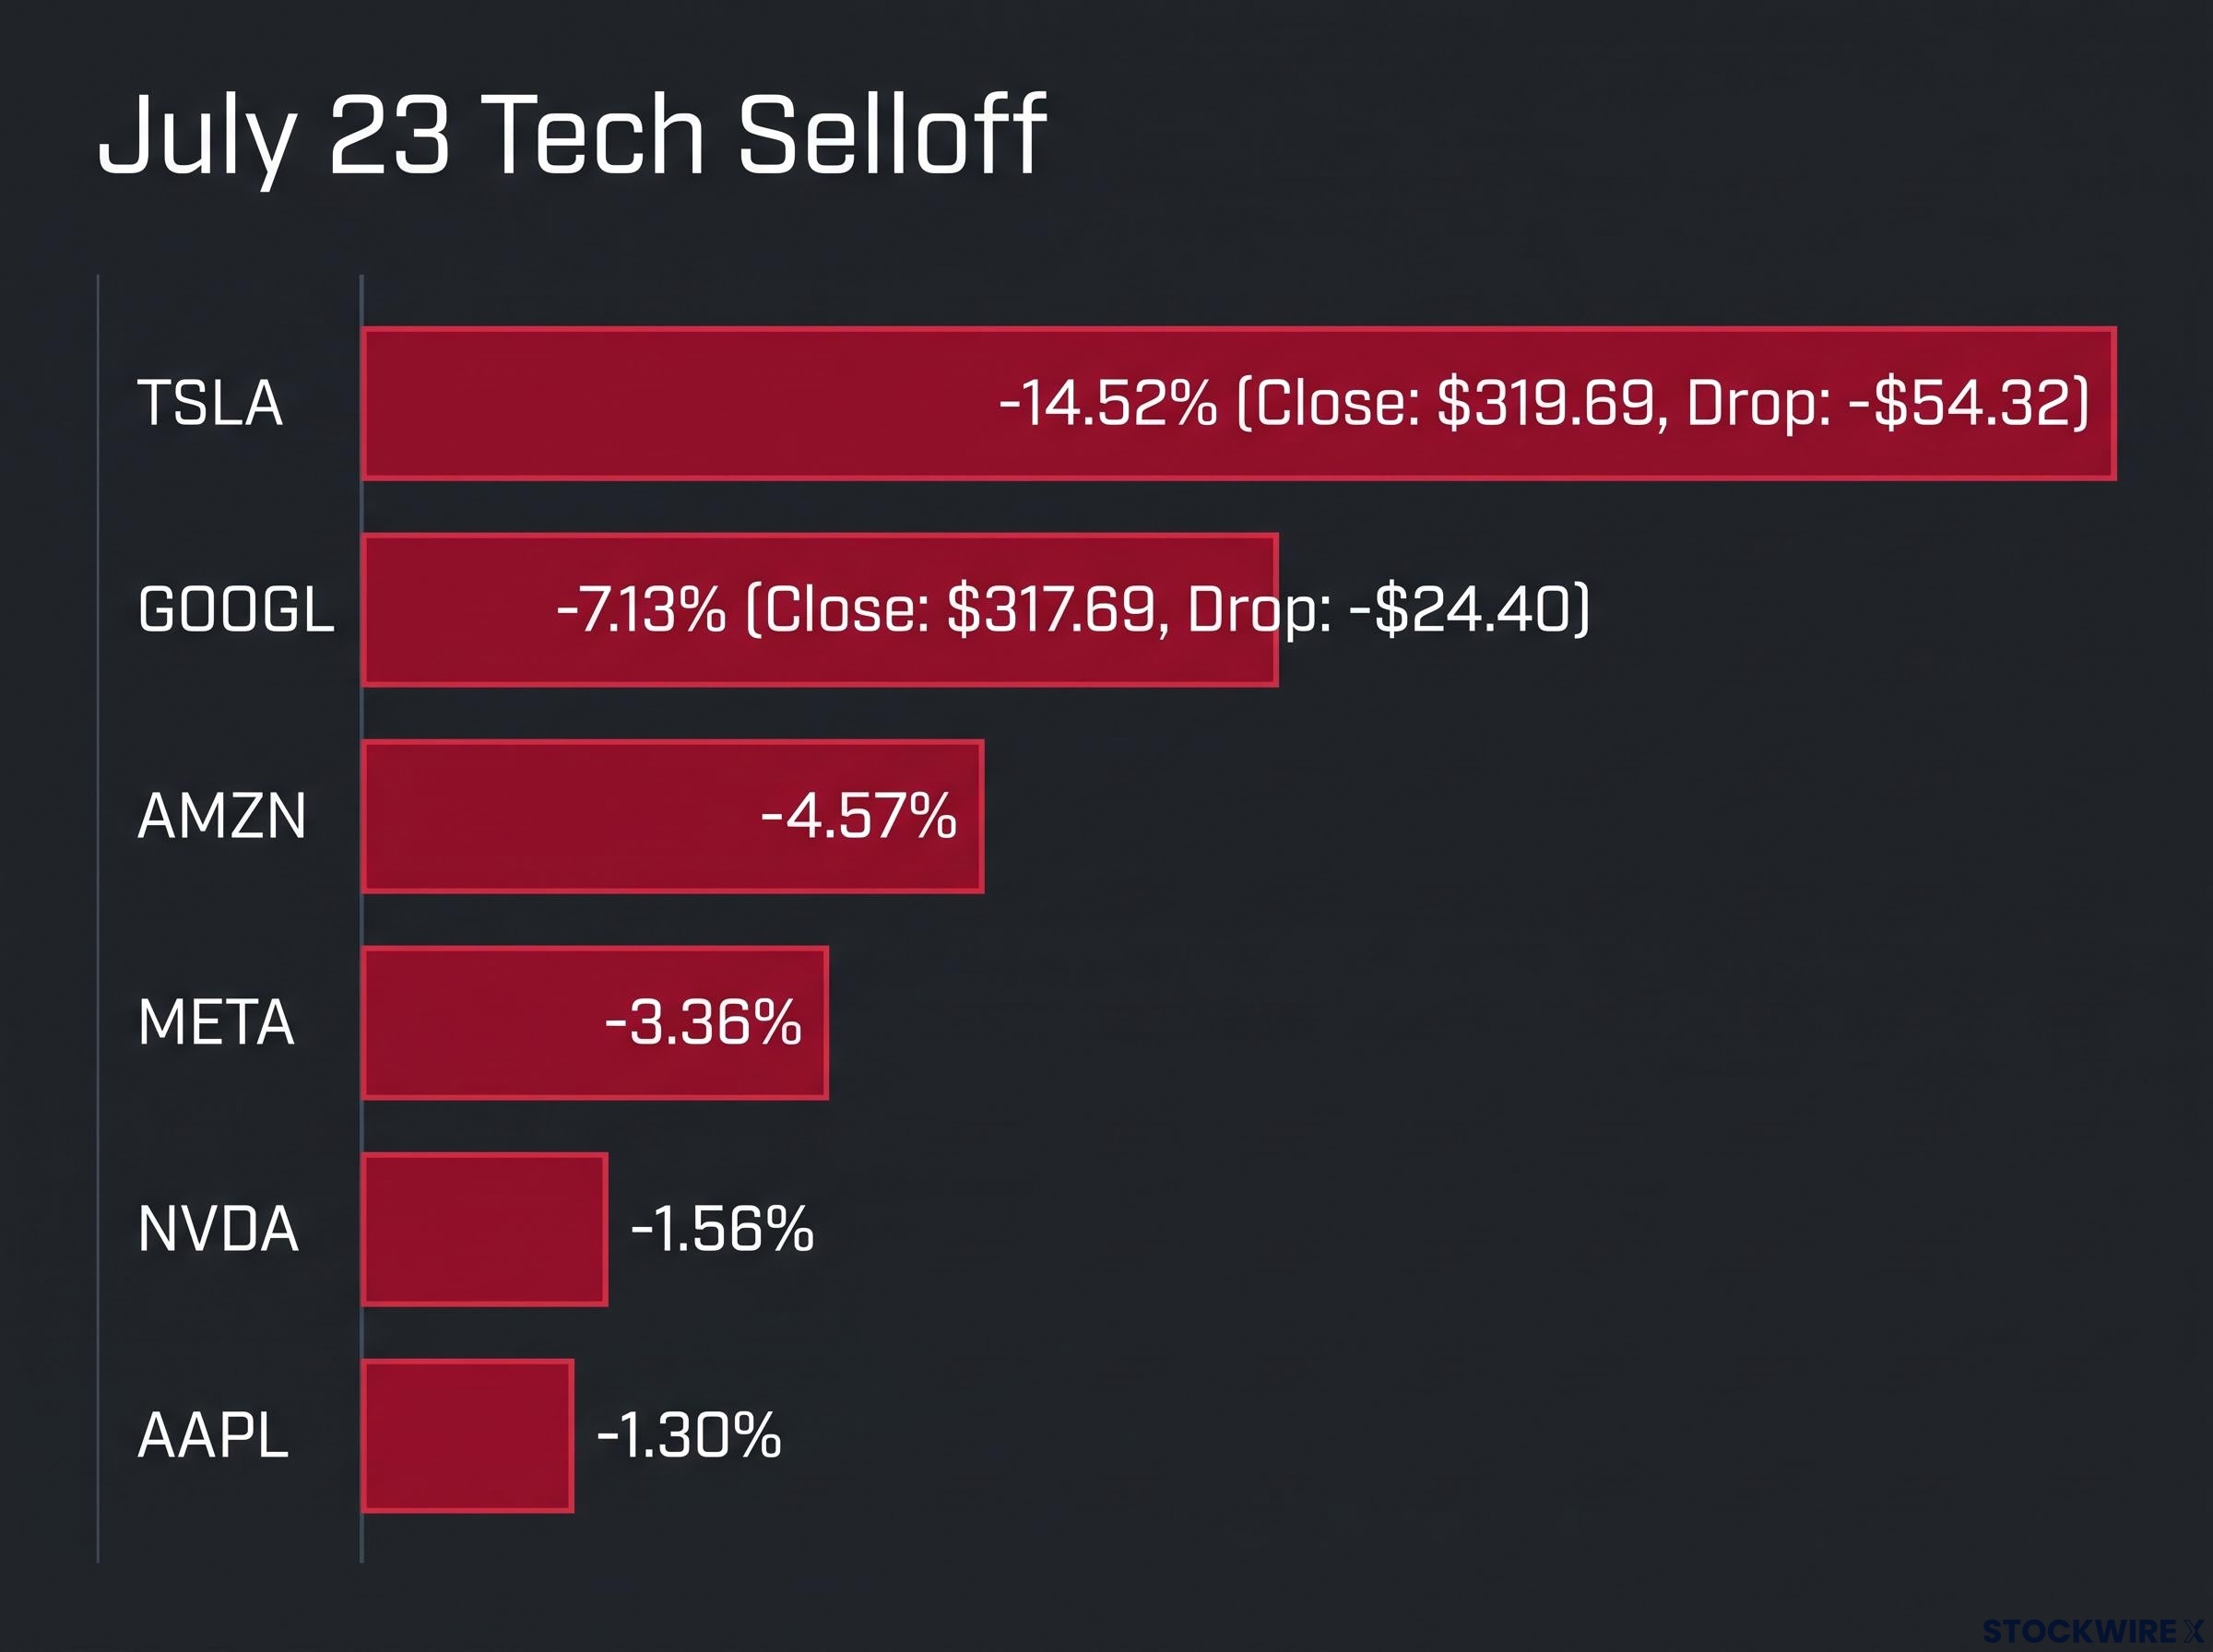
Tesla dropped $54.32 (14.52%) to $319.69 on Thursday 23 July, making it the session’s largest percentage decliner. 115.61 million shares changed hands, the most actively traded stock of the day. Alphabet fell $24.40 (7.13%) to $317.69 on volume of 69.42 million shares. Both companies reported earnings after the close on 22 July 2026.
Tesla’s 14.52% single-session decline on the heaviest trading volume of the day made it the defining data point of Thursday’s selloff.
Alphabet’s decline reflects investor anxiety about whether heavy AI data-centre and model investment spending can be monetised efficiently enough to justify current valuation multiples. The concern is specific: capital is flowing into AI infrastructure at an accelerating pace, but the incremental revenue it generates remains uncertain.
Tesla’s drop is a compound story. Cyclical EV competition and pricing pressure layered on top of investor scepticism about the timeline and profitability of its AI-adjacent bets in robotics and autonomous driving. Neither concern is new; both got sharper with the results.
The damage spread well beyond the two companies that reported.
| Company | Ticker | Price Change ($) | % Change | Closing Price |
|---|---|---|---|---|
| Alphabet | GOOGL | -$24.40 | -7.13% | $317.69 |
| Tesla | TSLA | -$54.32 | -14.52% | $319.69 |
| Meta Platforms | META | -$21.07 | -3.36% | $606.10 |
| Amazon | AMZN | -$11.19 | -4.57% | $233.66 |
| NVIDIA | NVDA | -$3.30 | -1.56% | $208.76 |
| Apple | AAPL | -$4.23 | -1.30% | $321.66 |
The pattern across these moves tells you the market is now applying a penalty to companies where AI spending is large and visible but the incremental revenue it generates is either uncertain or longer-dated. That is a direct challenge to valuations built on AI growth narratives.
Intel’s quarter and what AI enablers reveal about the real earnings opportunity
Intel (INTC) advanced more than 5% in premarket trading on Friday 24 July, following a Q2 earnings beat reported after the close on 23 July. 140.81 million shares changed hands, placing it among the most actively traded stocks. The sector did not have a bad earnings week. It had a revealing one.
Intel’s results illustrate a structural distinction that now has earnings-validated evidence behind it. Demand for Intel processors deployed in next-generation AI agent applications, specific enterprise use cases with near-term revenue visibility, was cited as a partial driver of the beat. That is a fundamentally different monetisation story from the one Alphabet told.
The AI earnings split that matters: AI enablers, semiconductor makers and select infrastructure suppliers with direct revenue tied to concrete AI workloads, are showing more straightforward near-term earnings leverage. AI platform builders, the hyperscalers spending heavily on data centres and model training, face tougher scrutiny on capital intensity and return on invested capital.
The two categories in contrast:
- AI enablers: Near-term chip and infrastructure revenue tied to enterprises actively deploying AI workloads today
- AI platform builders: Heavy capital expenditure with longer-dated return-on-investment timelines and heavier investor scrutiny on monetisation
For investors, Intel’s quarter suggests the clearest near-term AI earnings opportunity sits in the value-chain segment closest to end-demand: companies selling the picks and shovels to enterprises deploying AI workloads now, rather than building the infrastructure for workloads that may scale years from now.
How tariffs and tech earnings are pressing on the same pressure point
Mega-cap technology companies are now absorbing two distinct pressures simultaneously: AI monetisation scrutiny from the earnings side and new tariff-driven input cost friction from the trade side. Rich valuation multiples are harder to defend when both the revenue outlook and the cost base are under question at the same time.
The intersection is specific. Leading tech and semiconductor firms rely on complex cross-border supply chains for chips, components, and hardware assembly, exactly the import channels now subject to new duties across 60 nations. On 23 July, the equal-weighted S&P 500 held its ground while the cap-weighted index, where global mega-caps carry outsized influence, lagged behind. That gap offers an early read on how these twin pressures are sorting the market between domestically oriented names and internationally exposed ones.
Semiconductor supply chain vulnerability sits at the intersection of both forces bearing on tech valuations this week: TSMC produces approximately 90% of the world’s leading-edge chips below the 5nm node, meaning tariff-related disruptions to cross-border flows compound an existing structural concentration risk that most large-cap technology portfolios carry.
The dual risk vectors now applying to mega-cap tech:
- AI capital intensity with uncertain near-term return on investment
- New tariff-driven input cost friction across cross-border supply chains
If you hold broad large-cap technology exposure, you are carrying both risk factors, and they compound each other. If AI spending does not monetise on schedule, there is no revenue cushion to absorb the new tariff-related cost friction.
Where relative shelter may exist in this environment
Three pockets of relative advantage emerge from this week’s evidence. Domestically oriented businesses with limited import dependence and clearer pricing power face less tariff friction. AI value-chain companies where revenue translation to end-demand is already visible and reported, select semiconductor and software names, carry a more defensible earnings story. Cloud and platform players, by contrast, face simultaneous cost friction and revenue uncertainty.
What comes next and what investors should watch closely
The tariff story and the tech earnings story both have specific next chapters, and the signals worth monitoring are concrete.
- Official retaliatory responses from Canada, the EU, China, Japan, and Mexico, particularly any indication of counter-tariffs or WTO challenges
- USTR announcements on further Section 301 actions in the manufacturing sector, where additional duties are reported to be in preparation for release in the near term
- Upcoming hyperscaler and cloud provider earnings patterns: if more firms report heavy AI capex alongside muted incremental revenue, the Alphabet pattern becomes a sector-wide repricing event
- Sustained relative performance of AI enablers versus AI platform builders as the earnings season continues
The most important signal to watch is whether the next wave of tech earnings reproduces the Alphabet pattern. If multiple hyperscalers report heavy AI capex alongside modest incremental revenue, the derating of AI platform valuations moves from company-specific to sector-wide.
The portfolio-level takeaway is a shift from broad sector exposure toward company-specific fundamentals. Which firms have visible AI revenue? Which have limited tariff exposure? Which face both headwinds simultaneously? Those questions now separate the positioning opportunities from the traps.
For investors wanting to act on the AI enabler versus AI platform builder distinction that this week’s earnings revealed, our dedicated guide to AI ETF portfolio construction covers a four-layer allocation framework across the full AI value chain, with specific sizing logic for each tier.
This article is for informational purposes only and should not be considered financial advice. Investors should conduct their own research and consult with financial professionals before making investment decisions.
These statements are speculative and subject to change based on market developments and company performance.
A market that now rewards specificity over broad exposure
The week’s events are pushing equity markets away from blanket exposure to “U.S. stocks” or “AI” as unified trades and toward fundamental, company-level differentiation. The combination of a new trade-policy floor via Section 301 and a fractured tech earnings season is not a short-term volatility event. It is a reset of the criteria investors need to apply when assessing equity positions.
The variables that now separate winners from losers are specific: domestic revenue orientation, visible AI monetisation, and limited cross-border supply-chain exposure. Disciplined equity positioning in this environment means knowing which of those three boxes each holding ticks, and which it does not.
—