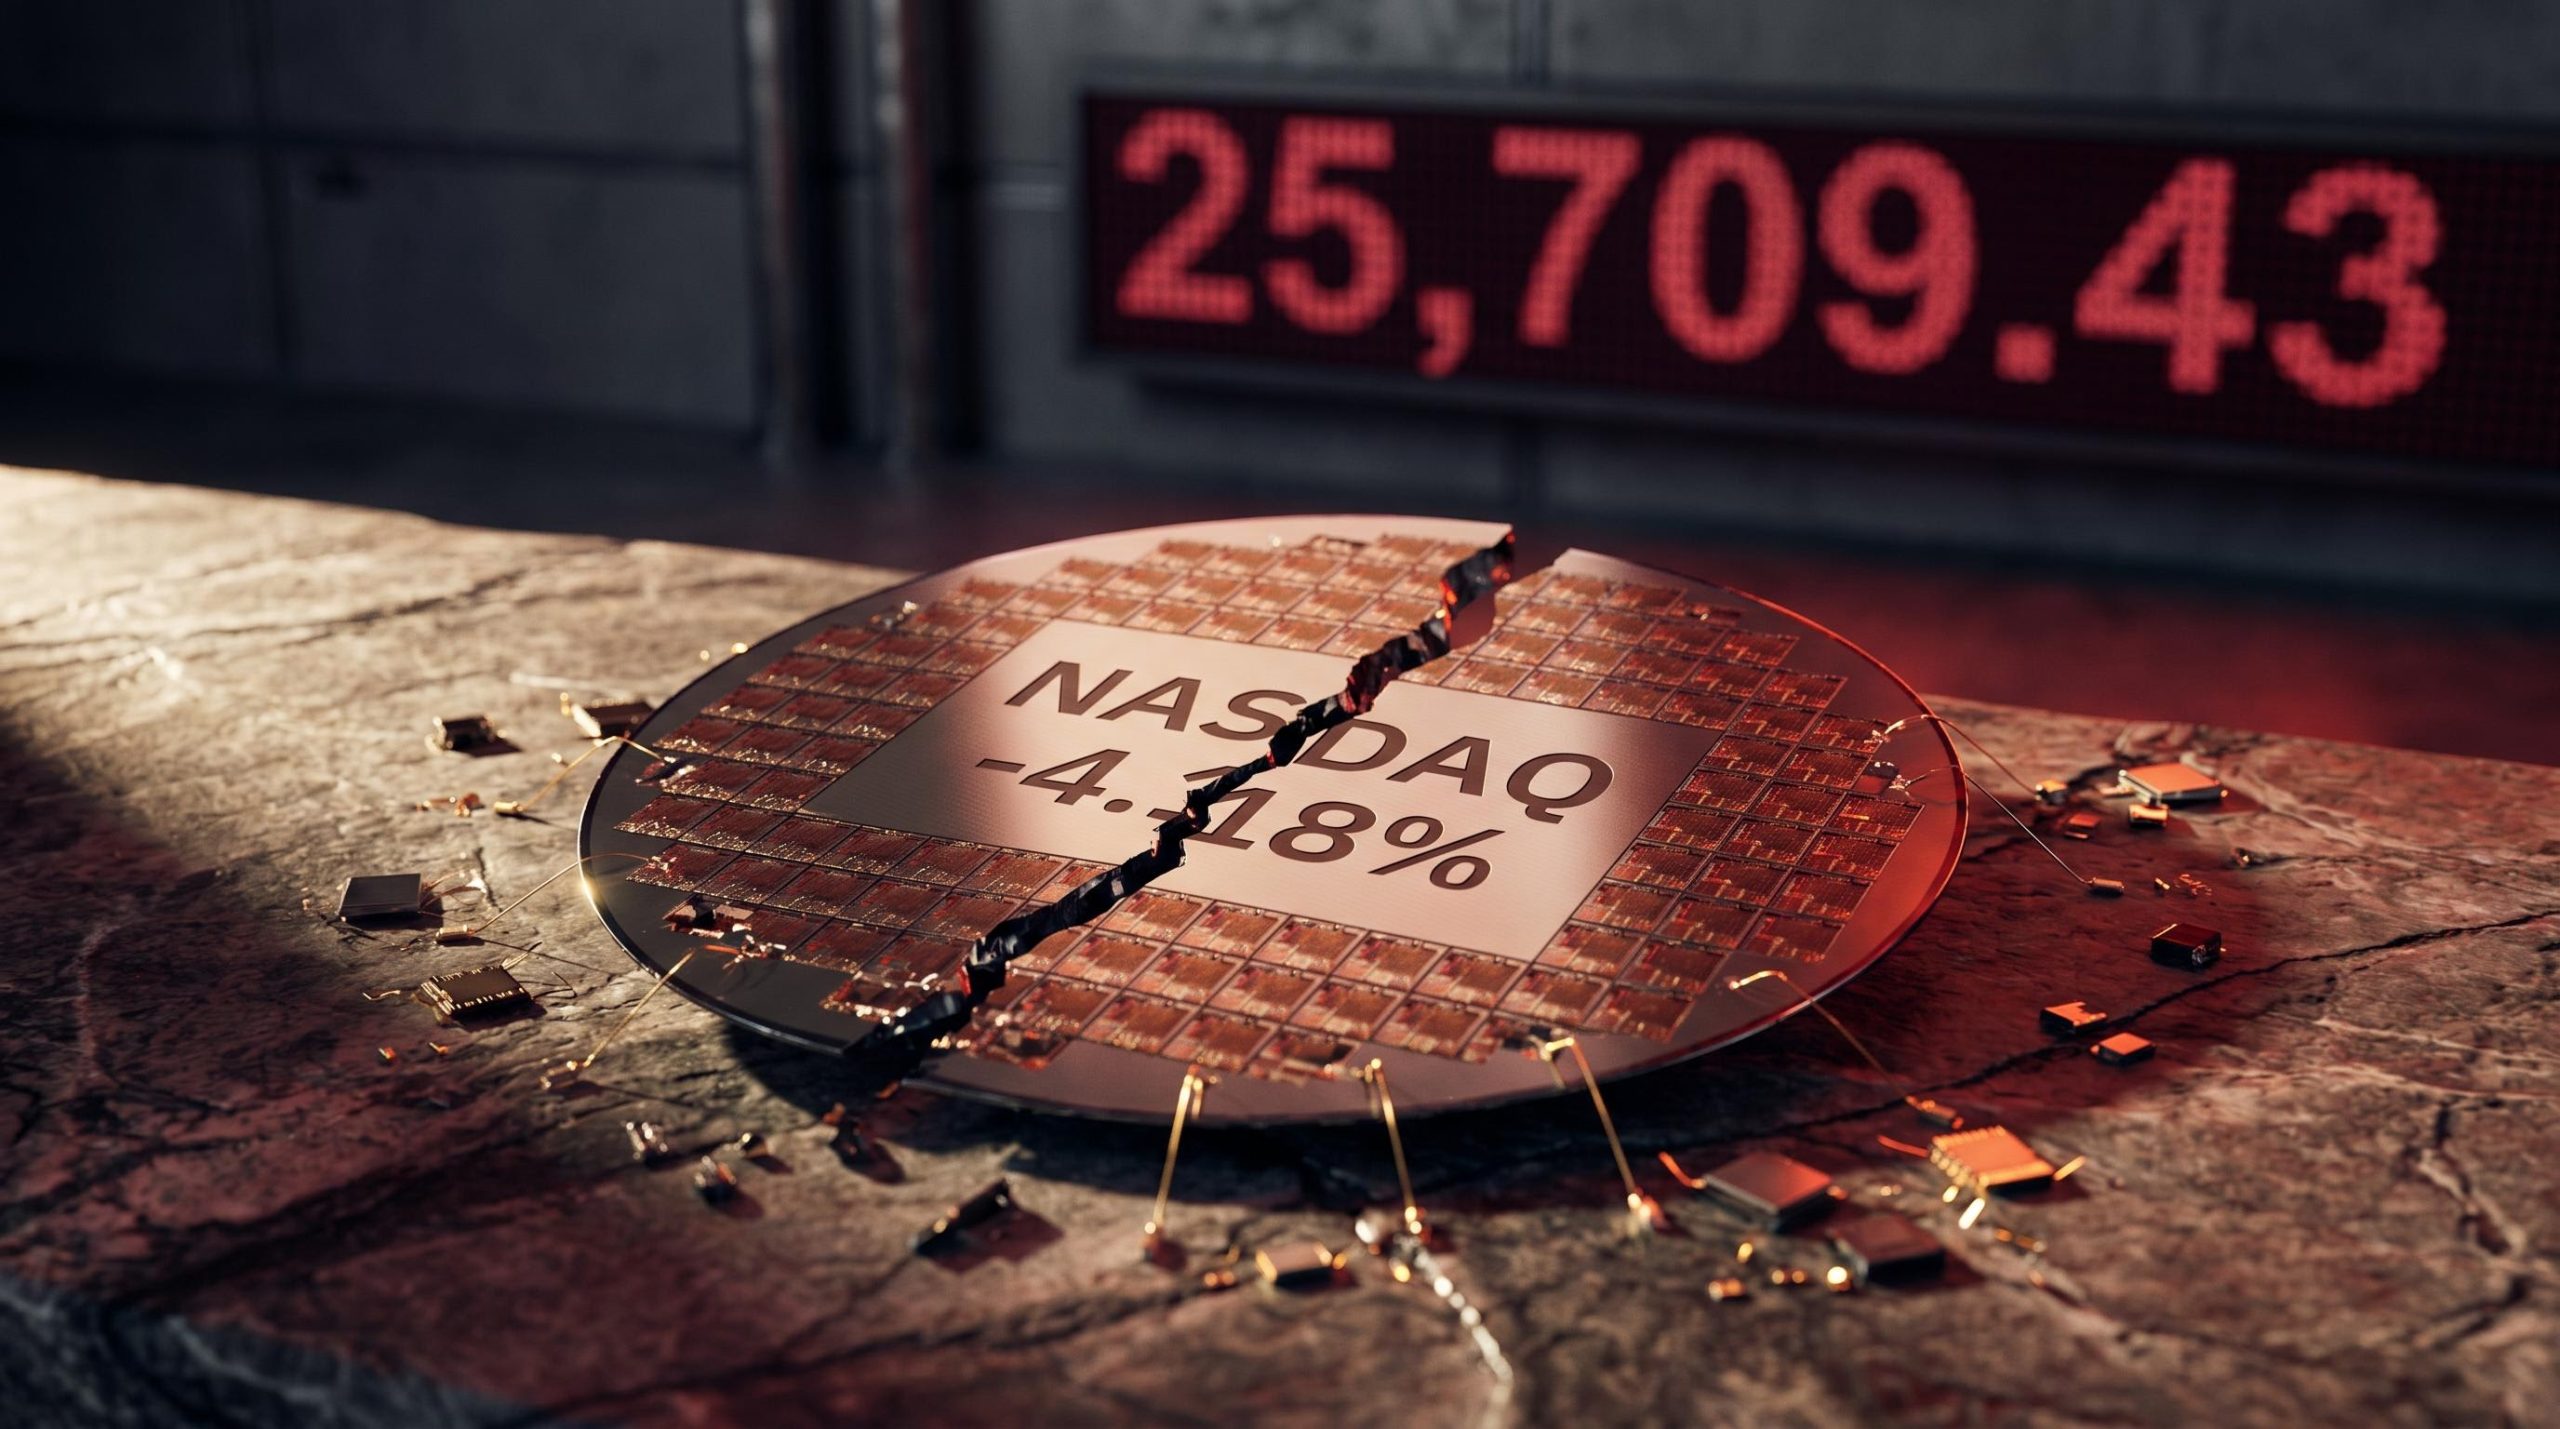
The Nasdaq Composite fell 4.18% on 5 June 2026, closing at 25,709.43 in its worst single session since April 2025. The sell-off snapped a nine-consecutive-weekly-gains streak that had occurred only roughly 14 times since 1930, turning what had been one of the most statistically unusual bull runs in nearly a century into a sharp, semiconductor-led rout. The trigger was specific: Broadcom’s quarterly AI chip guidance missed consensus by $1.2 billion, and a market that had priced in a frictionless artificial intelligence capex boom responded by repricing the entire sector in a single afternoon. What follows is an examination of where the damage was concentrated, why the market’s structure amplified it, what history says about rallies that run this hard, and whether analysts view this as a correction or something more consequential.
Nasdaq posts its worst day since April 2025 as semiconductor stocks collapse
The damage spread well beyond technology names, though the epicentre was unmistakable. Across the three major indices on 5 June:
- Nasdaq Composite: fell 4.18% to 25,709.43
- S&P 500: dropped 2.64% to 7,383.74, its worst day since October
- Dow Jones Industrial Average: declined 695.15 points (1.35%) to 50,866.78
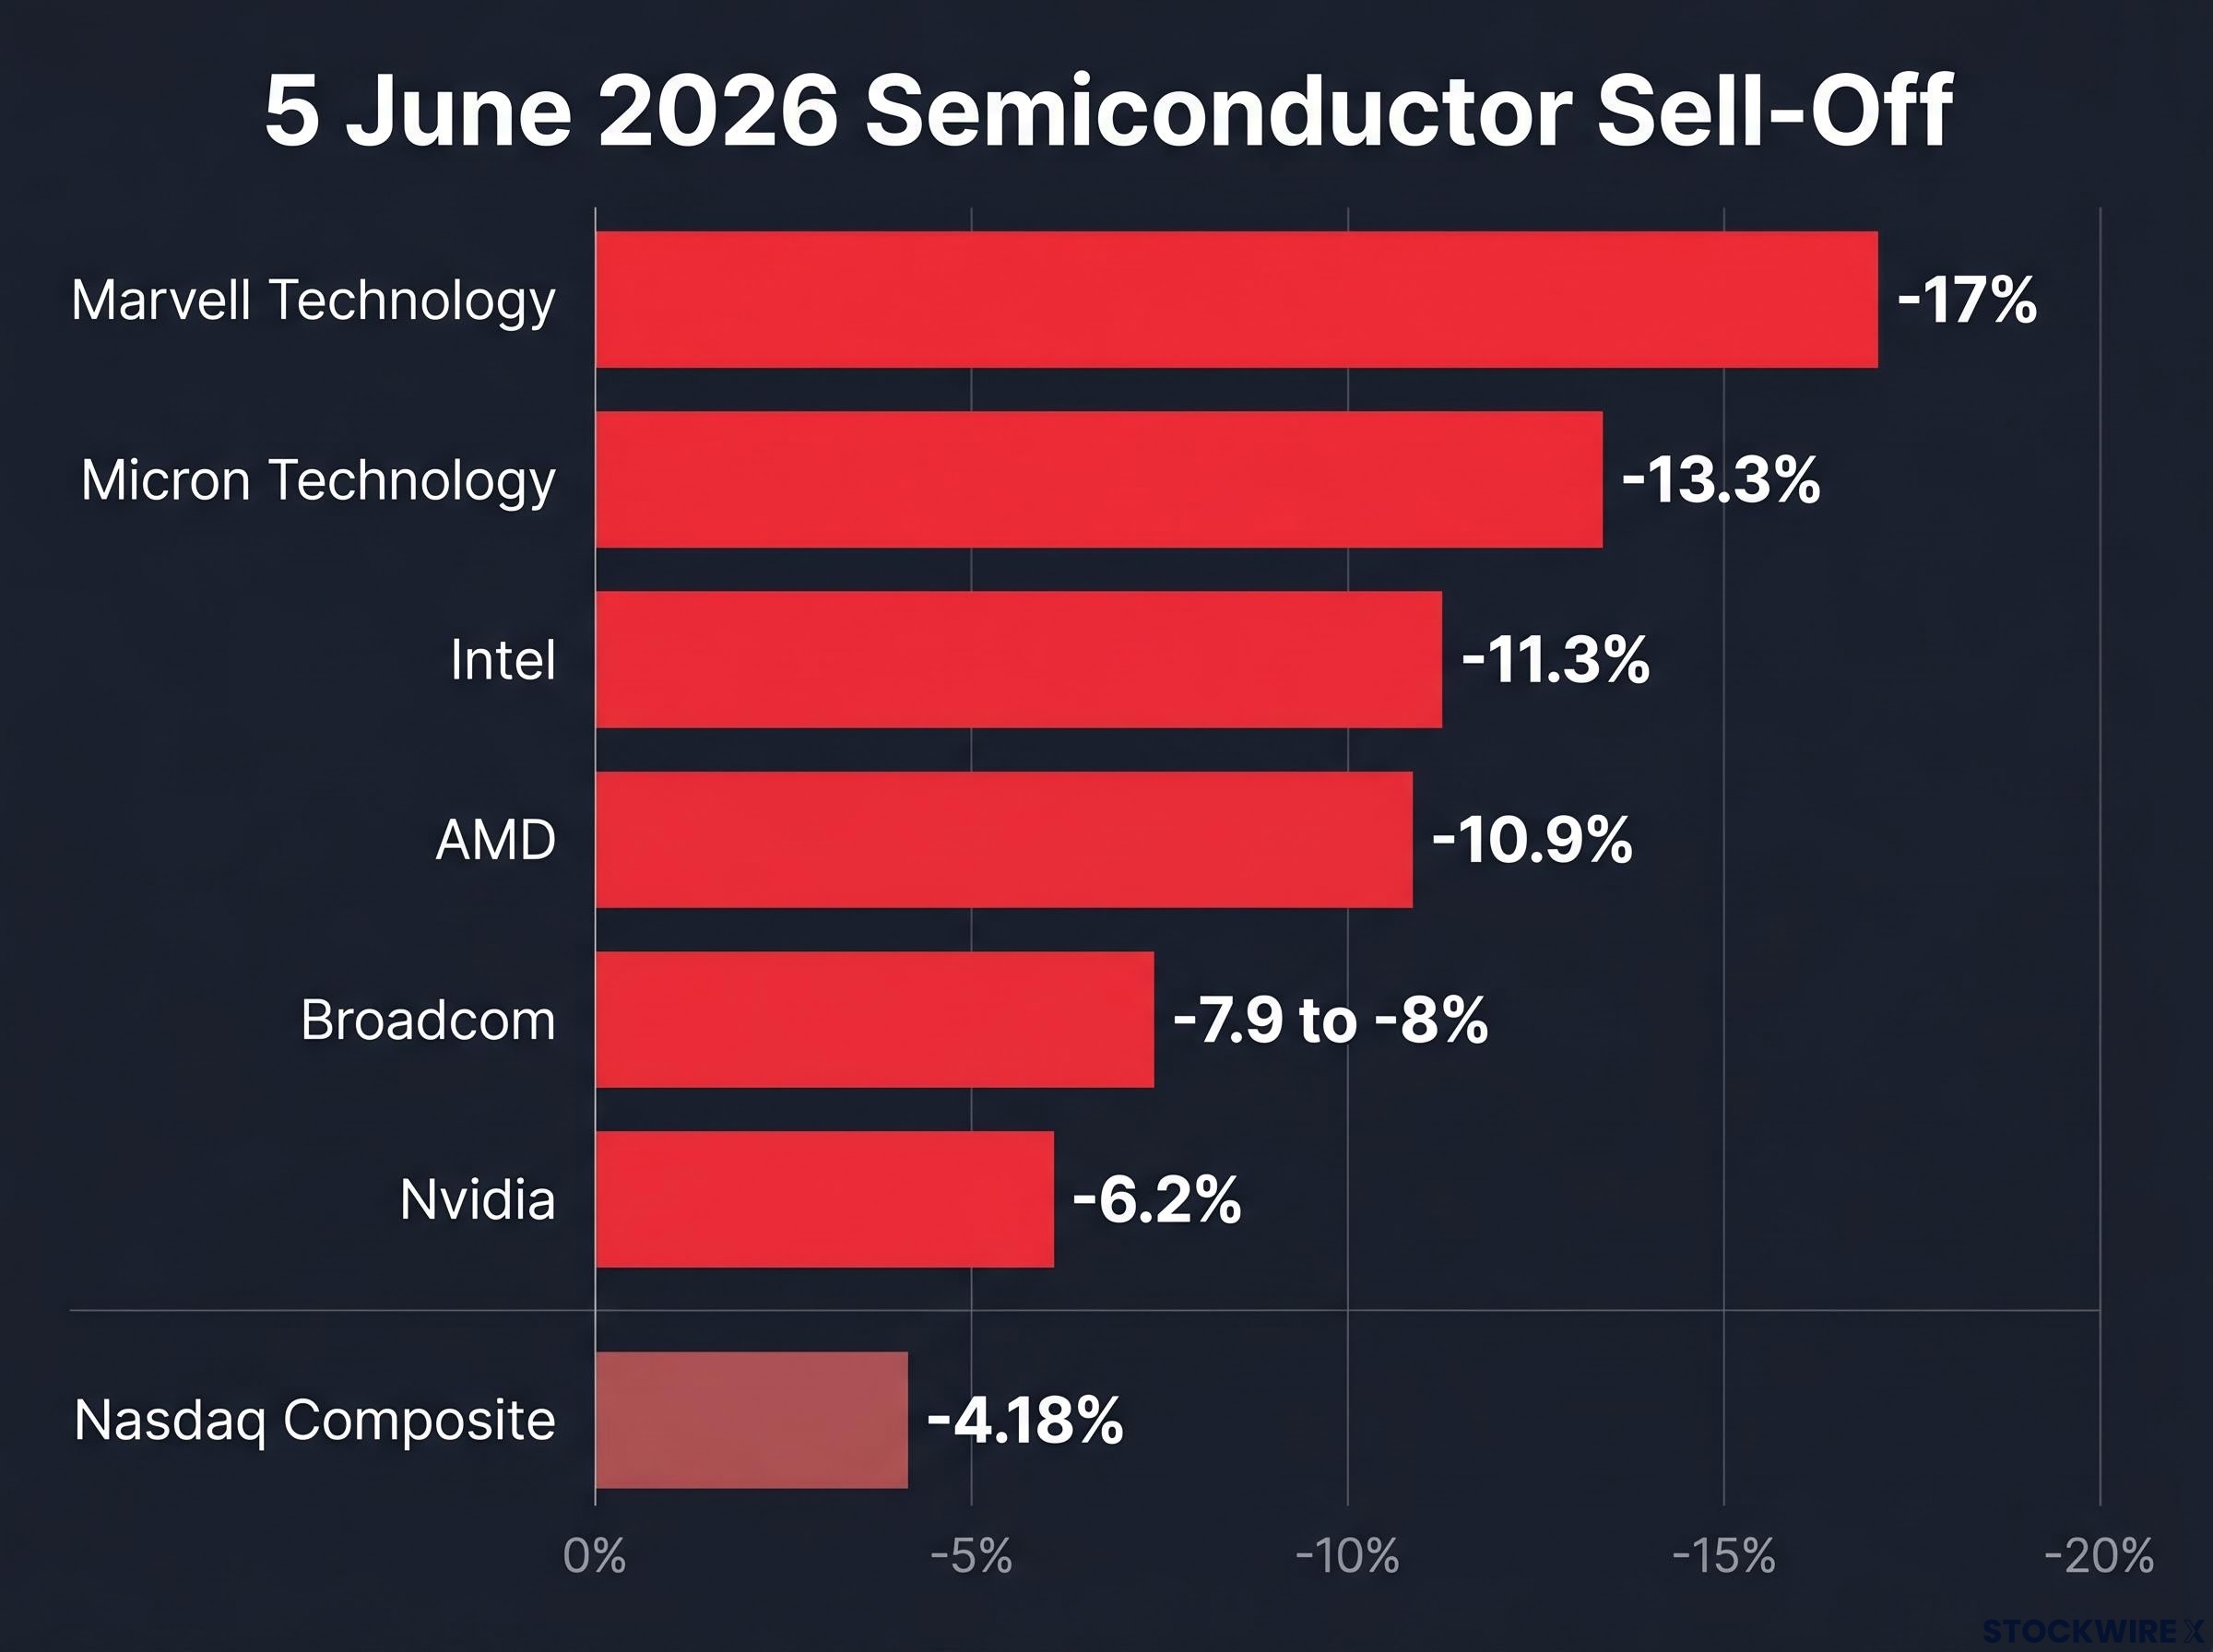
The headline figures understated the destruction in individual semiconductor and AI names. Portfolios with concentrated chip exposure absorbed losses several times the index-level moves.
| Stock | Decline (5 June 2026) |
|---|---|
| Marvell Technology | -17% |
| Micron Technology | -13.3% |
| Intel | -11.3% |
| AMD | -10.9% |
| Broadcom | -7.9 to -8% |
| Nvidia | -6.2% |
Marvell Technology led the losses at approximately -17%, nearly four times the Nasdaq’s index-level decline. The gap between headline index moves and individual stock carnage illustrates how much concentrated risk sat inside a narrow band of semiconductor names.
When big ASX news breaks, our subscribers know first
One guidance miss, one missed consensus: how Broadcom’s earnings sparked the rout
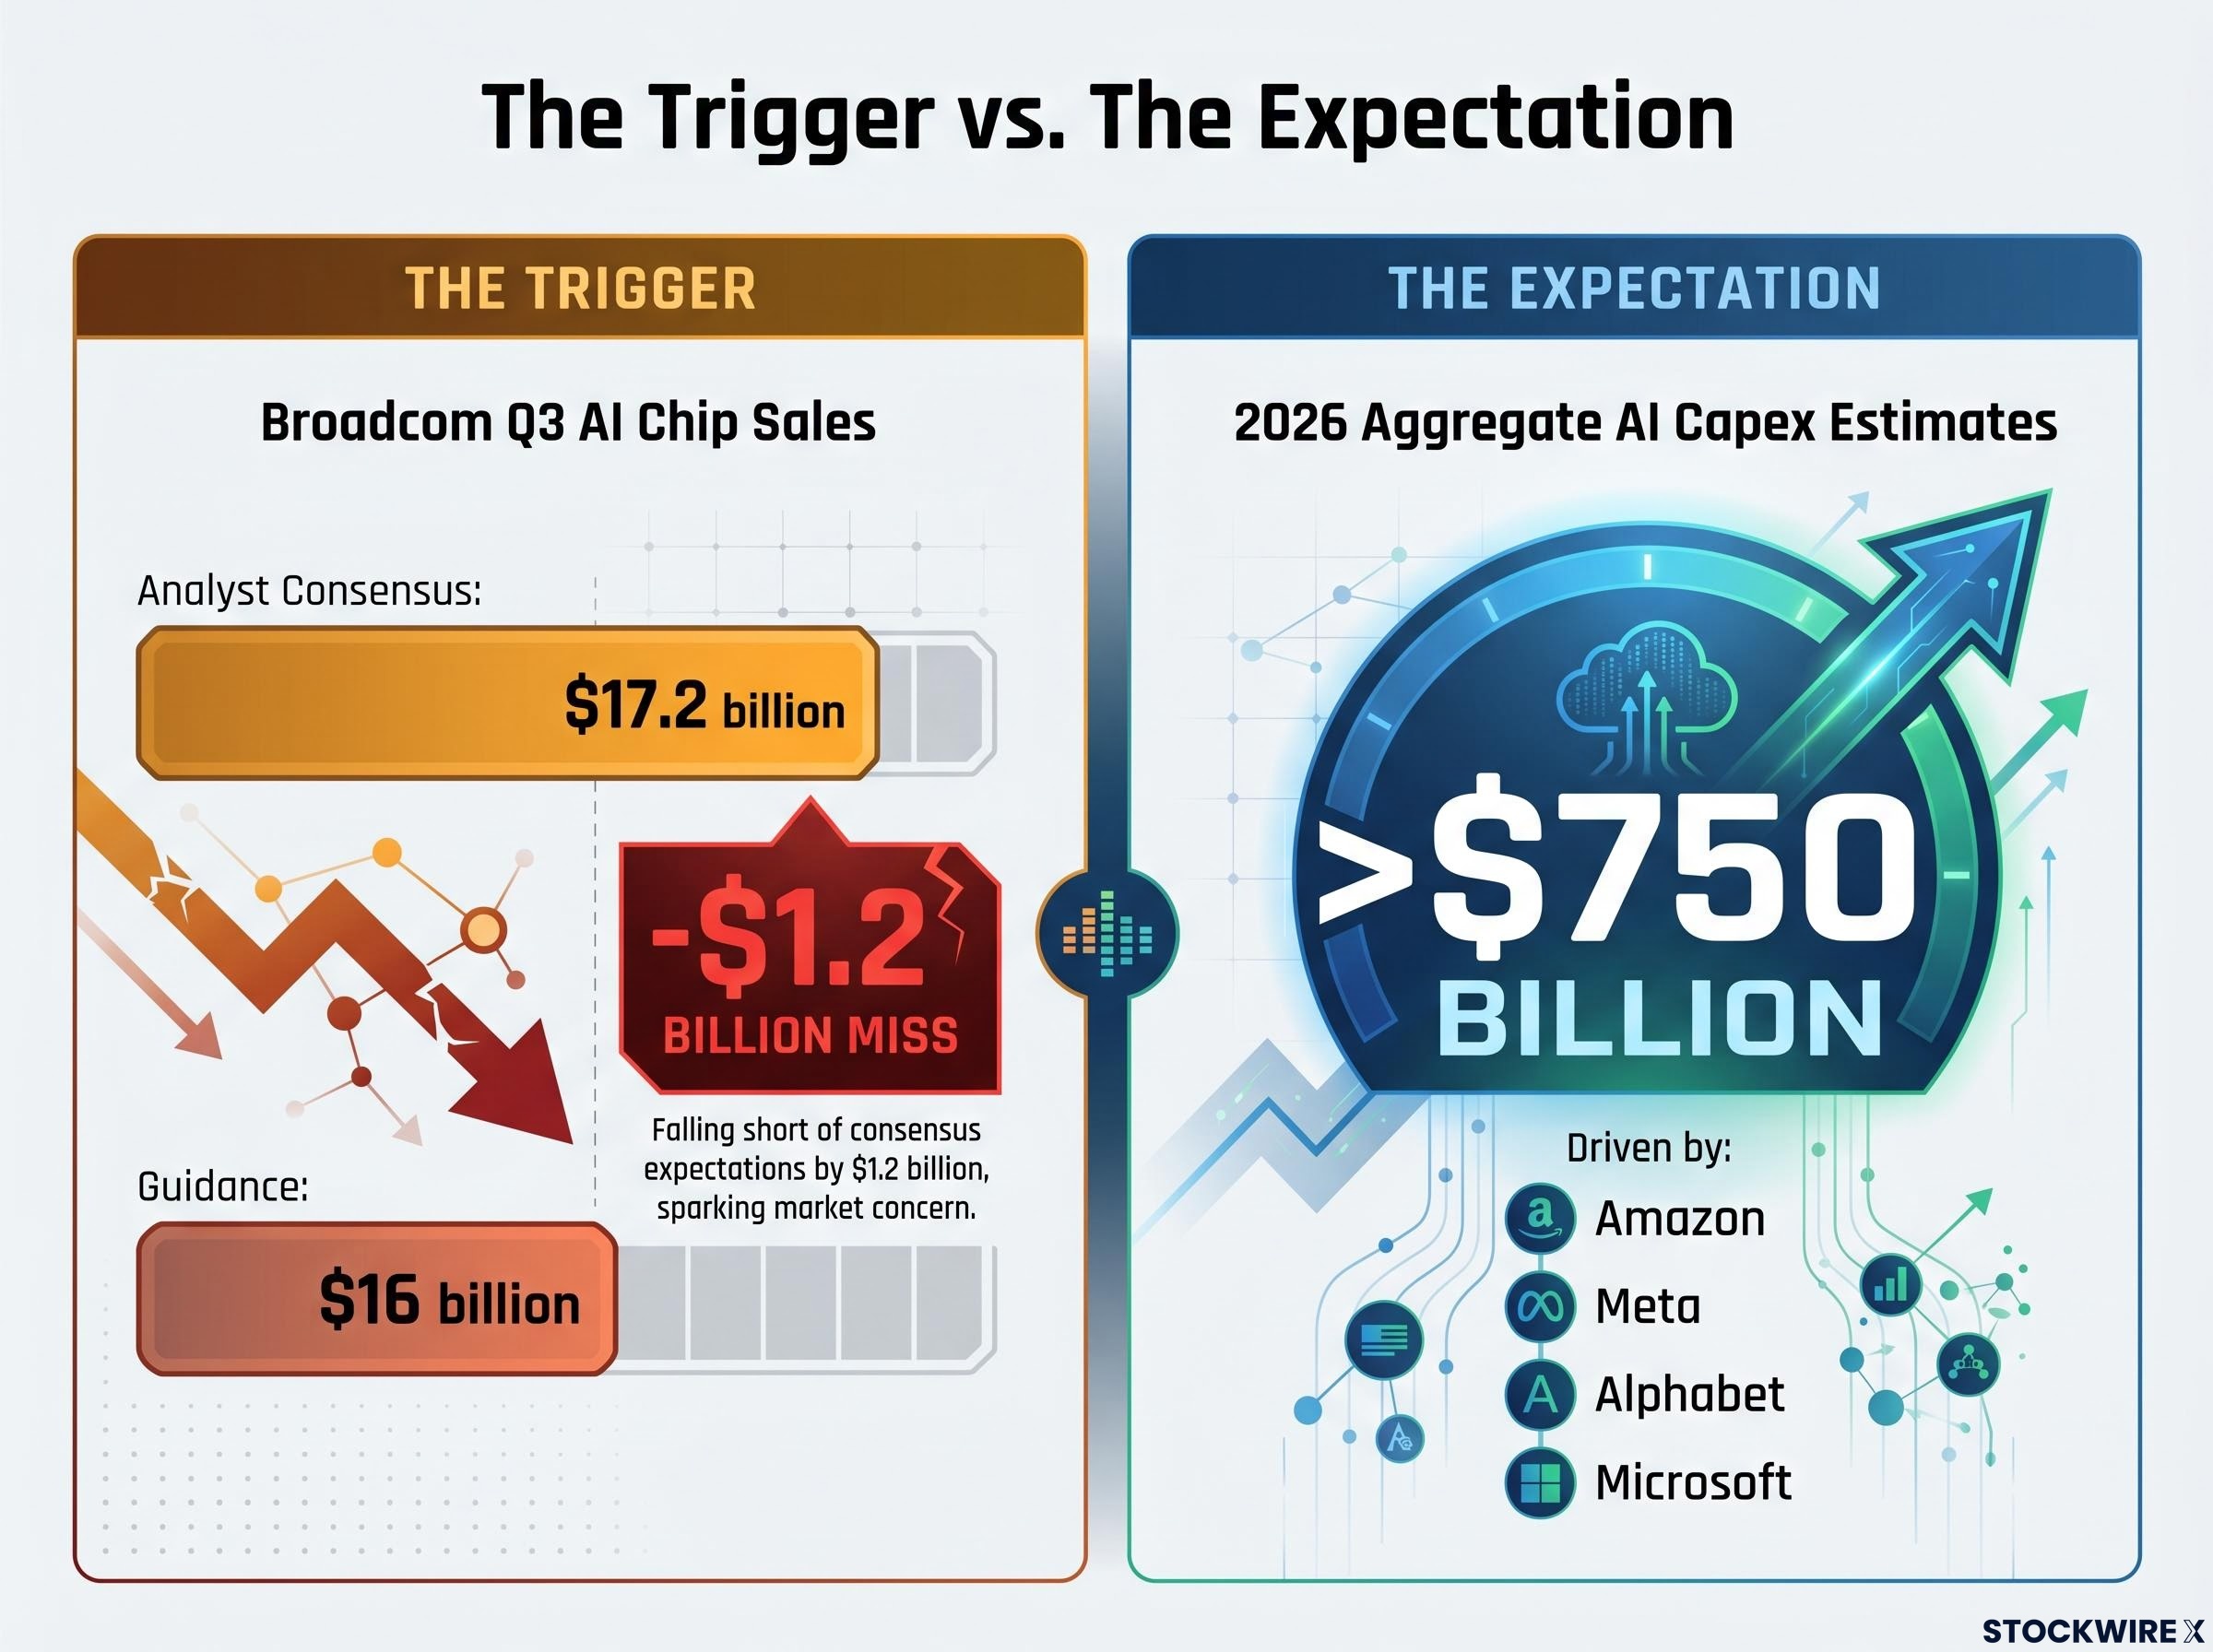
The entire sector rout traced back to a single earnings release. Broadcom’s fiscal Q2 2026 results, reported around 3 June, contained one number that mattered more than any other: Q3 AI chip sales guidance of $16 billion, against an analyst consensus of $17.2 billion.
$16 billion versus the $17.2 billion consensus: the miss that moved markets.
That $1.2 billion shortfall on a single product line would have been unremarkable in a market priced for anything less than perfection. But this market was not priced for anything less than perfection. Broadcom compounded the disappointment by declining to raise its full-year 2026 AI semiconductor sales forecast, a decision that signalled caution precisely when the market expected acceleration.
Broadcom’s position in the custom AI chip market has been building for years: the company reported $4.1 billion in AI semiconductor revenue in Q1 2025, up 77% year over year, as Google, Meta, Amazon, and Microsoft each accelerated their proprietary ASIC programmes to reduce per-inference costs and limit dependence on any single external supplier.
The AI capex assumptions markets had been pricing in
The optimism Broadcom punctured had been building for months. Through early 2026, guidance from Amazon, Meta, Alphabet, and Microsoft had collectively pushed aggregate AI capital expenditure estimates above $750 billion for the full year. Each quarterly update had reinforced the narrative that hyperscaler spending was not merely growing but accelerating without friction.
The Forbes analysis of hyperscaler AI capex commitments for 2026 placed aggregate spending from Amazon, Microsoft, Alphabet, Meta, and Oracle in a range between $700 billion and $900 billion, with approximately 75% of that total directly tied to AI infrastructure, underscoring how much of the market’s optimism rested on the continuation of that spending cycle.
Beneath the surface, questions were emerging in market commentary about whether US growth had become reliant on circular AI financing arrangements, where companies spend on AI infrastructure primarily to sell AI infrastructure to one another. That structural unease had been easy to ignore while every guidance number came in above expectations. Broadcom’s miss made it impossible.
What nine consecutive weekly gains actually means for a market
Before treating 5 June as a shock, consider what preceded it. The S&P 500 had recorded nine consecutive daily gains and nine consecutive weekly gains before the reversal. According to historical data, such a streak has occurred approximately 14 times since 1930.
“Such a winning streak has occurred approximately 14 times since 1930, a data point that reframes the 5 June reversal as a statistical inevitability rather than a market crisis.”
The magnitude of the preceding rally reinforced how arithmetically overdue a pullback had become:
- S&P 500 gained more than 20% from its March 2026 lows
- Global equities rose approximately 17% since late March 2026
- Technology stocks surged nearly 45% from their lows over the same period
Markets that advance 45% in roughly ten weeks do not sustain that trajectory without interruption. The historical record shows that momentum of this rarity is almost always followed by consolidation. The question was never whether a pullback would arrive, but what would trigger it and how deep it would cut.
Five major asset managers including BlackRock, Fidelity, and J.P. Morgan had already shifted toward late-cycle equity positioning before 5 June, maintaining overweight stances while warning that the 30% concentration of total US market capitalisation in the five largest companies represented a single-theme exposure risk that standard diversification metrics were not capturing.
Why semiconductor concentration turned a pullback into a sector rout
The scale of the damage on 5 June cannot be explained by Broadcom’s guidance miss alone. The market’s architecture made it vulnerable.
Two structural factors set the conditions:
- Sector concentration: The semiconductor sector’s share of total market capitalisation had reached approximately 18% at its recent peak, up from roughly 4% approximately two years prior
- Leadership narrowing: The rally had grown increasingly dependent on technology names rather than broad market participation, meaning fewer stocks were carrying more of the index’s weight
When a single sector represents 18% of market capitalisation and corrects sharply, index-level damage is mathematically unavoidable. The S&P 500’s 2.64% decline was not a coincidence of timing; it was a direct consequence of how much weight semiconductors carried in the index.
When passive weightings become concentration bets
Market-cap-weighted index funds, the vehicle through which most passive investors gain equity exposure, automatically increase their allocation to a sector as that sector’s market capitalisation rises. This means an investor holding a broad S&P 500 index fund in June 2026 carried nearly five times the semiconductor exposure they would have held in the same fund two years earlier, without making a single active decision.
The concentration was hiding in plain sight. When the correction arrived, passive investors discovered they had been running a semiconductor overweight they never chose.
Macro pressures and geopolitical risk: the conditions that set the fuse
Broadcom provided the spark, but the fuse had already been laid. Several macro and geopolitical pressures had been building through May and into early June:
- Strong May jobs report: Released earlier in the week, the data stoked concerns about further Federal Reserve tightening and weighed specifically on high-multiple technology names
- Federal Reserve rate path uncertainty: Persistent employment strength reduced the probability of near-term rate cuts, keeping the discount rate on long-duration growth stocks elevated
- Escalating Middle East conflict: Analysts cited the conflict as a contributing factor to inflation fears, supply-chain disruptions, and energy price pressure
- Job loss risk: Analysts separately identified widespread job losses as the primary downside risk capable of transforming a market pullback into a more severe economic deterioration
The convergence matters because it determines what comes next. If rate concerns ease and geopolitical tensions de-escalate, the sell-off may prove self-correcting. If employment pressures persist while energy costs climb, the correction could deepen. A resolution of Middle East tensions was identified by market analysts as a potential sentiment catalyst that could partially offset current headwinds.
Analyst takes: is this a market inflection point or a buying opportunity?
As of early June 2026, analyst opinion on the sell-off was genuinely divided, with no consensus on whether 5 June marked a buying opportunity or the beginning of a sustained downturn.
“Analysts described the episode as a potential reassessment of the AI trade rather than immediately labelling it a sustained downturn.”
The case for treating this as a buying opportunity
The correction-as-entry argument rests on three pillars. First, the nine-consecutive-gain streak was historically rare and a consolidation was arithmetically overdue, meaning the pullback may simply represent mean reversion rather than fundamental deterioration. Second, hyperscaler AI capex consensus remained above $750 billion for 2026 despite the Broadcom miss, suggesting the spending cycle itself remains intact. Third, the sell-off may have cleared speculative froth that had accumulated during the 45% technology rally, resetting valuations to levels that offer a better entry point.
The case for caution
The structural concerns have not resolved. Semiconductor concentration at 18% of market capitalisation has not unwound; it has merely repriced. Macroeconomic pressures from the strong jobs report and Federal Reserve tightening expectations remain active headwinds for high-multiple names. And if Broadcom’s guidance miss is the first of several AI-related recalibrations across the sector, the repricing has further to run. The next round of semiconductor earnings will test whether the miss was company-specific or an early signal of broader demand moderation.
One event to watch as markets attempt to stabilise: the SpaceX IPO
While markets digest the sell-off, a separate development is approaching that will test investor appetite for technology risk in real time. SpaceX is preparing for what could be the largest initial public offering ever:
- Target price: $135 per share
- Targeted raise: approximately $75 billion
- Targeted valuation: approximately $1.77 trillion
- Expected Nasdaq debut: approximately 12 June 2026, under ticker SPCX
The timing is significant. A $75 billion capital raise hitting the market within a week of the largest tech sell-off since April 2025 creates a genuine liquidity and sentiment test. How institutional investors respond to the SpaceX offering will provide early signals about whether the AI and technology growth narrative retains its pull, or whether the appetite for large-scale tech exposure has shifted.
For investors evaluating whether to participate, our full explainer on the SpaceX IPO structure covers the dual-class share arrangement that may give founders majority voting control regardless of public ownership levels, the absence of a traditional institutional roadshow that removes a normal demand signal, and the historical base rate showing IPO cohorts trail comparable established peers by an average of 3.3% per year across the first five years of trading.
The AI trade is not over, but it just got harder to ignore the risks
The 5 June sell-off was not a single-cause event. It was a convergence: a guidance miss landing on a structurally concentrated market, in a macro environment already primed for risk reduction, after a rally of historically rare magnitude. The hyperscaler AI capex cycle remains intact at this stage, with aggregate spending commitments above $750 billion for 2026. But any further guidance disappointments from semiconductor or AI companies will test that thesis directly.
The variables worth monitoring from here:
- Federal Reserve signals on the rate path following the strong May employment data
- Middle East developments and their impact on energy prices and inflation expectations
- SpaceX IPO reception as a real-time gauge of institutional technology appetite
- The next round of semiconductor earnings, which will determine whether Broadcom’s miss was isolated or indicative of broader demand moderation
The honest reading at this stage is that the outcome depends on conditions that have not yet resolved. The sell-off has surfaced risks that were always present but easy to overlook during a 45% rally. They are no longer easy to overlook.
Investors weighing whether to reduce technology exposure after the sell-off will find our deep-dive into market leadership rotation useful: it examines the valuation spreads between US Tech and international developed markets at near multi-decade extremes, reviews how prior episodes of extreme market concentration including the Nifty Fifty and the TMT bubble resolved over the subsequent decade, and outlines the incremental rebalancing framework institutional managers are applying rather than a binary exit from US growth.
This article is for informational purposes only and should not be considered financial advice. Investors should conduct their own research and consult with financial professionals before making investment decisions. Past performance does not guarantee future results. Financial projections are subject to market conditions and various risk factors.