Fed Holds Rates but Committee Splits 9-9 on What Comes Next
7 hrs ago
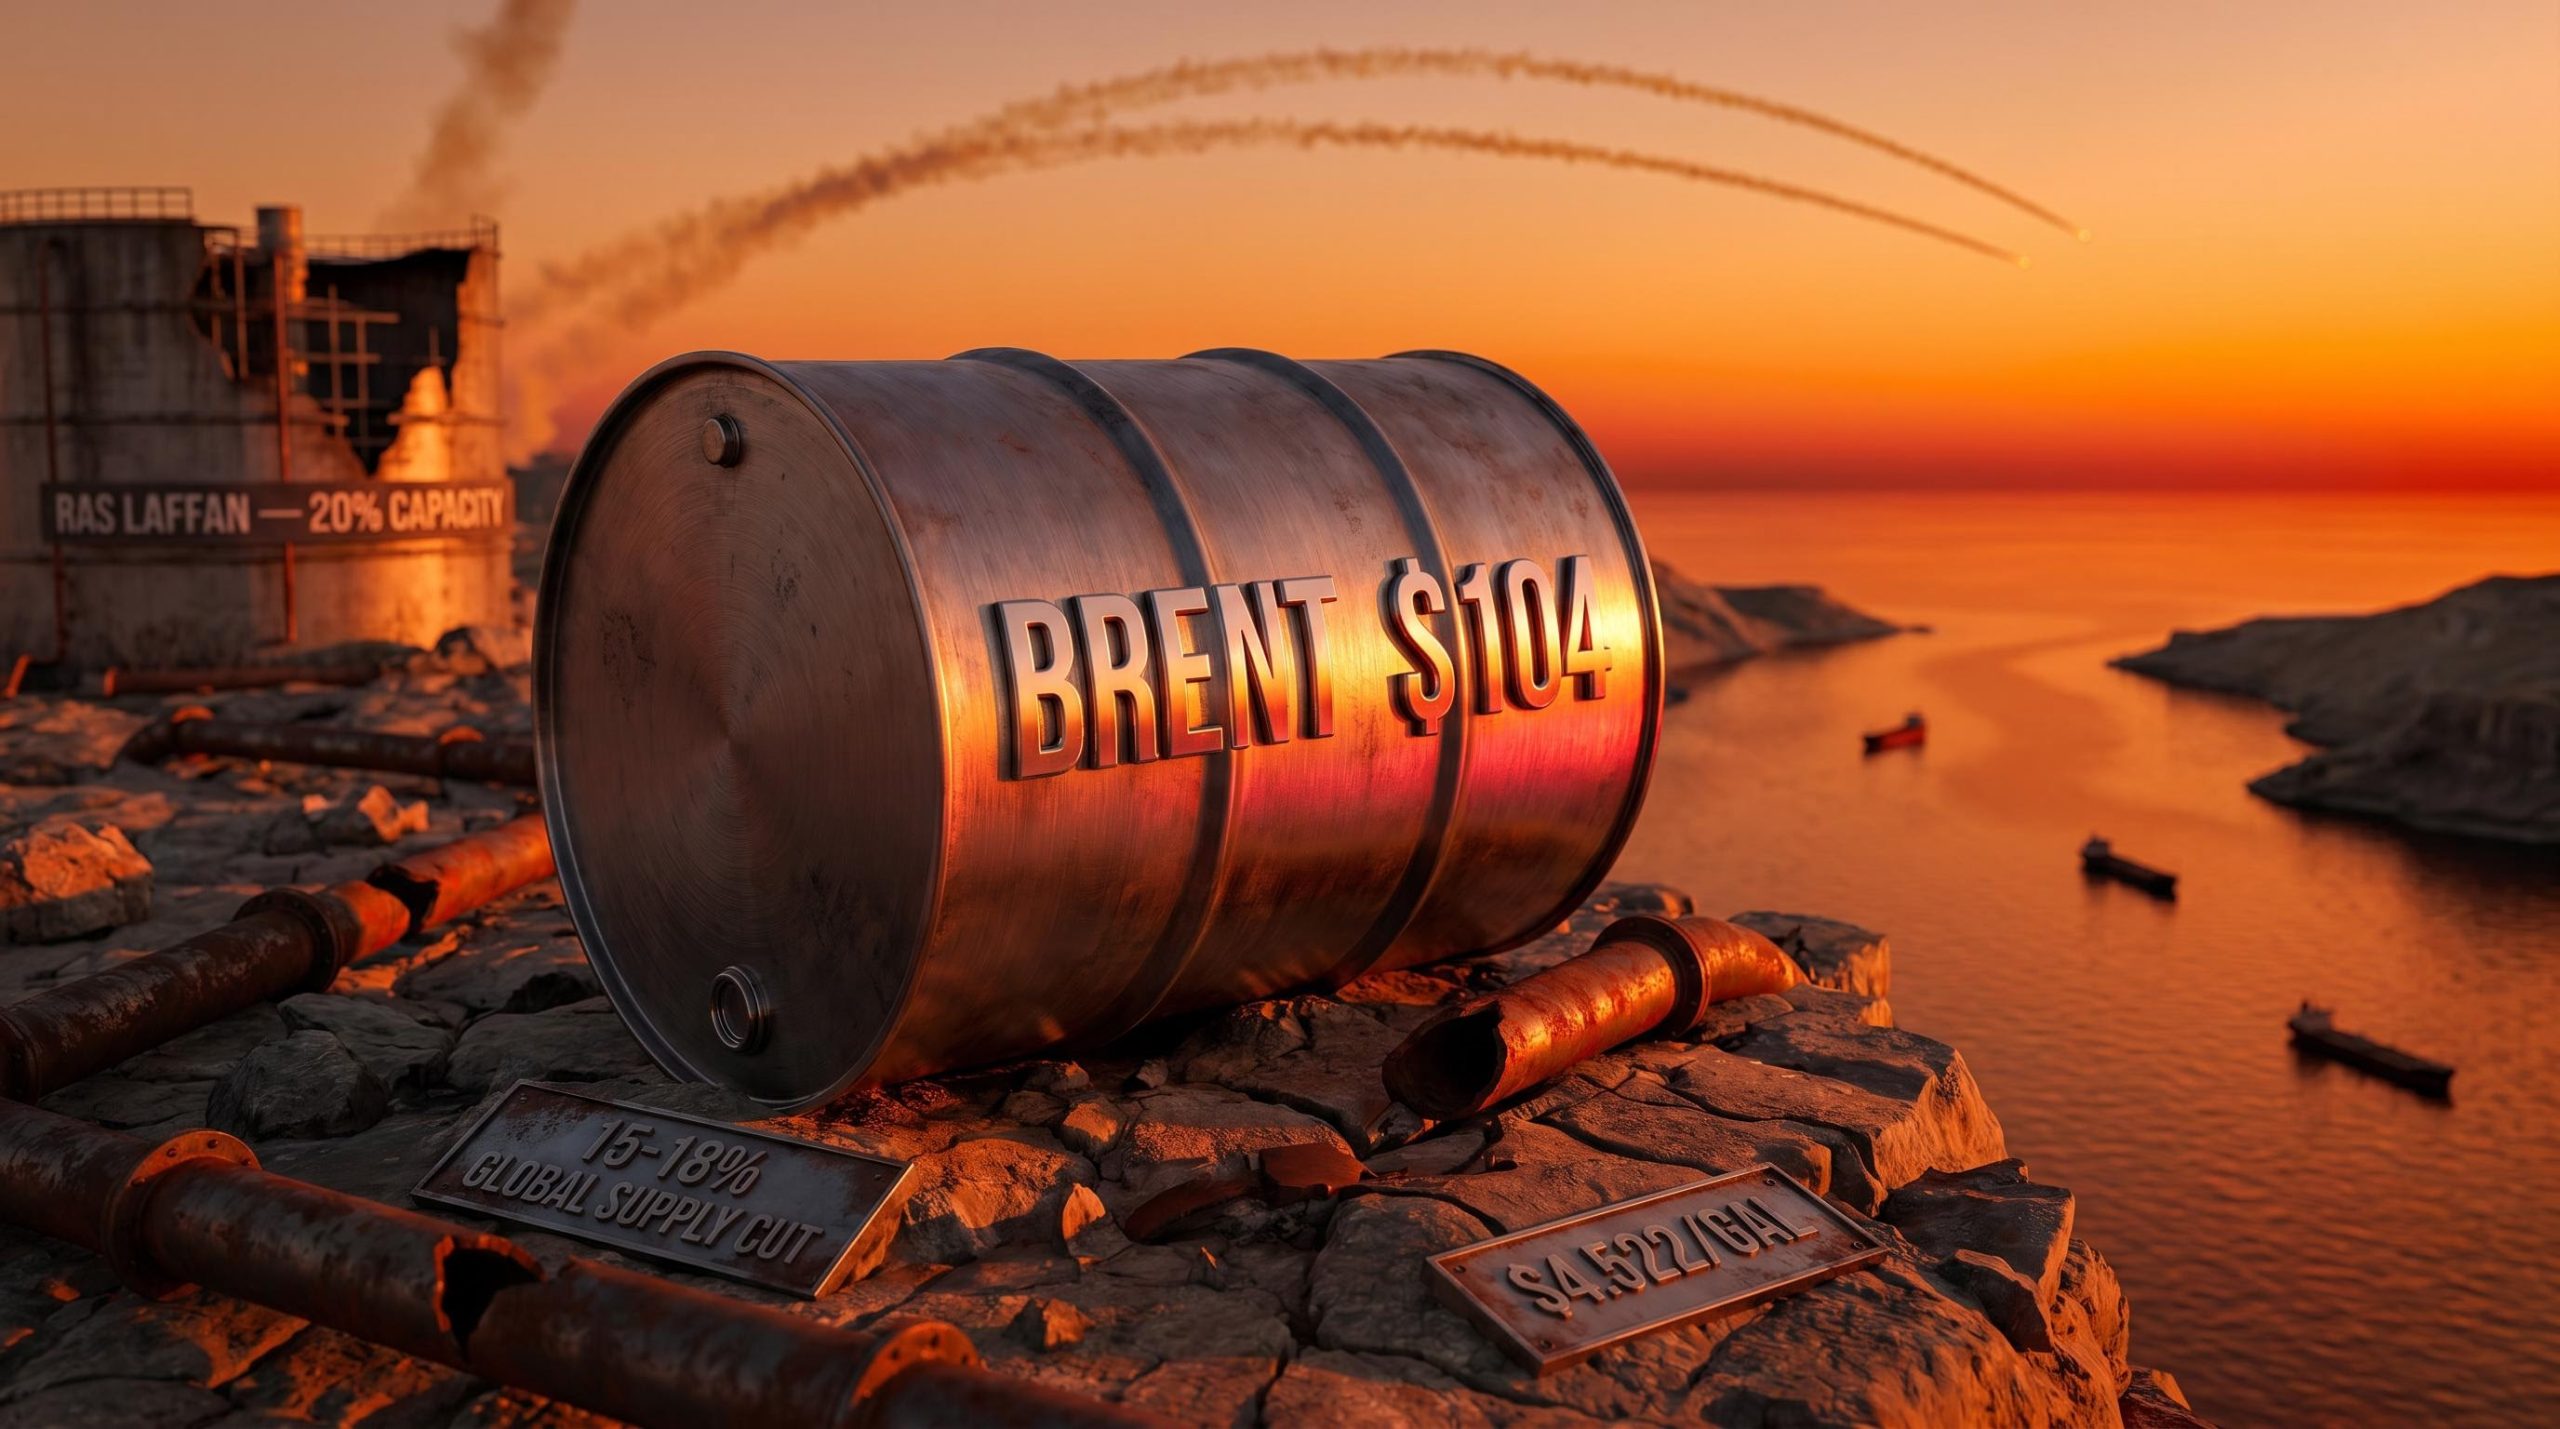
The Strait of Hormuz is moving roughly three tankers a day where 50 used to pass. On 10 May 2026, Brent crude crossed $104 per barrel after Iran launched fresh drone strikes on facilities in the UAE, Kuwait, and Qatar, and the Trump administration rejected Tehran’s latest peace overture. The International Energy Agency (IEA) has called this the largest supply disruption ever recorded, with an estimated 15-18% of global oil supply cut from the market, a shortfall that dwarfs the 7% impact of the 2022 Ukraine war.
The ripple effects now reach directly into the Federal Reserve’s rate-cutting calculus, household petrol budgets, and the inflation trajectory for the rest of 2026. What follows traces the full causal chain: from the physical blockade of Hormuz to the Goldman Sachs and Pimco forecasts that are reshaping what investors should expect from interest rates, inflation, and their portfolios through year-end.
Satellite data tells the story more bluntly than any analyst note. The Strait of Hormuz, the chokepoint through which roughly a fifth of global oil once flowed, is operating at approximately 12% of pre-war capacity. Three tankers a day are making the transit. Before the conflict, 50 did.
Qatar’s Ras Laffan LNG facility, struck on 18 March, is running at 20% capacity. Engineers project a 3-5 year repair timeline. Saudi Aramco CEO Amin Nasser has estimated that approximately 1 billion barrels have been lost from global supply over two months.
The key operational metrics:
The IEA has characterised the current disruption as “the largest supply disruption in recorded history,” a designation that exceeds every prior energy crisis including the 1973 Arab oil embargo.
Diplomatic efforts have stalled. Trump rejected Iran’s 8 May proposal for a partial Hormuz reopening (conveyed through Pakistani intermediaries) in exchange for sanctions relief. Oman-mediated talks collapsed on 10 May following the drone strikes on Gulf infrastructure. A single QatarEnergy tanker completed transit on 9 May, a fragile signal amid a broader blockade that remains functionally intact.
The physical blockade is compounded by what analysts have called a Hormuz triple lock: US naval operations, Iranian toll enforcement on non-US and non-Israeli vessels, and the near-total withdrawal of commercial war-risk insurance coverage that has made standard tanker transit commercially unviable even when physically possible.
The United States has been a net oil exporter since 2019. Domestic crude production sits at a record 13.573 million barrels per day, with the Permian Basin alone contributing 6.2 million bpd. By volume, the country does not need a single barrel from the Persian Gulf.
Yet the national average petrol price stands at $4.522 per gallon as of 10 May, up approximately 15% year-over-year. The disconnect between self-sufficiency and pump-price pain comes down to one mechanism: global benchmark pricing. US refiners sell their output at prices set by Brent and West Texas Intermediate (WTI), which are global benchmarks, not domestic ones. When Brent rises to $104, every barrel produced in Texas is worth more, and so is the petrol refined from it, regardless of whether that barrel ever left American soil.
| Metric | Pre-crisis level | Current level (10 May) | Change |
|---|---|---|---|
| Brent crude | ~$80/bbl | $104.80/bbl | +31% |
| WTI crude | ~$75/bbl | ~$99/bbl | +32% |
| National avg petrol | ~$3.93/gal | $4.522/gal | +15% y/y |
| RBOB futures | Baseline | +12% w/w | +12% w/w |
The Dallas Fed models a cumulative increase of +50 cents per gallon since the crisis began, with initial daily moves of 5-10 cents. Refining margins have surged 25%, straining already limited capacity. JPMorgan has flagged the risk of petrol reaching $5 per gallon given refinery constraints.
The Strategic Petroleum Reserve (SPR), the government’s emergency stockpile of crude oil, holds approximately 397.9 million barrels as of 30 April 2026. Releases were paused on 7 May amid concerns over low efficacy at current inventory levels. The administration has indicated a preference for auctions rather than emergency draws if oil remains above $100 per barrel, a signal that the SPR is no longer viewed as a viable short-term price relief tool.
April 2026 CPI is estimated at approximately 3.4-3.8% year-over-year, with the official Bureau of Labor Statistics (BLS) release scheduled for 12 May 2026. That figure already reflects the early stages of the Brent surge. What comes next, according to multiple bank models, is structurally worse than what the 2022 Ukraine episode produced.
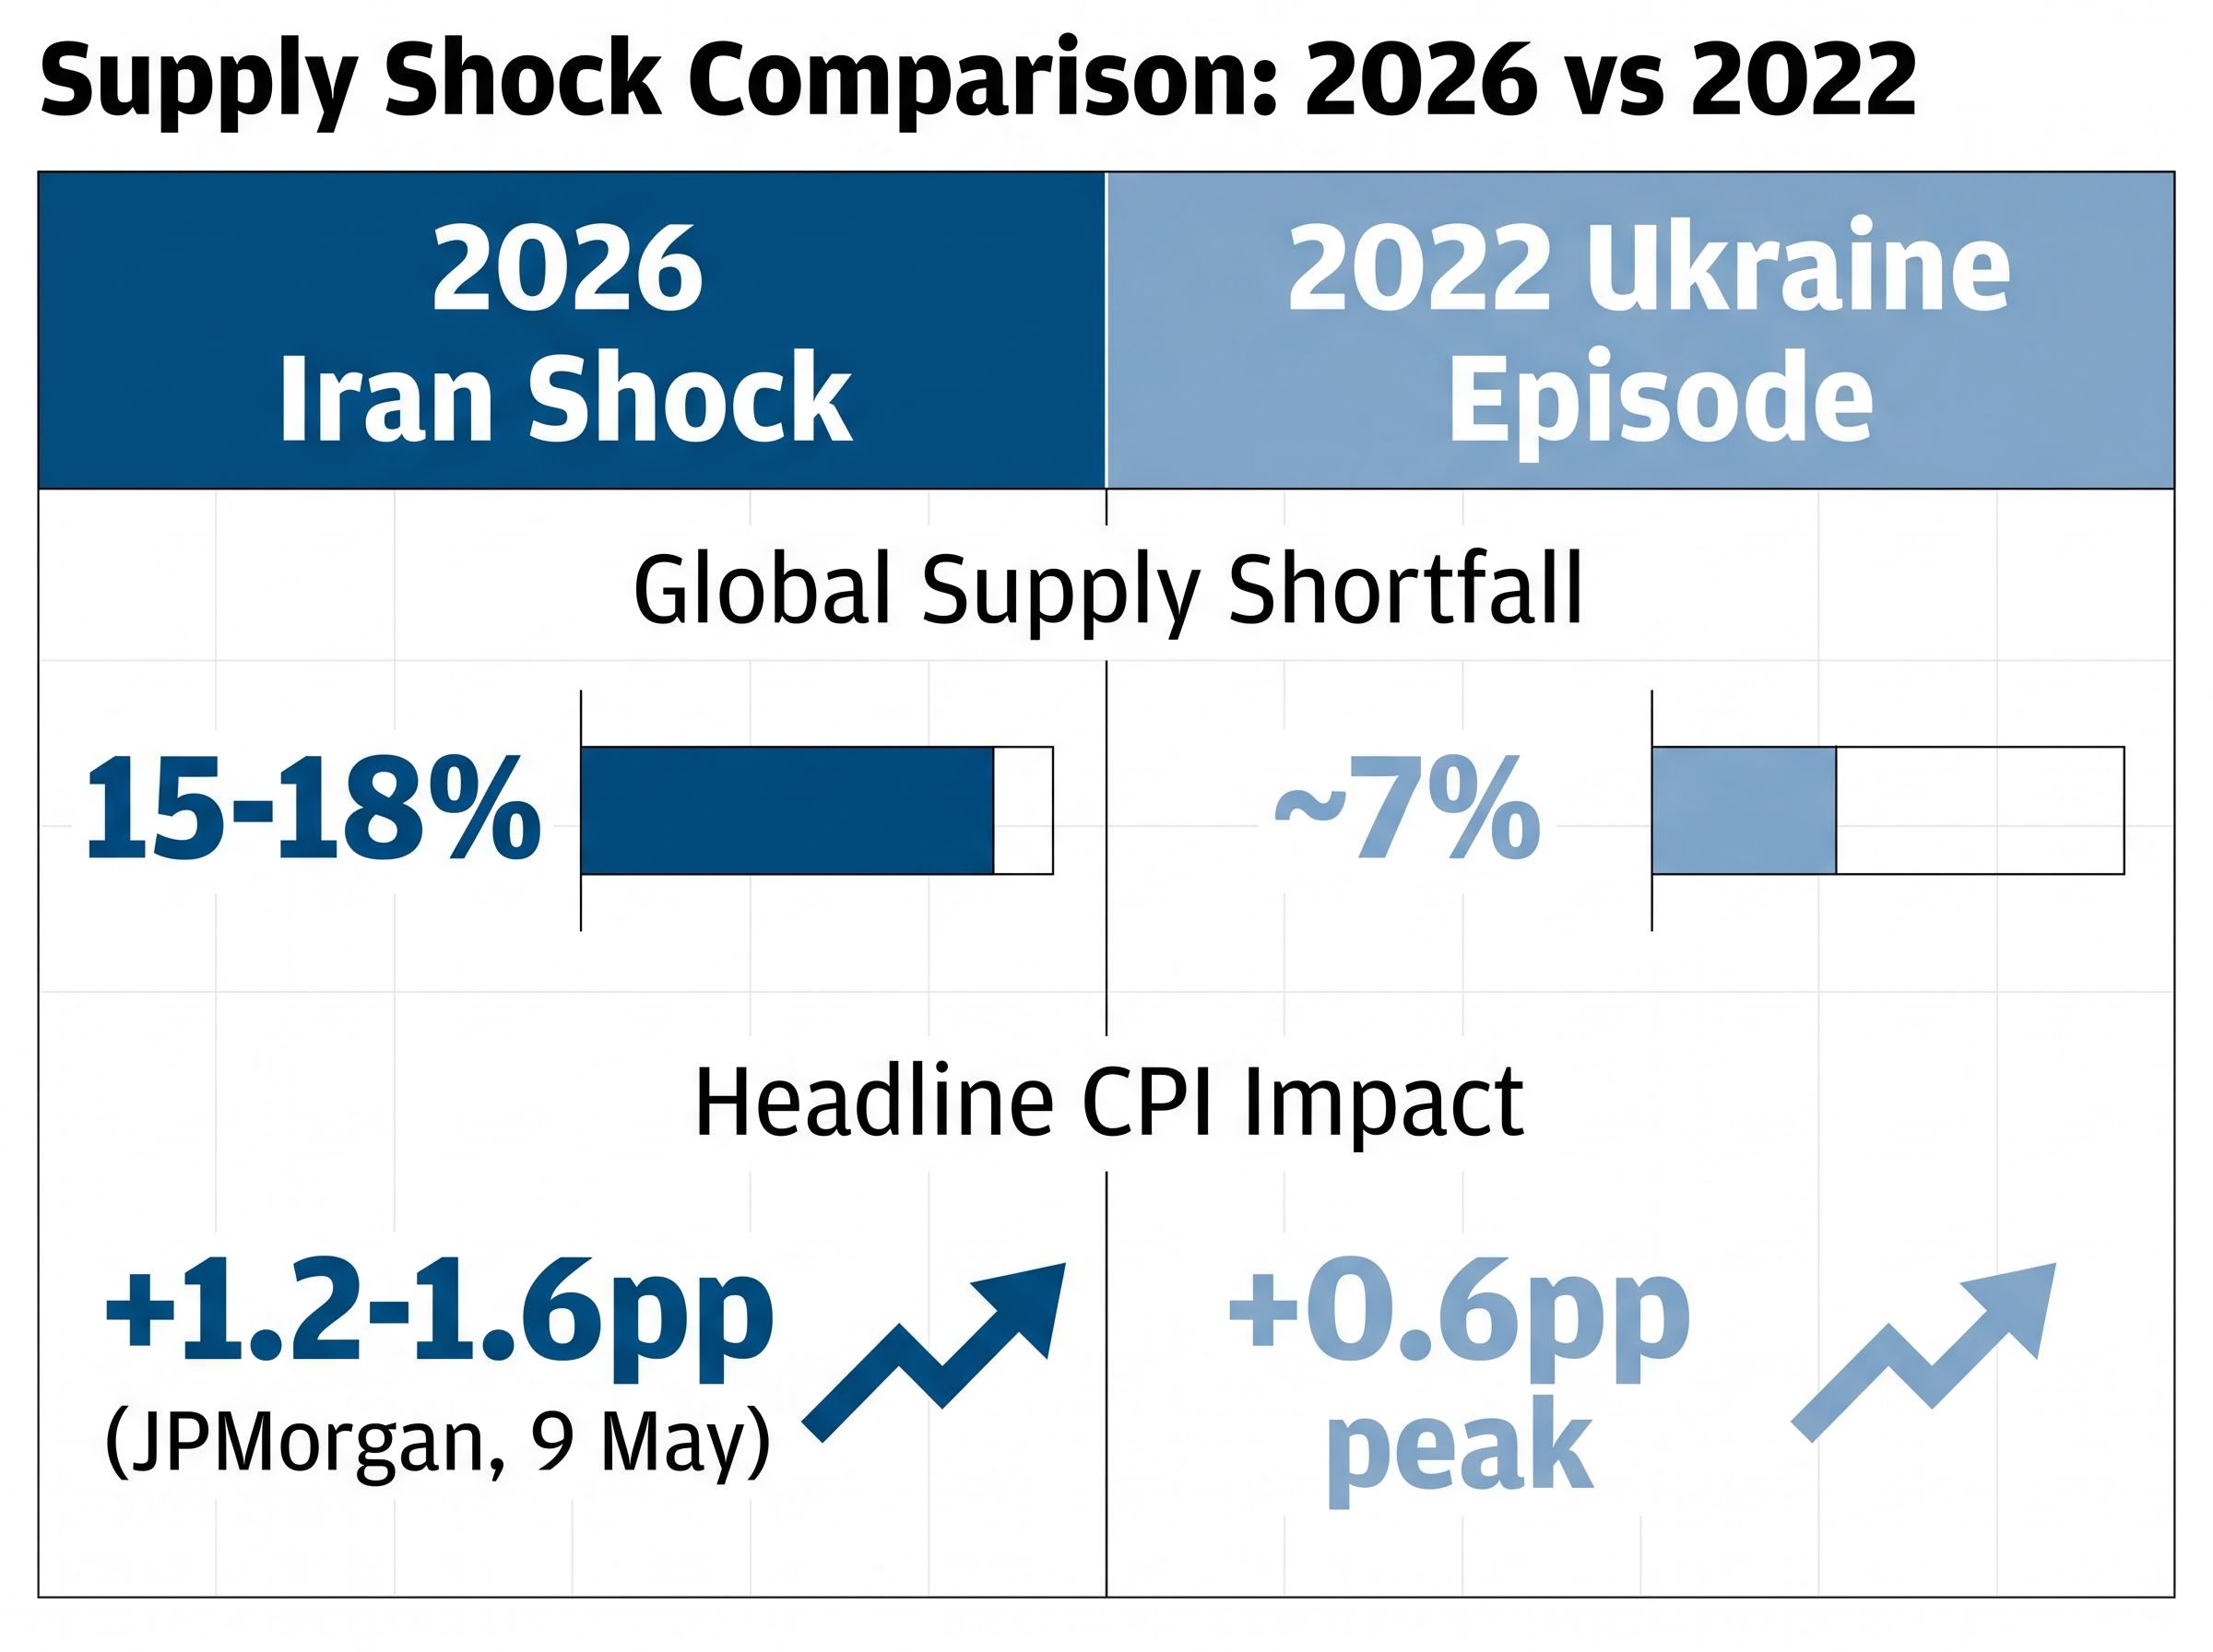
The comparison is instructive. In 2022, WTI peaked near $130 per barrel and added roughly 0.6 percentage points to headline CPI. The effect faded within six months. The current shock, despite a lower absolute oil price, is projected to generate a larger and more durable inflation impact for three reasons: the supply shortfall is more than double (15-18% versus 7%), the disruption to LNG and fertiliser supply chains creates second-order pass-through that 2022 lacked, and the SPR response has been slower and less aggressive.
| Metric | 2026 Iran shock | 2022 Ukraine episode |
|---|---|---|
| Headline CPI impact | +1.2-1.6pp (JPMorgan, 9 May) | +0.6pp peak |
| Core PCE addition | +0.7-1.0pp by Dec 2026 (Dallas Fed) | +0.3pp |
| Household inflation expectations (1-yr) | +0.6-0.8pp to ~3.5% (Univ. of Michigan) | +0.4pp peak |
| Q4 CPI forecast (y/y) | 3.4-4.0% (Morgan Stanley, 8 May) | 9.1% peak; faded within 6 months |
| Supply shortfall | 15-18% of global supply | ~7% |
The Dallas Fed’s May analysis noted that the current supply shortfall “significantly exceeds the 2022 Ukraine war disruption,” with slower SPR drawdown amplifying the inflationary effects across both headline and core measures.
Morgan Stanley projects Q4 2026 CPI at 3.4-4.0% year-over-year. University of Michigan preliminary data for May shows one-year inflation expectations rising 0.6-0.8 percentage points to approximately 3.5%. The inflation comparison is not academic; it is the hinge on which Fed policy turns.
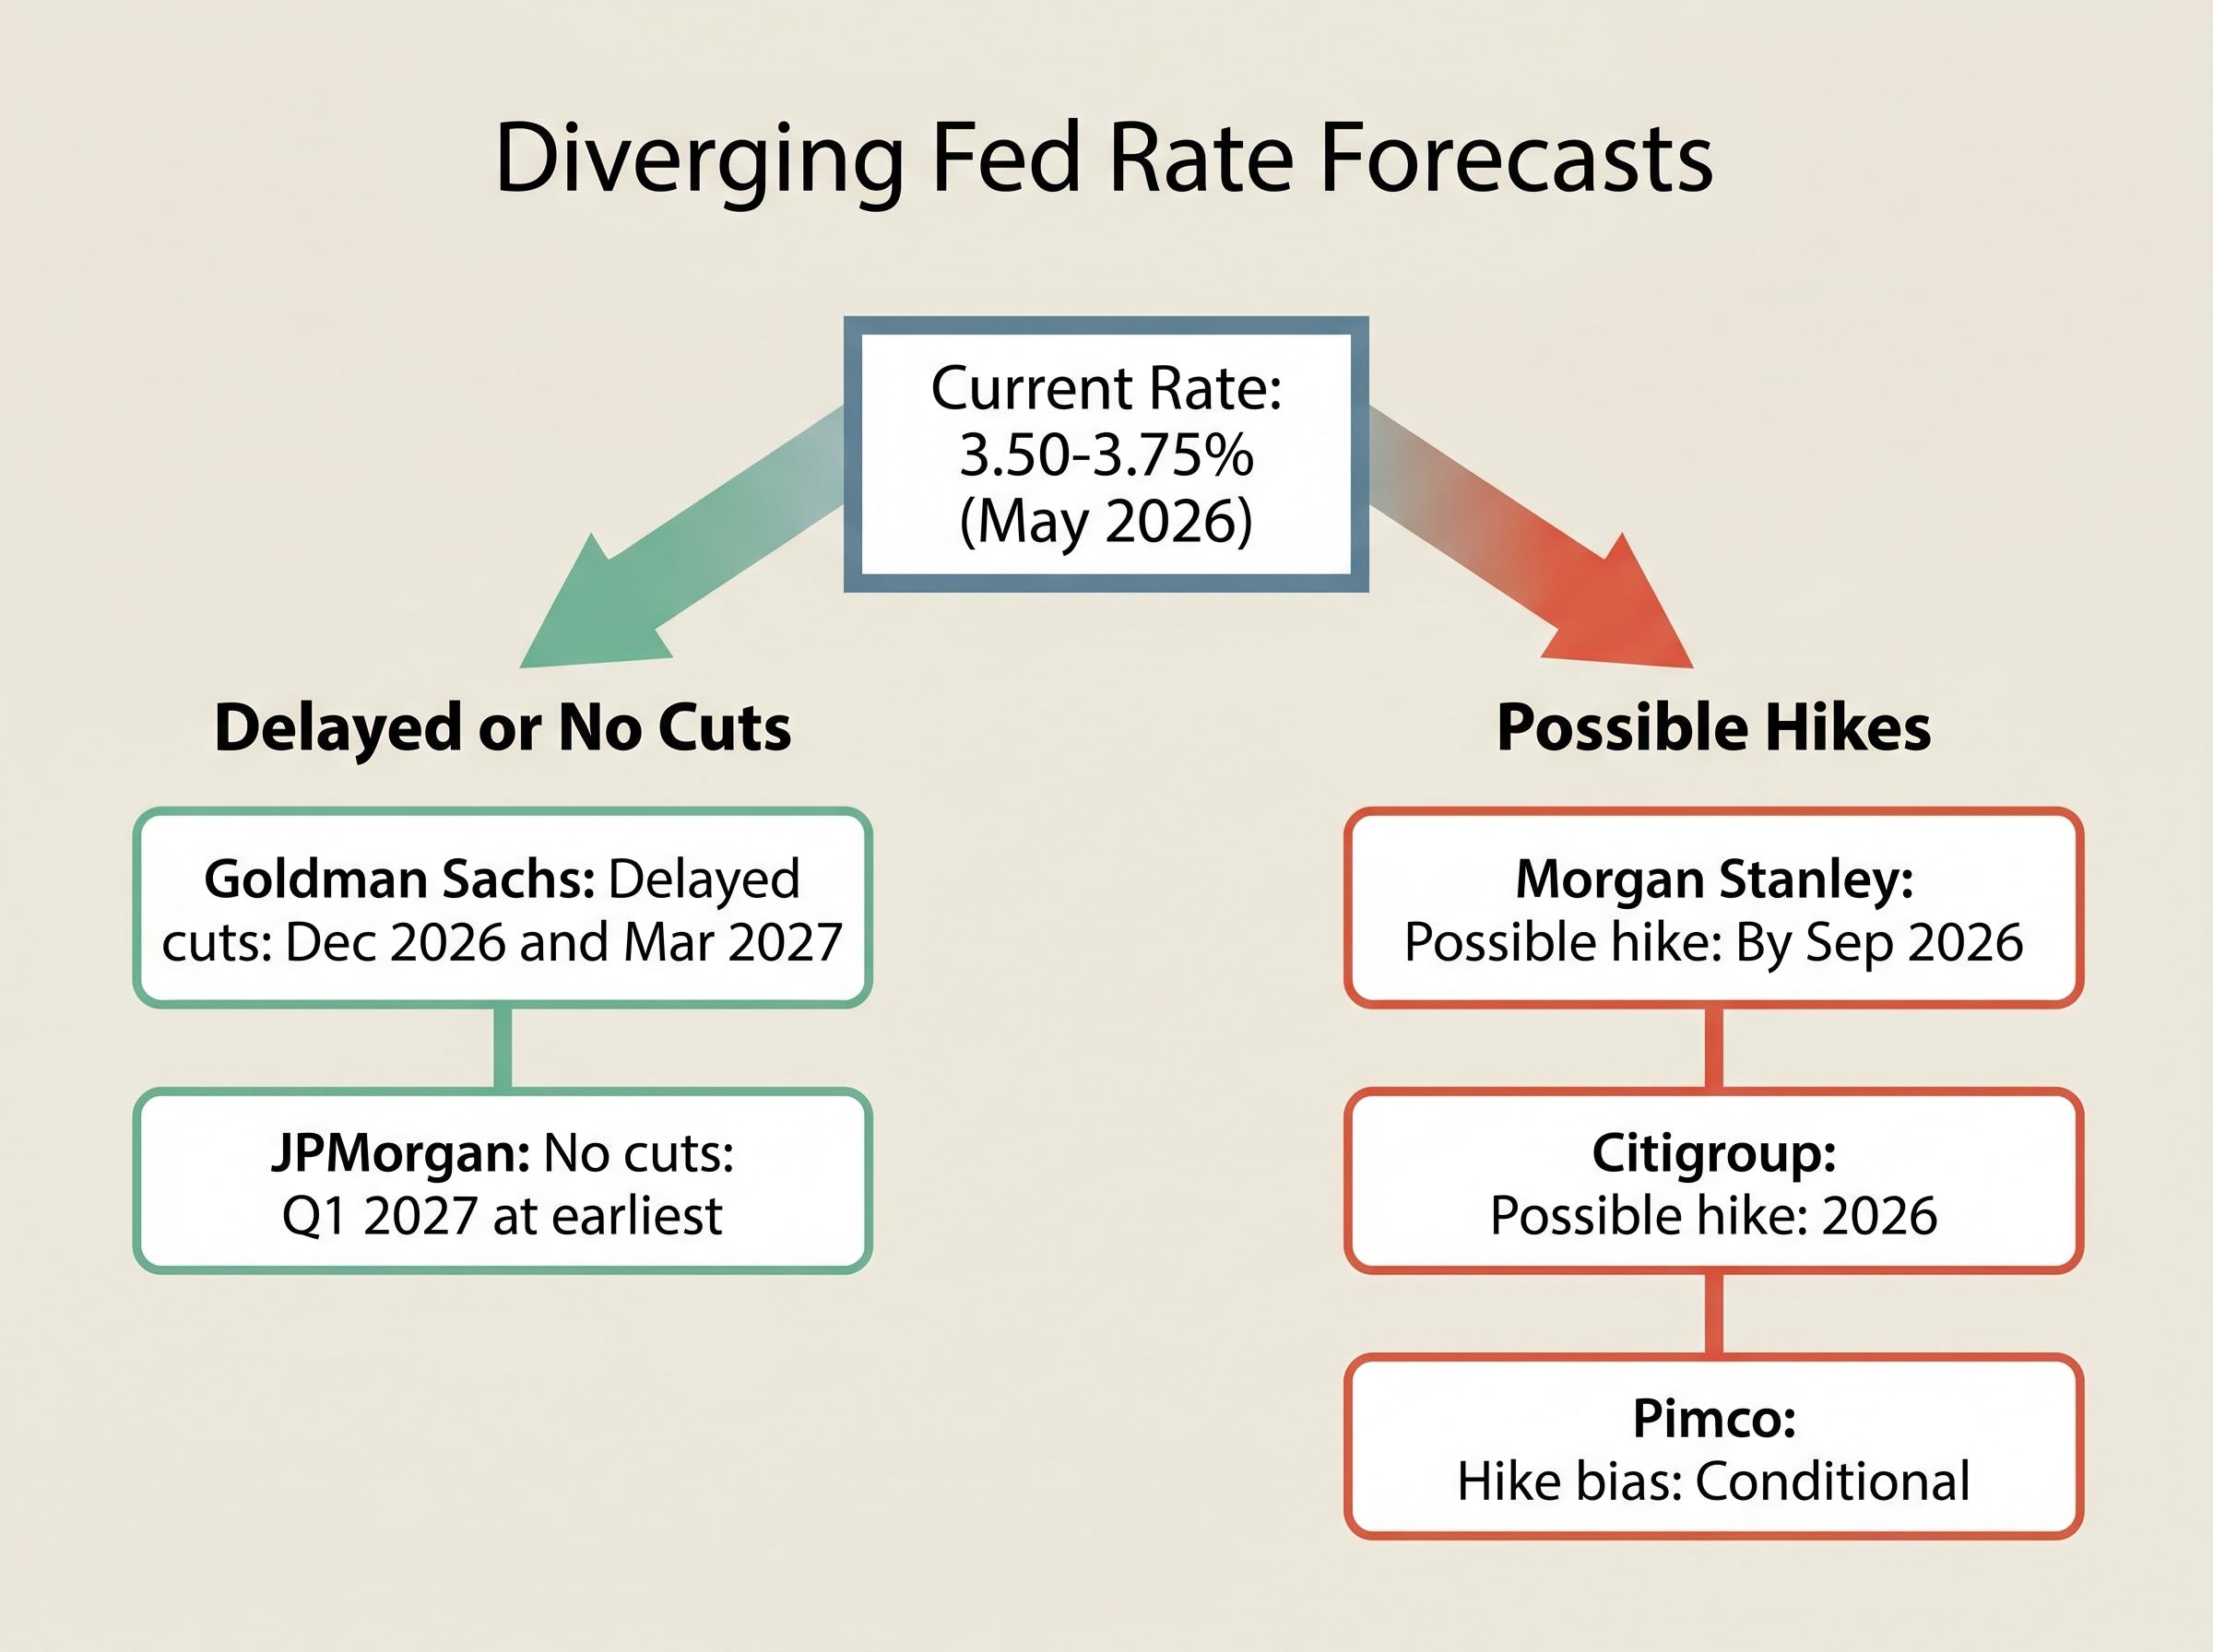
The federal funds rate sits at 3.50-3.75% as of May 2026. Before the Hormuz crisis, markets had priced in a continuation of the rate-cutting cycle. That expectation is now being repriced in real time, and the range of institutional forecasts reveals genuine disagreement about what comes next.
| Institution | Rate direction | Timing | Key condition |
|---|---|---|---|
| Goldman Sachs | Delayed cuts | Dec 2026 and Mar 2027 | Inflation moderation required |
| JPMorgan | No cuts | Q1 2027 at earliest | Core PCE +1.2-1.5pp by year-end |
| Morgan Stanley | Possible hike | By Sep 2026 | Brent sustained above $105/bbl |
| Citigroup | Possible hike | 2026 | $100+ oil persists |
| Pimco | Hike bias | Conditional | Iran-driven inflation compels action |
Goldman Sachs sees cuts delayed to December 2026 and March 2027, according to Bloomberg. JPMorgan has revised US GDP growth to 1.1% for 2026, down from 1.8%, and projects no cuts until Q1 2027. On the hawkish end, Morgan Stanley assigns elevated probability to a rate hike by September 2026 if Brent exceeds $105 per barrel, while Pimco told the Financial Times that inflation driven by the Iran conflict could compel the Fed to raise rather than cut rates.
The stagflation parameters that would make conventional policy inadequate are narrowing:
Morgan Stanley places recession odds at 40%, up from 25% before the crisis. The dual-mandate tension, containing inflation while supporting employment, has rarely been this acute outside the 1970s.
The mechanism by which oil prices transmit into recession runs through four simultaneous channels: reduced consumer disposable income as petrol costs rise, higher business input costs across transport and manufacturing, Federal Reserve rate pressure from the resulting inflation, and an investment and hiring pullback as corporate confidence falls, a sequence visible in every major US recession since 1973.
The analytical diagnosis is clear: a supply shock larger than 2022, stickier inflation, and a Fed that may hike rather than cut. The question for investors is what to own in that environment. Four of the largest asset managers have published positioning shifts in the past week, and they share a directional consensus around real assets as the primary stagflation hedge.
| Institution | Overweight | Underweight | Rationale |
|---|---|---|---|
| BlackRock | Energy (XLE +25.39% YTD), gold, TIPS | Cyclicals | Hedge stagflation via real assets; shift to 50/50 with 10% commodities |
| Vanguard | Duration extension (TLT), value, energy | Corporate bonds; equities above 55% for age 60+ | Defensive tilt; favour municipal over corporate bonds |
| State Street | Oil futures, 15% alternatives, cash/T-bills (+5%) | Airlines, hotels, growth tech | Recession hedge; tactical commodity positioning |
| Bridgewater | 30% bonds, 25% gold/commodities, 25% cash | Broad equities (20% only, energy/defensives) | All-weather; warns of 15-20% S&P 500 drawdown |
Bridgewater Associates has issued the starkest warning: a 15-20% S&P 500 drawdown is possible if Hormuz remains closed through Q3 2026. Bank of America models a potential $2 trillion equity market capitalisation loss if disruptions persist. The VIX remains above 25, reflecting elevated uncertainty.
The historical equity impact of sustained high gas prices adds another layer to the portfolio risk calculus: every time US gasoline has exceeded $4.00 per gallon across the 44 weeks since 1993 when that threshold was breached, the S&P 500 has averaged an approximately 11% decline over the following six months, a signal that Bridgewater’s 15-20% drawdown warning echoes but does not fully capture.
The thresholds that matter most for portfolio risk:
This article is for informational purposes only and should not be considered financial advice. Investors should conduct their own research and consult with financial professionals before making investment decisions. Past performance does not guarantee future results. Financial projections cited are subject to market conditions and various risk factors.
The duration of the disruption, more than its current intensity, determines whether the Fed hikes, whether the 40% recession probability rises further, and whether the stagflation scenario becomes consensus rather than tail risk. Three escalation risks, ordered by severity, could move the shock into a fundamentally different category:
Saudi Aramco’s estimate of approximately 1 billion barrels lost from global supply over two months remains the most concrete measure of cumulative supply destruction, and that figure grows daily.
Relief scenarios exist, but they do not offer immediate price normalisation. Bloomberg analysis warns that even after Hormuz reopens, oil prices could remain elevated as depleted stockpiles are replenished, a restocking cycle that historically extends price support for months beyond the triggering event. China’s expanding influence among Asian nations facing supply shortages, reported by the New York Times, adds a geopolitical complexity layer that extends beyond the bilateral US-Iran dynamic.
Near-term data points and events to monitor:
The Iran conflict has created a supply shock that is structurally distinct from 2022: larger in scale, broader in its second-order channels, and more durable in its projected inflationary impact. The Fed faces a policy bind that the optimistic rate-cutting consensus of early 2026 did not anticipate, and the range of institutional forecasts, from delayed cuts to outright hikes, reflects genuine uncertainty about what comes next.
Two indicators matter most in the coming weeks. The 12 May BLS CPI release will confirm whether the April print lands at the upper or lower end of the 3.4-3.8% range, setting the baseline for every downstream Fed projection. Daily Hormuz tanker traffic will signal whether the blockade is loosening or hardening.
Markets priced for a rate-cutting cycle are now navigating a world where a hike is a credible scenario. The adjustment to that reality, across bonds, equities, and consumer budgets, is still in its early stages.
For investors trying to translate the rate-cutting reversal into specific sector and asset-class positioning, our deep-dive into Fed rate policy and equity valuation dislocations identifies where the adjustment is creating rare discounts: technology, growth, and small-cap equities are currently trading at historically unusual discounts of 23%, 21%, and 17% respectively to Morningstar fair value, while energy has moved from the most undervalued to the most overvalued sector in a single year.
These statements involve forward-looking projections and are subject to change based on market developments and geopolitical conditions.
The Strait of Hormuz is a narrow waterway through which roughly a fifth of global oil supply once flowed; with the current Iran conflict reducing tanker traffic from 50 vessels per day to approximately 3, the IEA has classified the resulting shortfall as the largest supply disruption in recorded history.
Even though the US produces a record 13.573 million barrels per day, domestic petrol prices are set by global benchmarks like Brent crude; when Brent rises above $104 per barrel, every barrel refined in the US becomes more valuable and pump prices rise accordingly, regardless of import dependency.
The 2026 Iran conflict has removed an estimated 15-18% of global oil supply, more than double the 7% shortfall caused by the 2022 Ukraine war, and JPMorgan projects it will add 1.2-1.6 percentage points to headline CPI versus just 0.6 percentage points at the 2022 peak.
Forecasts range from delayed cuts (Goldman Sachs sees December 2026 at the earliest) to no cuts until Q1 2027 (JPMorgan) to outright rate hikes by September 2026 (Morgan Stanley and Pimco), reflecting genuine institutional disagreement over how the Fed will handle simultaneous inflation and slowing growth.
BlackRock, Bridgewater, and State Street all recommend overweighting real assets including energy equities, gold, TIPS, oil futures, and cash or T-bills, while reducing exposure to cyclicals, airlines, growth technology, and broad equities amid the stagflation risk.