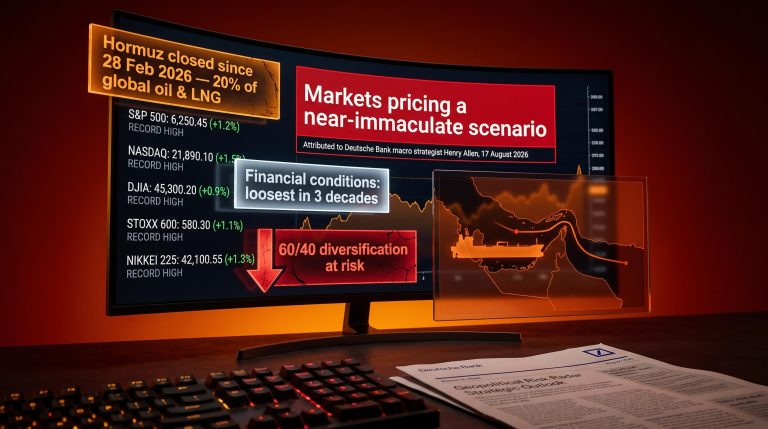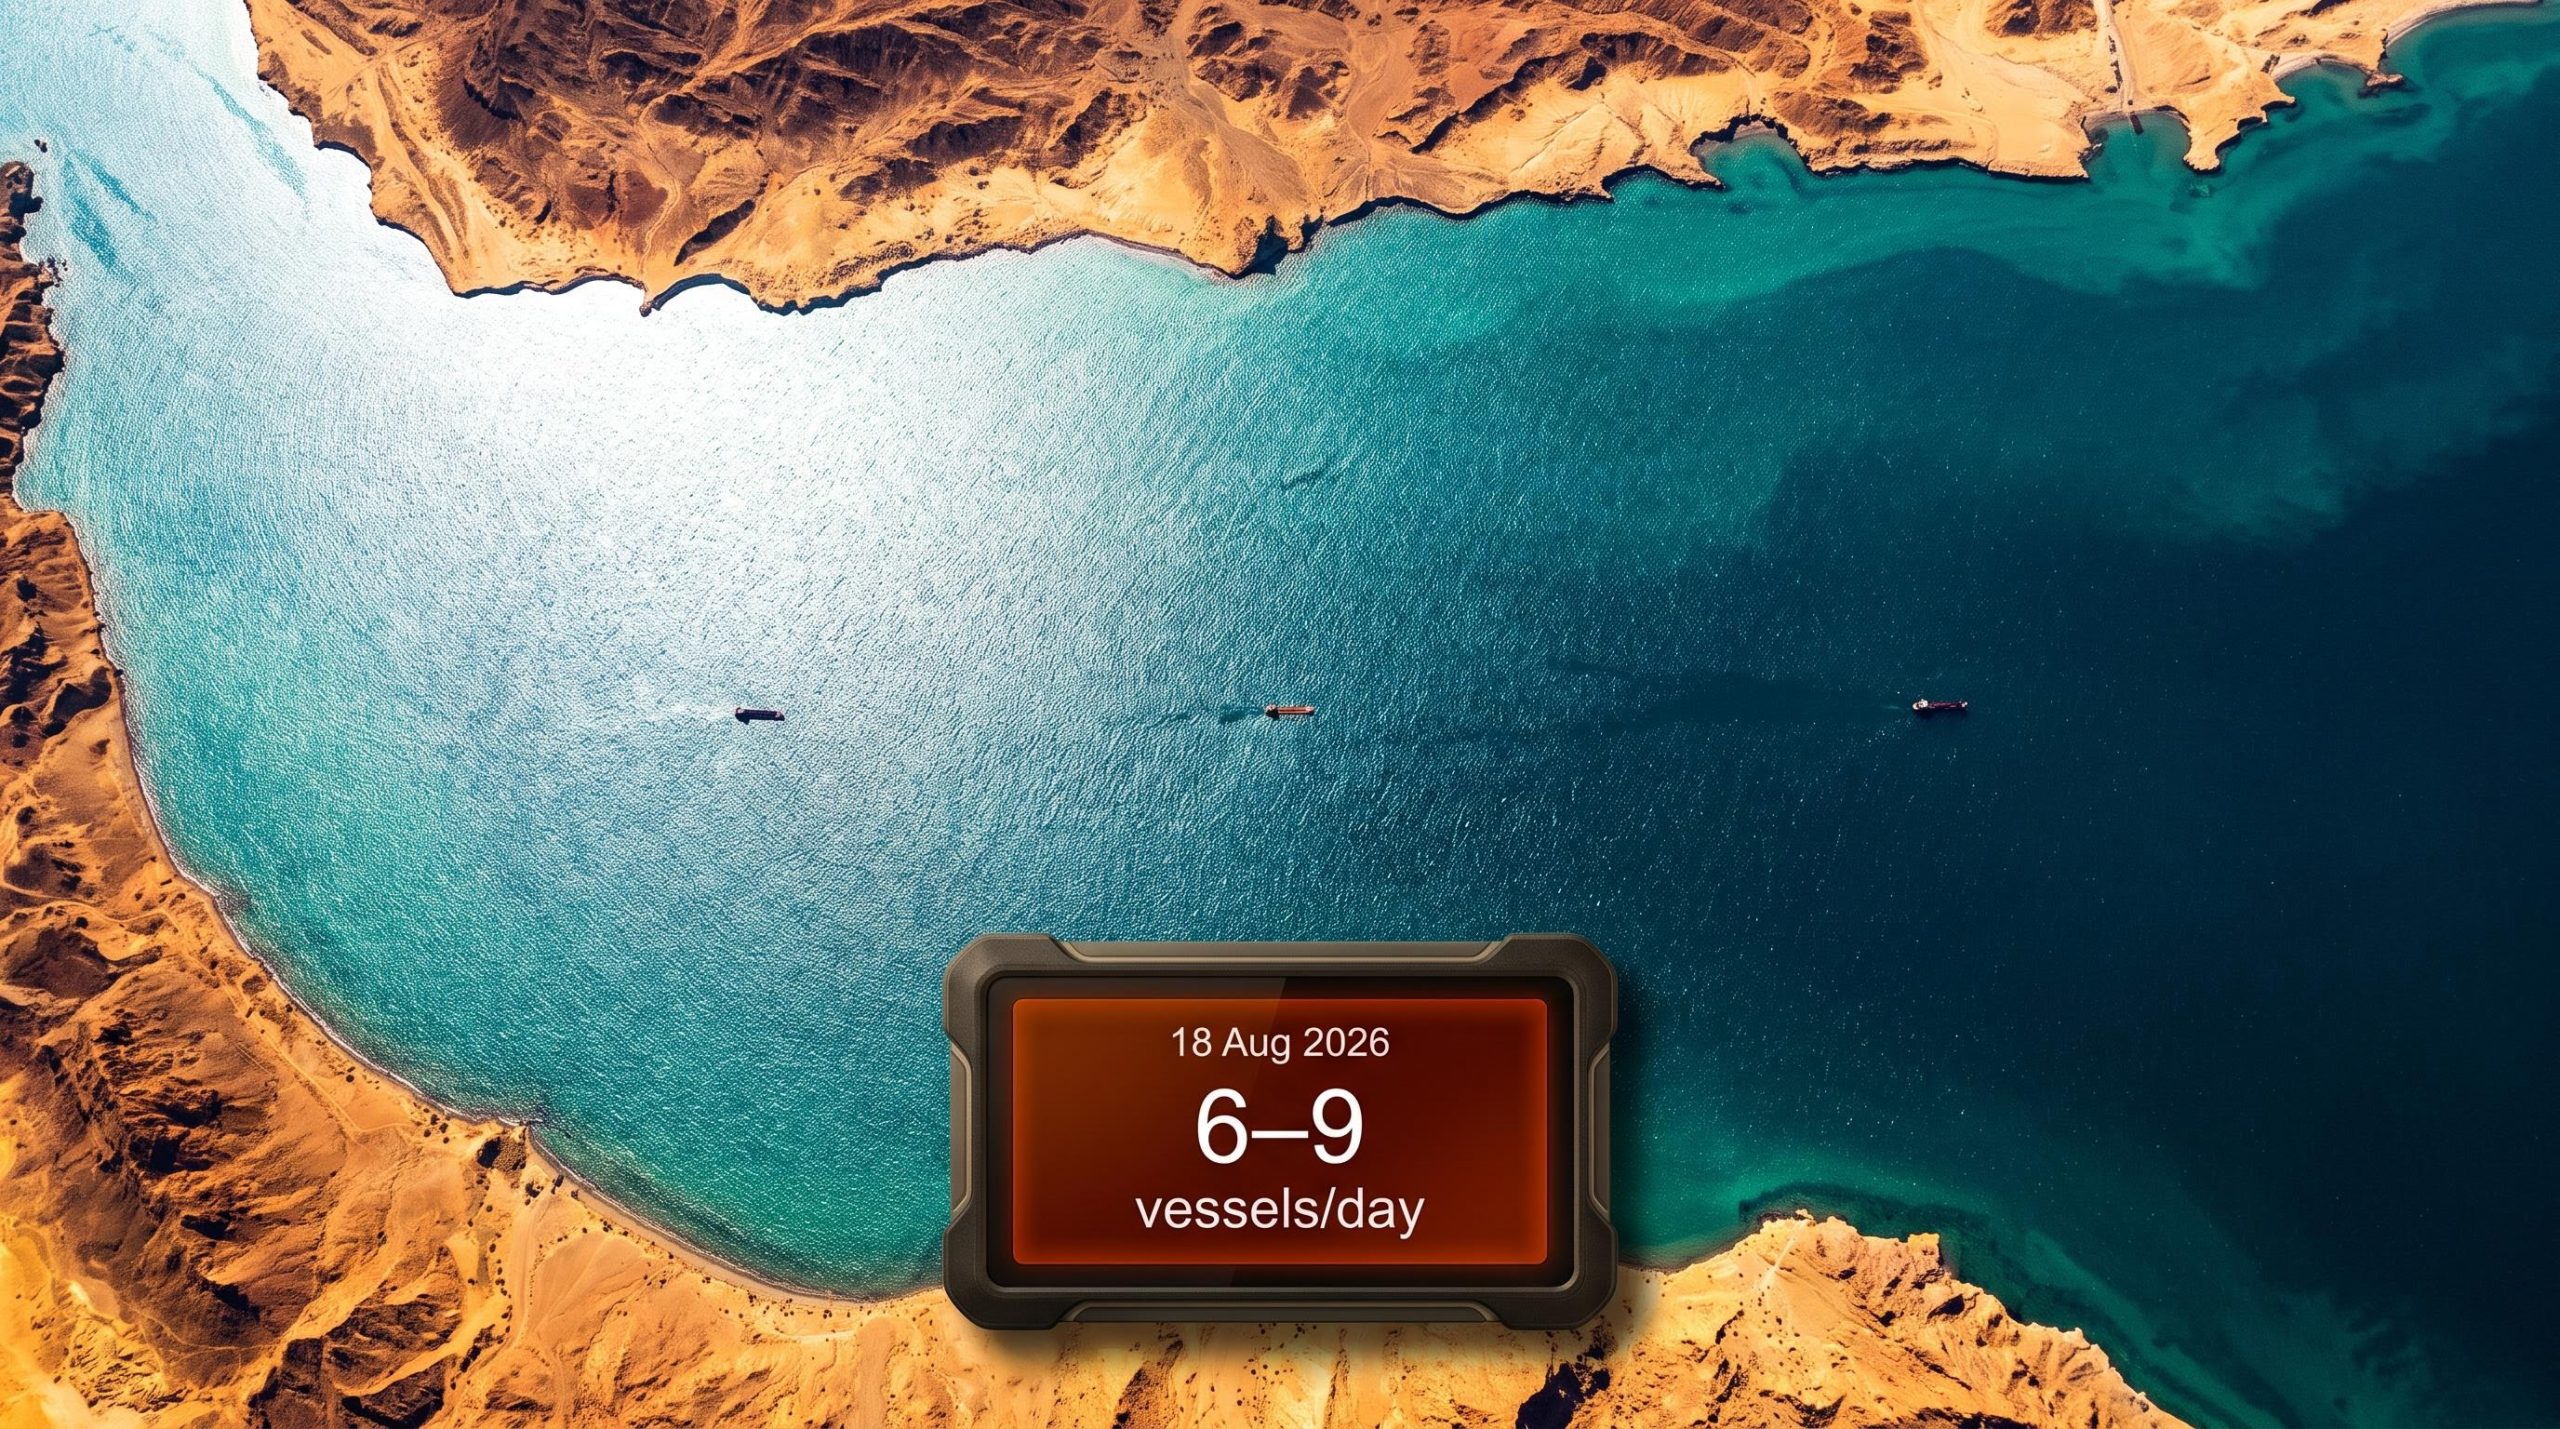
On 18 August 2026, the 60-day interim agreement between the United States and Iran expired without extension, leaving the Strait of Hormuz in a diplomatic vacuum and daily vessel crossings still registering in the single digits. That number matters: before the conflict, between 73 and 120 ships transited the strait every day.
The expiry has removed the last formal mechanism keeping Hormuz commercially navigable under agreed terms. With no active negotiations scheduled and the US naval blockade fully operational, the geopolitical risk premium baked into oil prices has gained durability rather than urgency. Wednesday saw WTI crude holding around $85.20 per barrel, a gain of close to 1% on the session, despite EIA figures revealing an unexpected crude stockpile increase of over four million barrels.
Here is what the transit data actually show, what the diplomatic vacuum means for the price trajectory, and how to read the tug-of-war between a bearish inventory signal and a geopolitical premium that shows no sign of unwinding. By the end, you will have a clear framework for interpreting each new development in this story as it unfolds.
A chokepoint in crisis: what the vessel data actually show
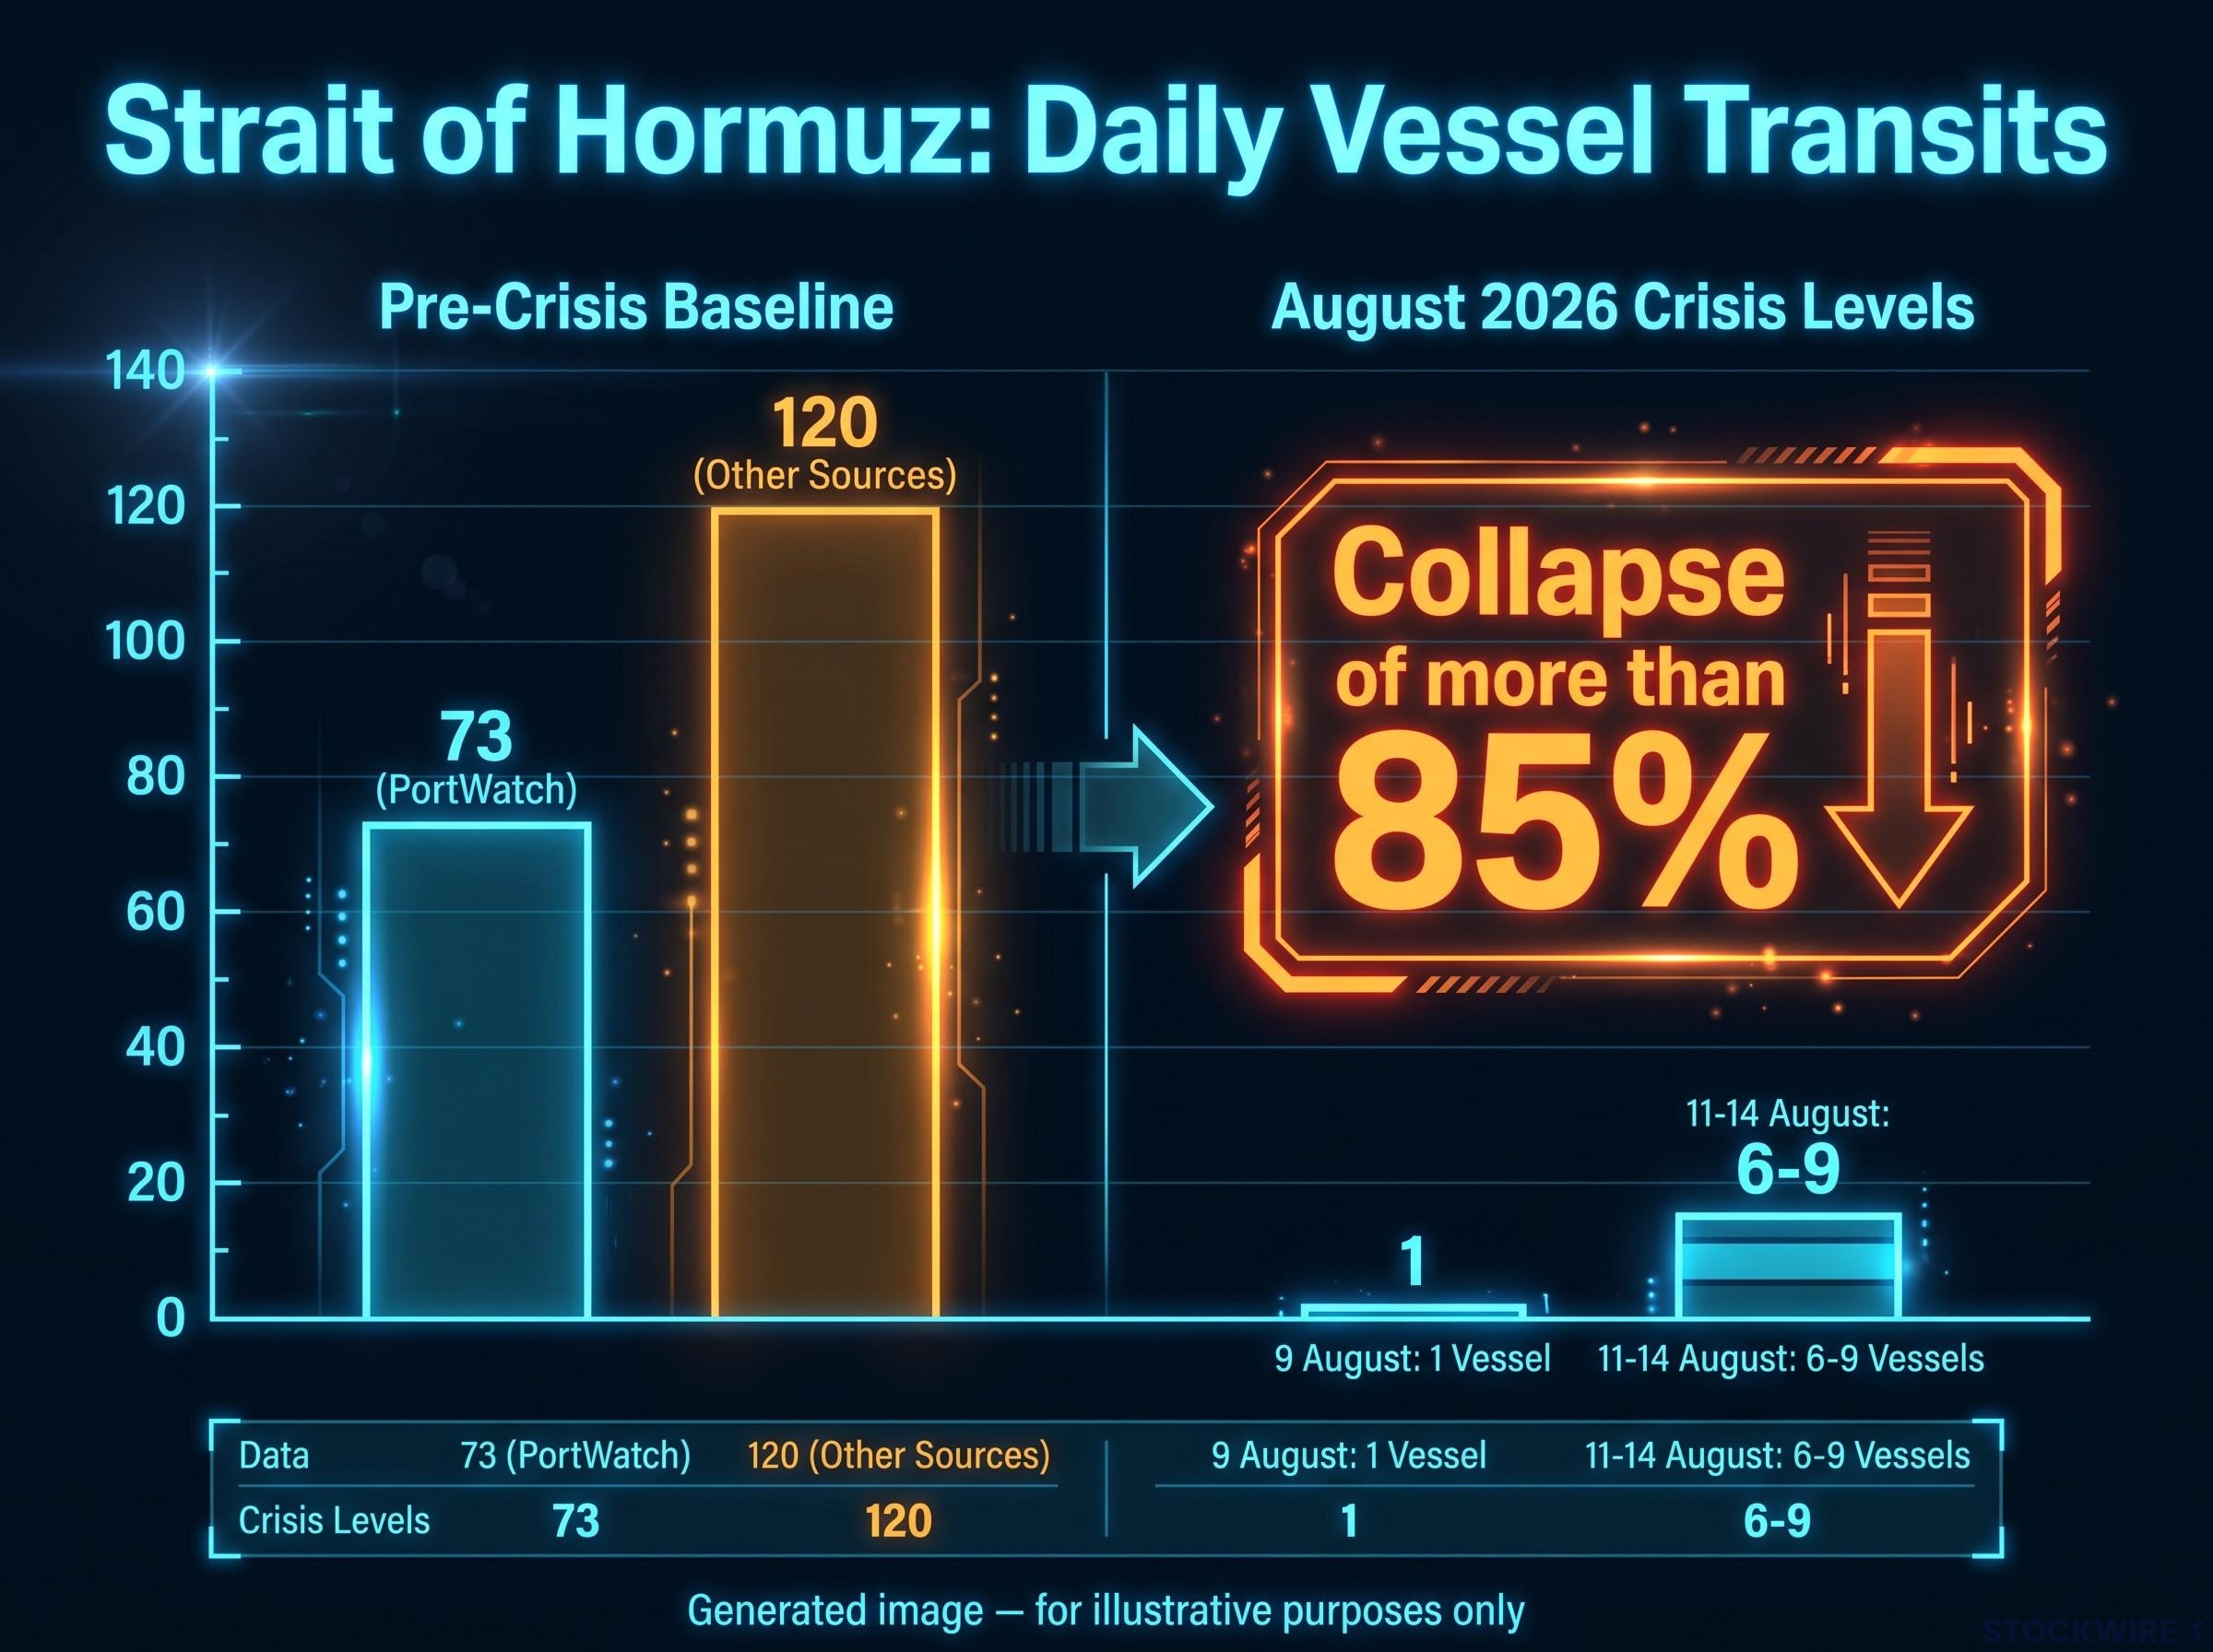
The numbers are stark. Kpler data recorded just six to nine vessels per day crossing the strait between 11 and 14 August. PortWatch logged a single transit on 9 August, against a pre-crisis baseline of approximately 73 daily crossings. Based on Kpler figures, the recent running average has been in the region of 11-12 vessels per day.
But those averages conceal wild day-to-day swings. On one Saturday, five commodity vessels made the crossing. The following Sunday, zero did, compared with 31 the prior weekend. That is not a measured reduction in throughput; it is a chokepoint flickering between constrained flow and near-total standstill.
The key data points come from three independent tracking sources:
- Kpler: Six to nine individual vessel crossings per day across 11-14 August; short-term average approximately 11-12 per day
- PortWatch: One transit on 9 August; pre-crisis baseline of approximately 73 vessels per day
- Lloyd’s List weekly aggregates: 84 transits from 27 July to 2 August; 78 transits from 3 to 9 August
| Time Period | Vessel Count / Range | Source |
|---|---|---|
| 11-14 August (daily) | 6-9 per day | Kpler |
| 9 August (single day low) | 1 | PortWatch |
| 27 July – 2 August (weekly) | 84 | Lloyd’s List |
| 3-9 August (weekly) | 78 | Lloyd’s List |
| Pre-crisis baseline | ~73 (PortWatch) / ~120 (other sources) | PortWatch / Original reporting |
A note on the baseline discrepancy: PortWatch’s pre-crisis figure of 73 daily transits differs from the approximately 120 reported by other sources, likely reflecting differences in vessel categories or measurement methodology. Either way, single-digit counts represent a collapse of more than 85% from normal.
The gap between Iran’s declared posture, that the waterway remains closed pending US compliance, and the operational reality, single-digit transits continuing sporadically, is the fact that shapes every price move and diplomatic signal that follows. Hormuz is not closed. It is not open. It is stressed to a degree that makes both descriptions misleading.
When big ASX news breaks, our subscribers know first
Why the Strait of Hormuz is the one chokepoint oil markets cannot ignore
Approximately one-fifth of all seaborne crude oil passes through the Strait of Hormuz.
That single statistic explains why a disruption here commands a risk premium that a supply shock almost anywhere else would not. The strait is roughly 33 kilometres wide at its narrowest point, with only two navigable shipping lanes. There is no comparable alternative. Rerouting options exist in theory, but they add weeks, cost, and capacity constraints that make them partial substitutes at best.
Bypass pipeline capacity through Saudi Arabia’s East-West Pipeline and the UAE’s Habshan-Fujairah pipeline combined delivers roughly 6-9 million barrels per day to alternative loading terminals, a meaningful near-term floor but still well short of Hormuz’s pre-crisis throughput of approximately 20 million barrels per day.
Who is most exposed
Chinese and Indian refiners illustrate the point. Both are actively seeking vessels willing to enter the strait and load discounted crude, even under current conditions. That behaviour tells you something important: the physical market is not pricing Hormuz as permanently closed. It is pricing it as open but dangerous, and major importers are willing to pay the elevated risk premium for access because the crude on the other side is being sold at a discount.
Understanding the structural irreplaceability of this waterway is the foundation for reading every price signal that follows. Without it, the geopolitical premium looks like sentiment noise. It is not. It is rational pricing for a supply route that has no real substitute.
The MOU that held Hormuz open, and what its expiry changes
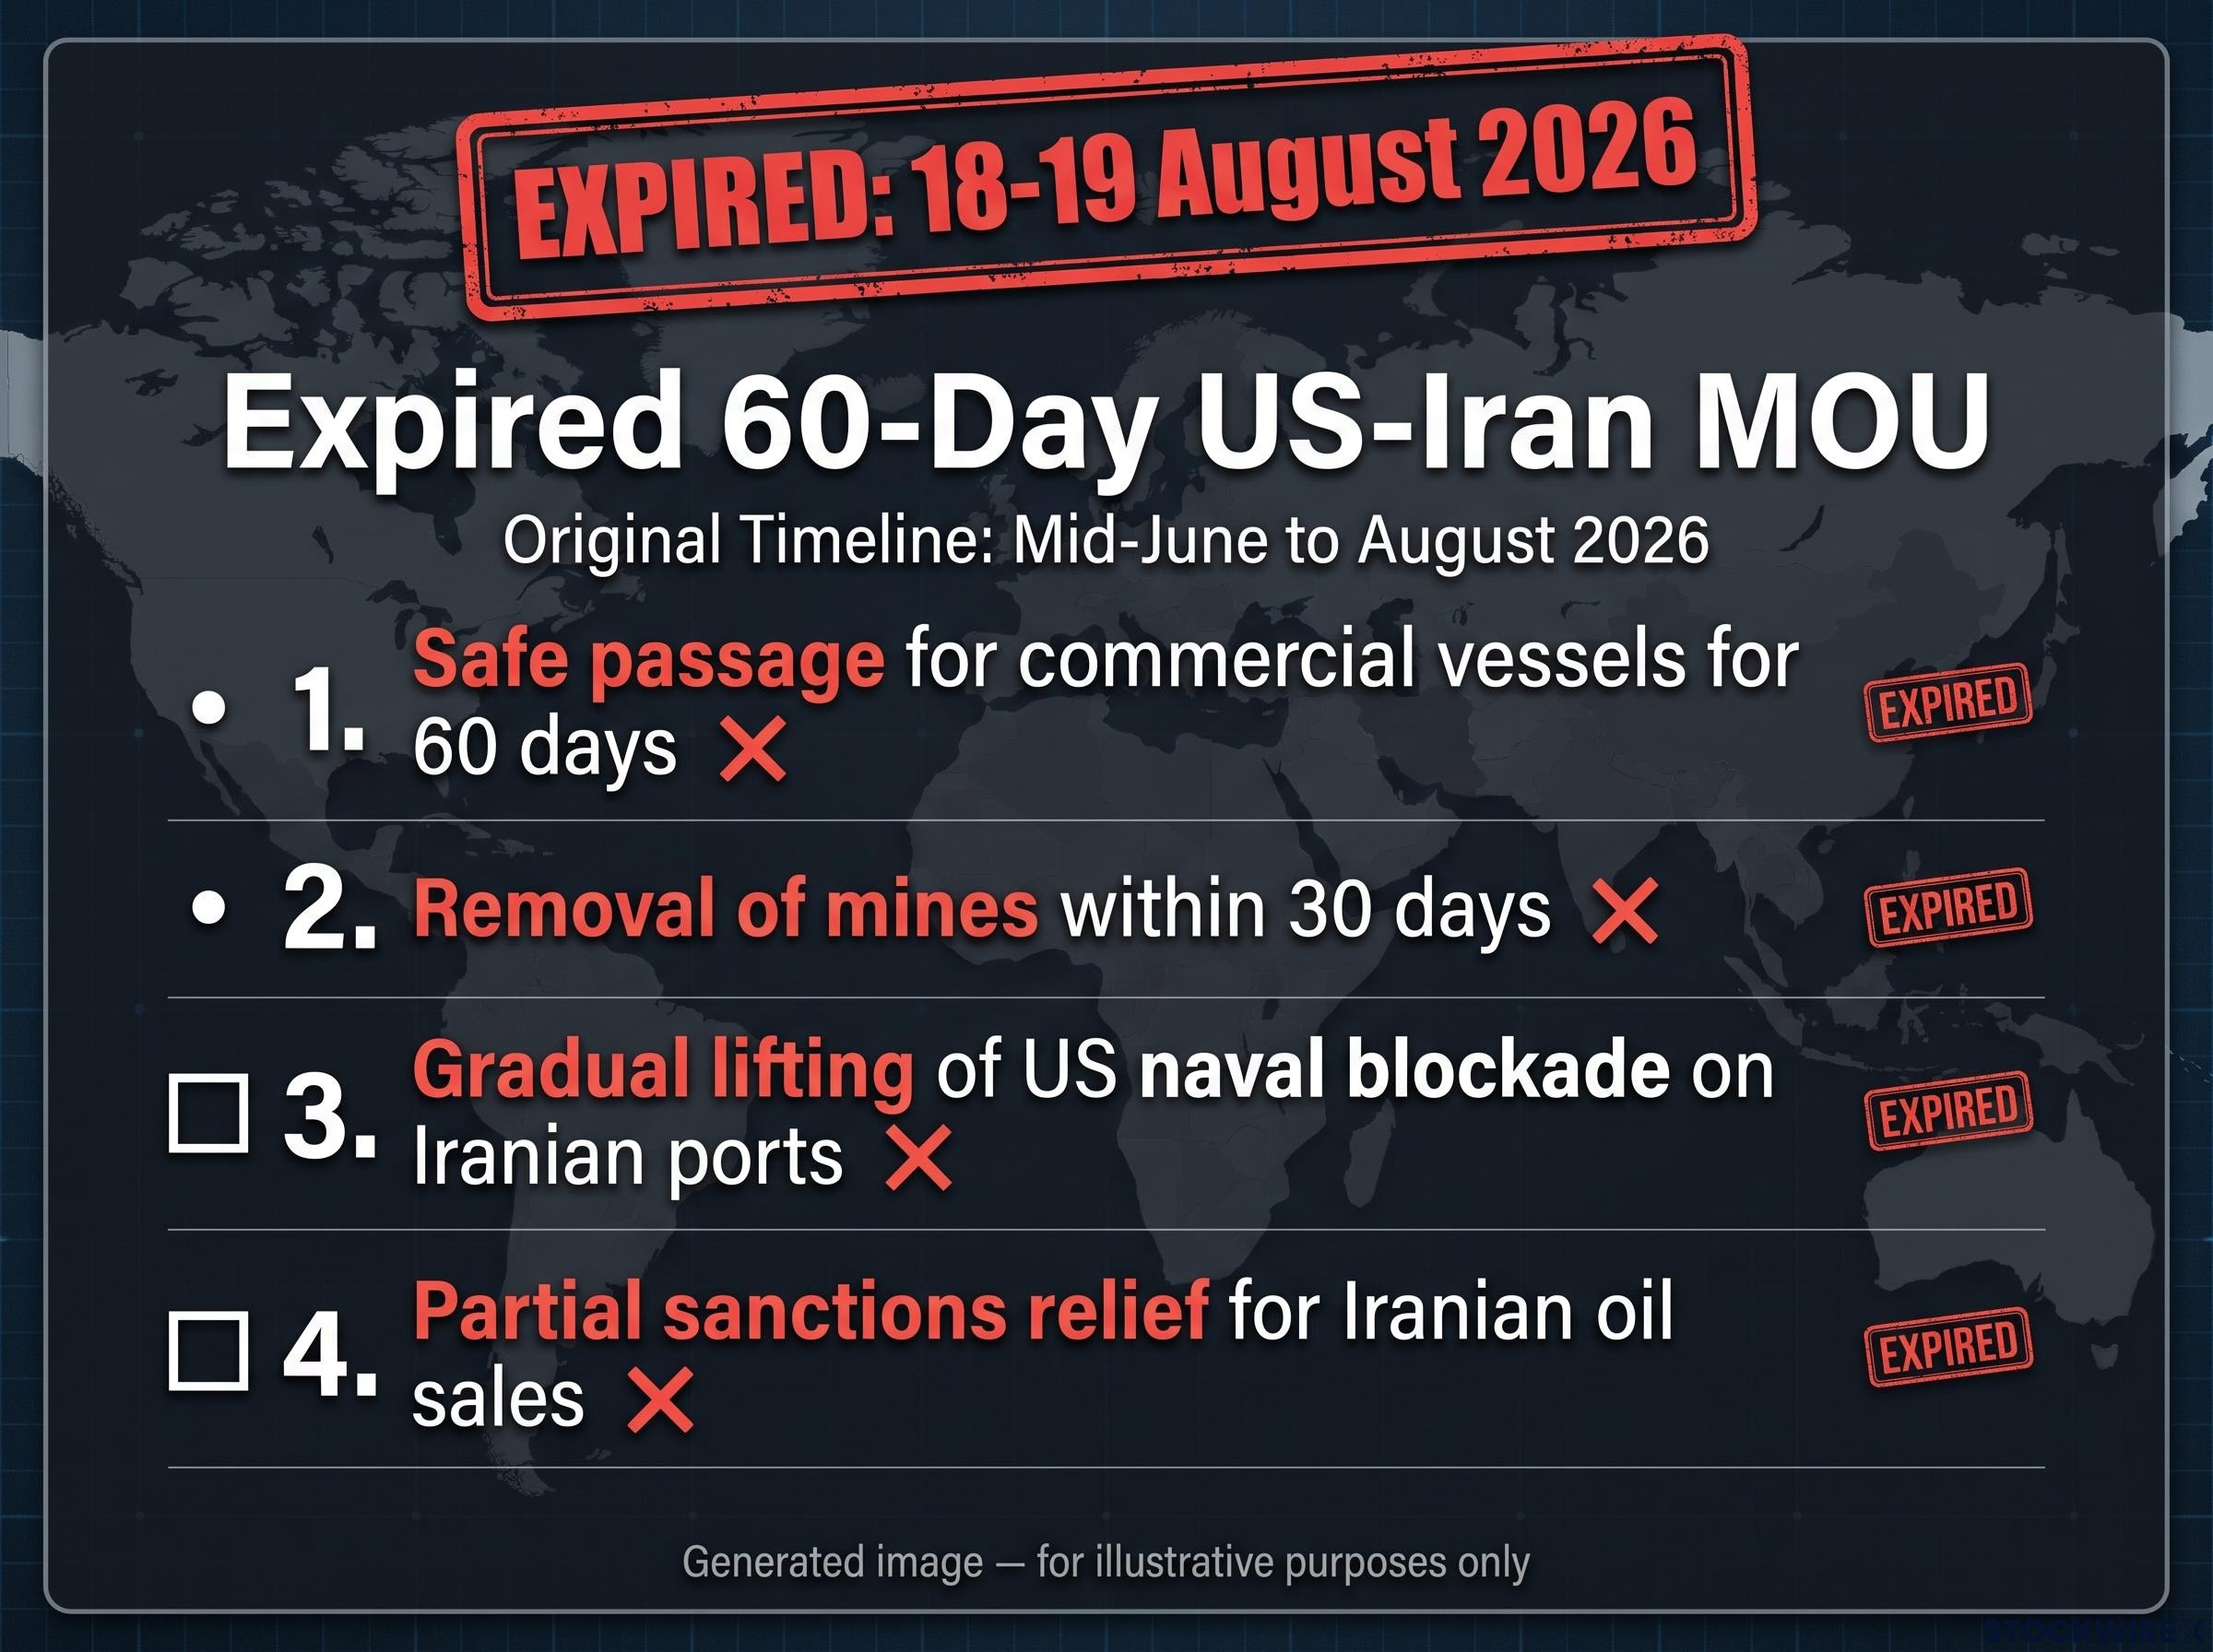
The 60-day memorandum of understanding (MOU), a formal interim agreement between the US and Iran, contained four structured commitments:
- Safe passage for commercial vessels through the strait for 60 days
- Removal of mines within 30 days
- Gradual lifting of the US naval blockade on Iranian ports
- Partial sanctions relief allowing Iran to increase oil sales
The agreement ran from mid-June through 18-19 August 2026. It was designed as a bridge to a final deal, with extension possible only by mutual agreement. No extension came.
The diplomatic state that replaced it is blunt. Via a Truth Social post on Tuesday, President Trump stated that no talks or conversations with Iran were taking place or planned, and that the US naval blockade continues in full force.
Trump’s public statement: no negotiations ongoing or scheduled. Naval blockade fully operational.
Bilateral diplomacy between Iran and Oman on shared management of the strait has so far failed to generate any tangible steps toward reopening it. Trump subsequently told reporters that negotiations “could potentially occur at some future point,” a statement designed to preserve ambiguity without offering the market any timeline.
For anyone tracking this through price action, the expiry marks a regime change. The market’s geopolitical premium has shifted from “temporary disruption with a framework” to “open-ended standoff without a mechanism.” That distinction matters because it alters how long the premium should be expected to persist.
WTI at $85 despite a four-million-barrel inventory build: reading the tug-of-war
The bearish signal is real and large. According to the EIA, US crude stockpiles rose by 4.405 million barrels in the week to 14 August, a significant departure from the market consensus, which had pointed to a drawdown of roughly 0.6 million barrels. That is a miss of more than five million barrels in the wrong direction. US crude holdings have now risen for three weeks running.
EIA inventory build: +4.405 million barrels. Consensus forecast: -0.6 million barrels.
WTI rose anyway. Wednesday’s session saw the benchmark trade near $85.20 per barrel, approximately 1% higher on the day, a move that appears puzzling at first glance.
It is not, once you understand the mechanism. A geopolitical risk premium reflects the expected cost of future supply disruption, not the current inventory balance. When a chokepoint carrying one-fifth of global seaborne crude is operating at single-digit daily transits with no diplomatic resolution in sight, futures markets price the risk of what happens if those transits fall to zero, not what happened last week in Cushing, Oklahoma.
The geopolitical risk premium embedded in crude prices is not expected to snap back to pre-crisis levels even under a best-case resolution; the IEA projects a two-year supply chain recovery timeline, a structural persistence that explains why professional traders continue pricing Hormuz disruption risk even as weekly inventory data suggest adequate near-term domestic supply.
The inventory build tells you domestic supply is not tight today. The price action tells you professional traders are pricing for a scenario in which it becomes tight if Hormuz deteriorates further. Those are two different but simultaneously correct readings of the market. Treating one as proof the other is wrong is the analytical error this environment punishes most.
How daily transit counts became a real-time market signal
Vessel-tracking data have moved from a logistics metric to a front-line market indicator. Kpler and PortWatch daily transit figures are now being tracked by traders and refiners alongside traditional inventory and price data as real-time measures of physical tightness through Hormuz.
The primary tracking sources measure different things:
- Kpler: Individual vessel crossings, updated daily
- PortWatch: Aggregate daily transit counts with historical baselines
- Lloyd’s List: Weekly aggregate summaries for trend analysis
One Saturday: 5 commodity vessels crossed. The following Sunday: zero. The prior weekend: 31.
That kind of day-to-day volatility translates directly into intraday price sensitivity. A near-zero reading on a single day can move crude benchmarks before inventory data arrives days later.
Chinese and Indian refiners seeking vessels to enter the strait at discounted crude prices are themselves a market signal. Their behaviour implicitly treats Hormuz as open but risky, a commercial judgment that provides a floor under transit expectations even as the political posture from Tehran describes the waterway as closed. If daily transit counts fall from single digits toward zero on a sustained basis, that is the signal that the market’s theoretical risk premium is converting to an actual supply shortfall. That data series is the leading indicator to watch above all others.
What the diplomatic vacuum means for the premium going forward
Three variables will determine whether the geopolitical premium compresses or expands from here:
- US-Iran re-engagement signals: Any indication of resumed talks, whether direct or through intermediaries, would be the most powerful compression catalyst. None are scheduled.
- Daily transit count trajectory: A sustained move below the current 11-12 vessel average, particularly toward zero, would signal deterioration. A recovery toward double digits would suggest stabilisation.
- Iran-Oman channel outcomes: The back-channel remains active but inconclusive. Any concrete agreement on joint administration of the strait would change the risk calculus materially.
The shift from a time-bound MOU framework to an open-ended standoff means the premium should be treated as structurally embedded rather than transient until one of those three variables changes materially.
Two analytical errors are most likely in this environment. The first is treating the strait as fully closed, which overstates supply risk and ignores the continuing trickle of transits. The second is treating that trickle as evidence of normalisation, which understates the risk of a deterioration that could take daily crossings to zero. Both errors lead to mispriced positions.
For investors wanting to model how WTI and Brent could move across different resolution outcomes, our dedicated guide to Brent price scenarios maps three specific price trajectories and identifies the sanctions escalation variables most likely to determine which path crude follows from current levels.
The market’s next directional move on Hormuz news will almost certainly be driven by one of these three variables before it shows up in inventory data. Readers tracking price action need to be watching diplomacy and transit counts, not just the weekly EIA release.
Treating Hormuz as a stressed chokepoint, not a binary switch
Three data points capture the current market regime and each reinforces the others: a WTI price near $85.20 per barrel, a weekly US crude inventory gain of 4.405 million barrels, and a strait running at a daily transit average of just 11-12 vessels, a fraction of normal throughput. The MOU’s lapse on 18 August transformed what had been a time-limited disruption into an open-ended standoff, stretching the expected duration of the risk premium from a matter of weeks to an uncertain horizon.
The accurate framework: a stressed chokepoint with constrained capacity and uncertain diplomatic prospects.
The reader who leaves with a binary mental model, open or closed, will be wrong regardless of which pole they choose. Hormuz is neither. It is a volatile, heavily constrained waterway operating at a fraction of normal capacity, with no resolution mechanism in place and no timeline for one to appear.
For readers wanting the full context of how this disruption began and how fast markets moved in its early stages, our full explainer on the Hormuz-driven oil surge covers the 57% Brent price move from February to May 2026, the EIA supply-shock modelling, and the bypass infrastructure constraints that made the price response so sharp.
Monitor transit data and diplomatic signals as leading indicators. Treat the geopolitical premium as structurally embedded until a re-engagement mechanism materialises. Do not price Hormuz as a resolved story until daily transits return to a consistent baseline well above single digits. Precision in how you characterise this crisis directly determines whether your risk expectations are calibrated correctly during the period when mispricing is most costly.
This article is for informational purposes only and should not be considered financial advice. Investors should conduct their own research and consult with financial professionals before making investment decisions. These statements regarding future price movements and diplomatic outcomes are speculative and subject to change based on market developments and geopolitical conditions.