
Brent Surges 5.5% as Iran Attacks Hormuz Shipping and Waiver Falls
2 hrs ago

Brent crude has surged from approximately $70 per barrel in late February 2026 to above $110 per barrel as of 18 May 2026, a rise of roughly 57% in under three months. The driver is singular: the Strait of Hormuz, the world’s most consequential oil chokepoint, has been largely closed to tanker traffic since the onset of military conflict in the Middle East. The U.S. Energy Information Administration (EIA) now models Gulf production shut-ins at nearly 10.8 million barrels per day for May 2026, a supply withdrawal without modern precedent. What follows is an analysis of the mechanics behind the oil price surge, the structural reasons the Strait of Hormuz commands such leverage, the scale of the supply disruption, and what EIA and J.P. Morgan forecasts indicate about how long elevated prices may persist.
The price movement traces a direct causal chain from a specific sequence of geopolitical events to market outcome, not a gradual repricing of risk.
Brent crude rose approximately 57% from late February to 18 May 2026, closing at $110.05 on 18 May, with WTI at $101.97.
Brent added approximately 0.72% on 18 May alone, and WTI gained roughly 0.94%, confirming the rally remains live. The price is not a residual of past panic. It reflects an ongoing, unresolved supply disruption where each escalation reinforces the premium rather than fading it.
The scale of the price response becomes less surprising once the structural role of the Strait of Hormuz is understood. Under normal conditions, approximately one-fifth of global oil supply transits this single waterway, connecting Gulf producers including Saudi Arabia, Iraq, Kuwait, the UAE, Qatar, and Bahrain to export markets in Asia, Europe, and beyond.
No alternative route exists at comparable scale. The Strait is not one corridor among several; it is the corridor. When it closes, the supply it carries does not reroute. It disappears.
The EIA’s 12 May 2026 STEO states explicitly that the Strait was “effectively closed to most shipping traffic” following the onset of military action. It further warns that if reduced vessel volume persists, oil storage behind the chokepoint will fill and force producers to shut in even more production, creating a self-reinforcing squeeze where the disruption compounds itself over time.
The closure is not a binary on-off switch. Even partial restrictions are sufficient to suppress transits far below normal volumes because of the practical constraints tanker operators face:
The closure is not governed by a single mechanism: the Hormuz triple lock compounds U.S. naval blockade operations, Iranian toll enforcement on non-U.S. and non-Israeli vessels, and the near-total withdrawal of commercial war-risk insurance, with each layer independently sufficient to suppress tanker transits even if the others were removed.
The result is an operational closure that functions as a near-total one, regardless of whether every lane is physically blocked.
The EIA’s conflict-scenario modelling provides the best available quantitative estimate of the supply withdrawal, and the numbers carry their own weight.
According to the 12 May 2026 STEO, Gulf production shut-ins across six countries averaged 10.5 million barrels per day (mb/d) in April 2026 and are expected to peak at nearly 10.8 mb/d in May 2026. For context, total U.S. crude oil production runs at approximately 13 mb/d. The Hormuz-linked shut-in is equivalent to removing roughly 80% of America’s entire oil output from global markets.
| Country | Conflict-Scenario Status (EIA STEO, 12 May 2026) | Role in Shut-In |
|---|---|---|
| Saudi Arabia | Production shut in; Hormuz-dependent exports blocked | Largest single contributor to withheld volumes |
| Iraq | Production shut in; southern export terminals inaccessible | Second-largest contributor |
| Kuwait | Production shut in | Fully Hormuz-dependent exports |
| UAE | Production shut in; direct conflict exposure | Significant contributor; also facing infrastructure risk |
| Qatar | Production shut in | Gas and condensate volumes also affected |
| Bahrain | Production shut in | Smaller but fully Hormuz-dependent |
These are modelled conflict-scenario estimates, not independently confirmed operational data. The EIA has been transparent about this distinction. They remain, however, the most authoritative quantitative framework available.
Emergency reserve releases totalling approximately 280 million barrels from SPR and IEA stocks have failed to halt inventory drawdowns, which are running at roughly 8.5 million barrels per day in Q2 2026, more than double any previously recorded pace, confirming that strategic petroleum reserves were sized for demand shocks, not a near-simultaneous withdrawal of a fifth of global seaborne supply.
The EIA warns that if storage behind the chokepoint fills, producers will be forced to shut in even more production beyond currently modelled levels, deepening the supply deficit further.
The Strait of Hormuz is a narrow waterway approximately 33 kilometres wide at its narrowest navigable point, flanked by Iran on its northern shore and Oman and the UAE to the south. Under pre-conflict conditions, approximately 21 million barrels per day transited the Strait, according to EIA historical data, making it the single most concentrated bottleneck in global energy trade.
This disruption is qualitatively different from a managed OPEC production cut. When OPEC reduces output, the cut is voluntary, coordinated, and has known parameters: a specific volume, a timeline, and a mechanism for reversal. The Hormuz closure is forced, uncontrolled, and open-ended. There is no coordination mechanism governing how or when the supply returns. The duration depends entirely on the conflict’s trajectory, a variable no producer or institution controls.
The EIA’s current assumption is that the Hormuz closure persists through late May 2026, with shipping traffic beginning to pick up in June 2026, though not returning to pre-conflict levels until later in the year.
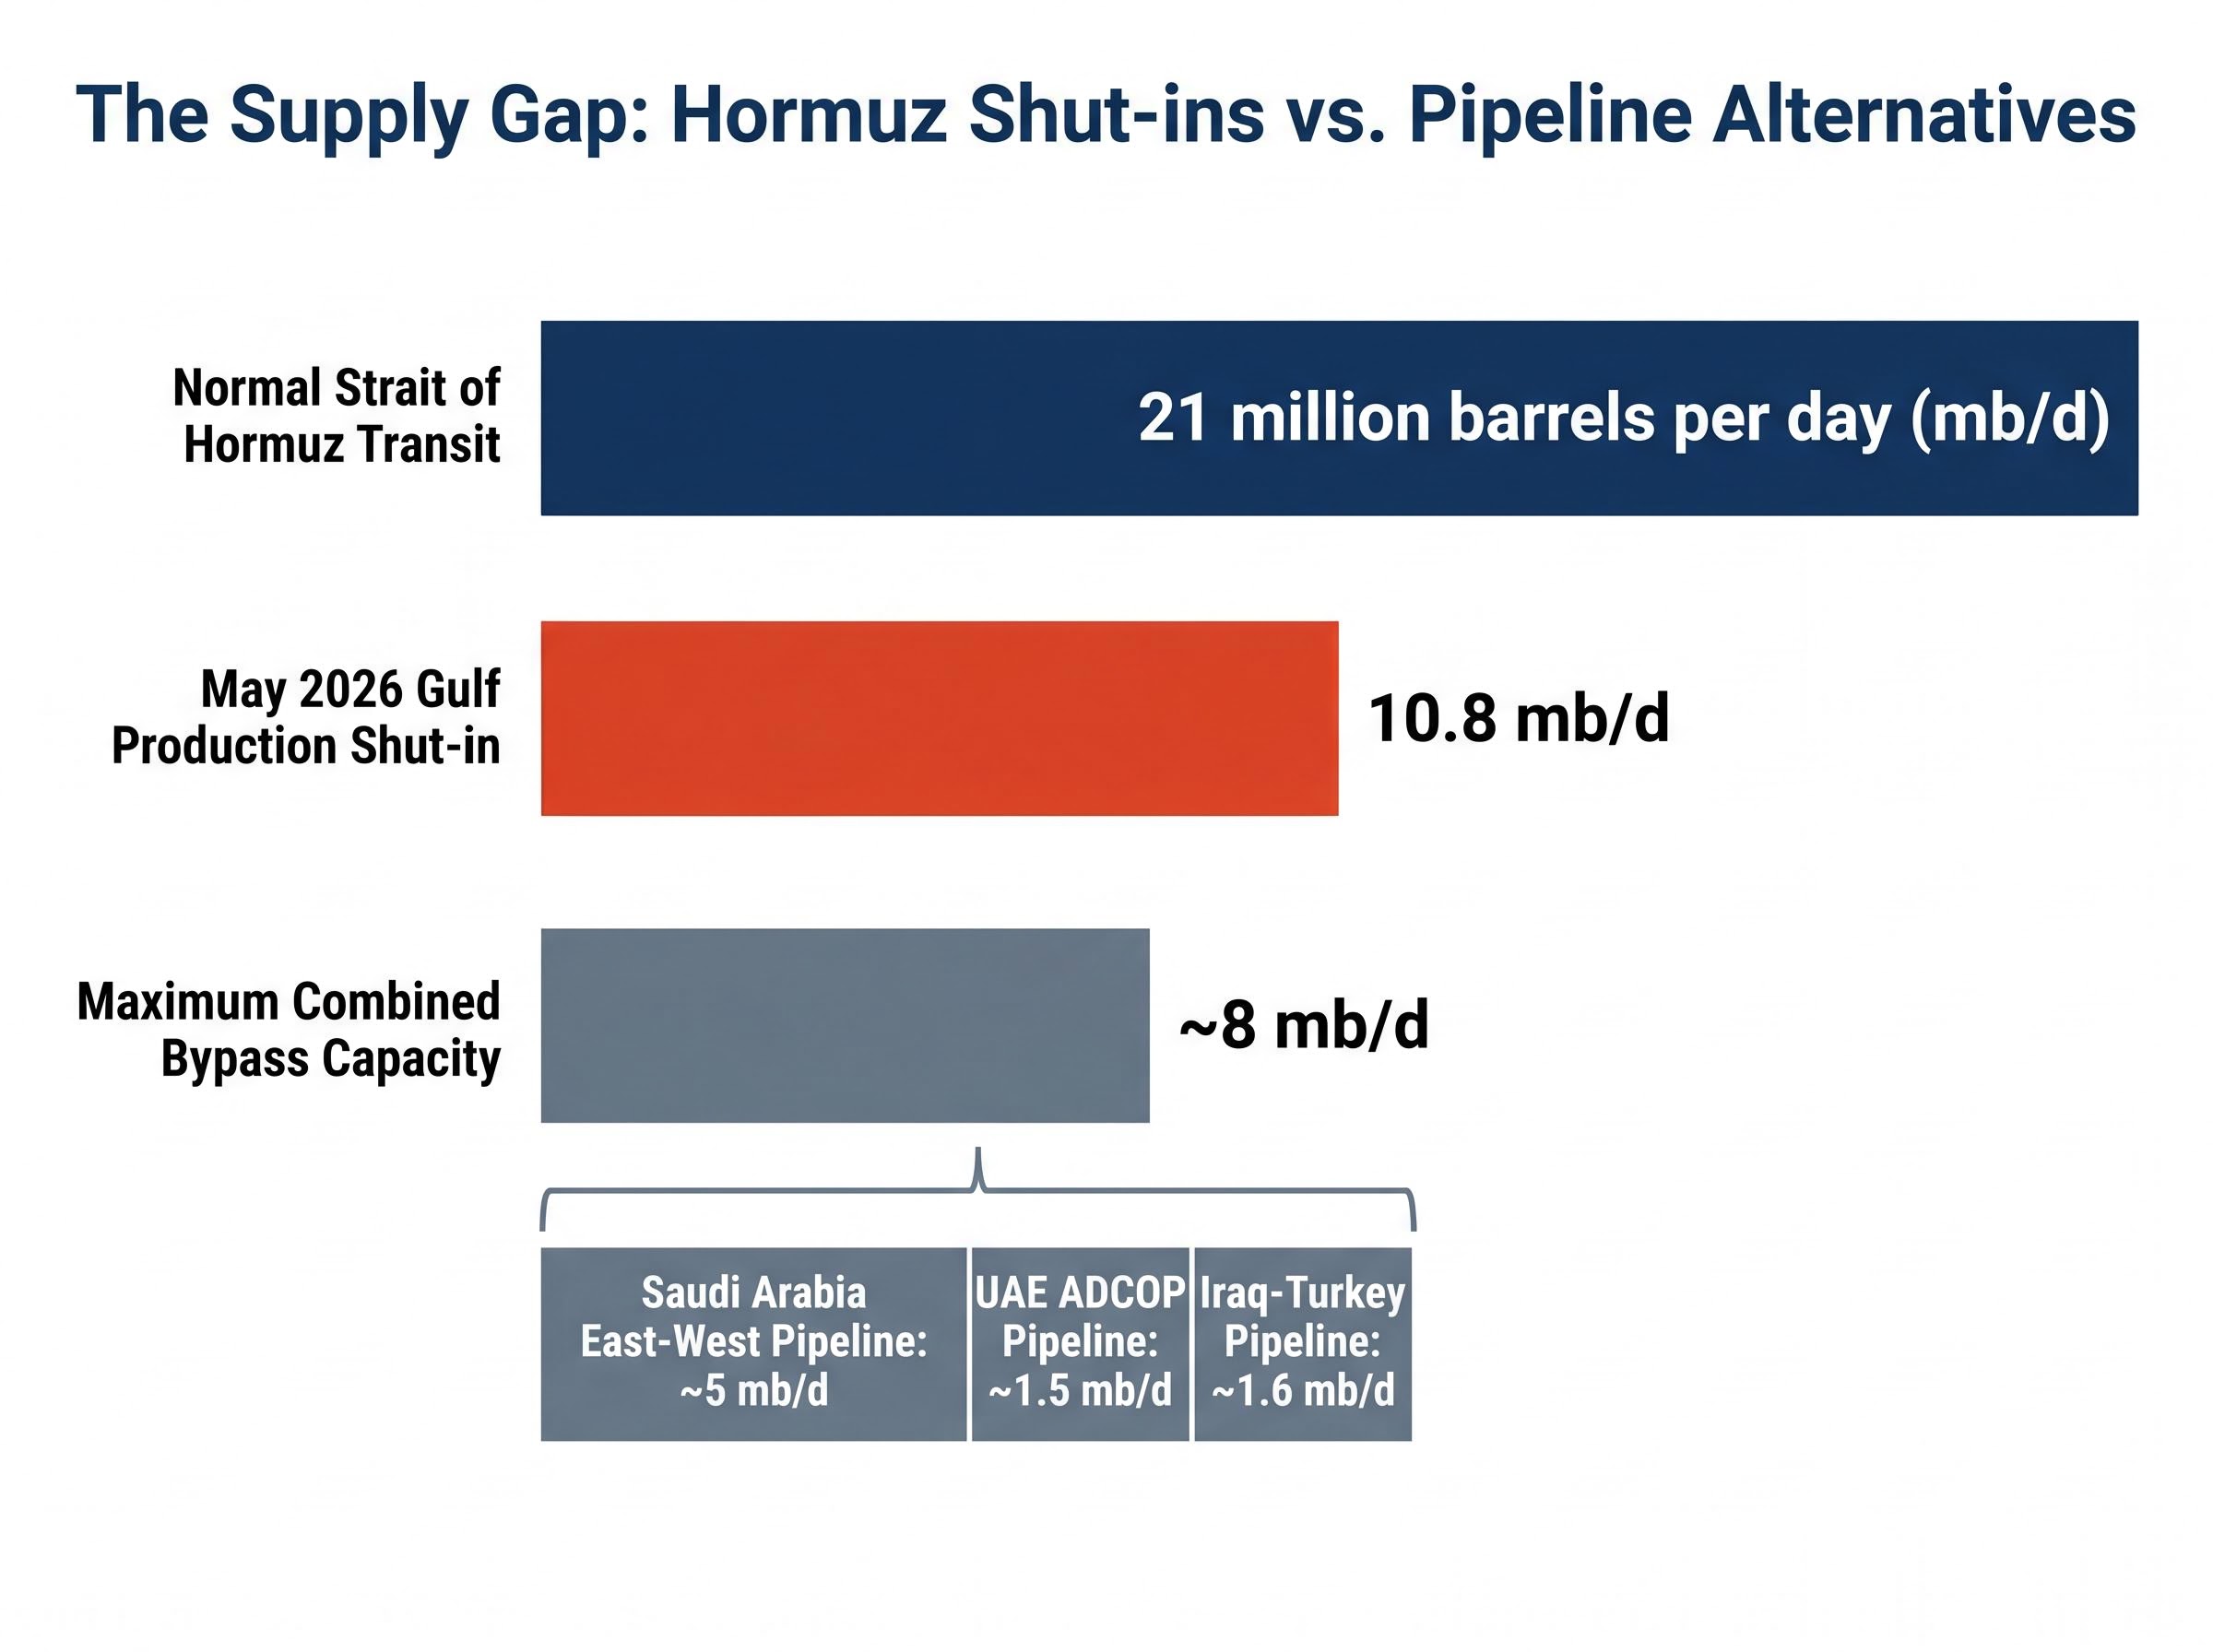
Several pipeline alternatives exist on paper, but none approach the scale required:
Even if all three pipelines operated at maximum rated capacity simultaneously, their combined throughput would cover roughly 8 mb/d at best, well short of the 10.8 mb/d being shut in and far below the 21 mb/d that normally transits the Strait. The gap cannot be closed by existing infrastructure.
Two forecast frameworks currently define the price outlook, and they are measuring different things.
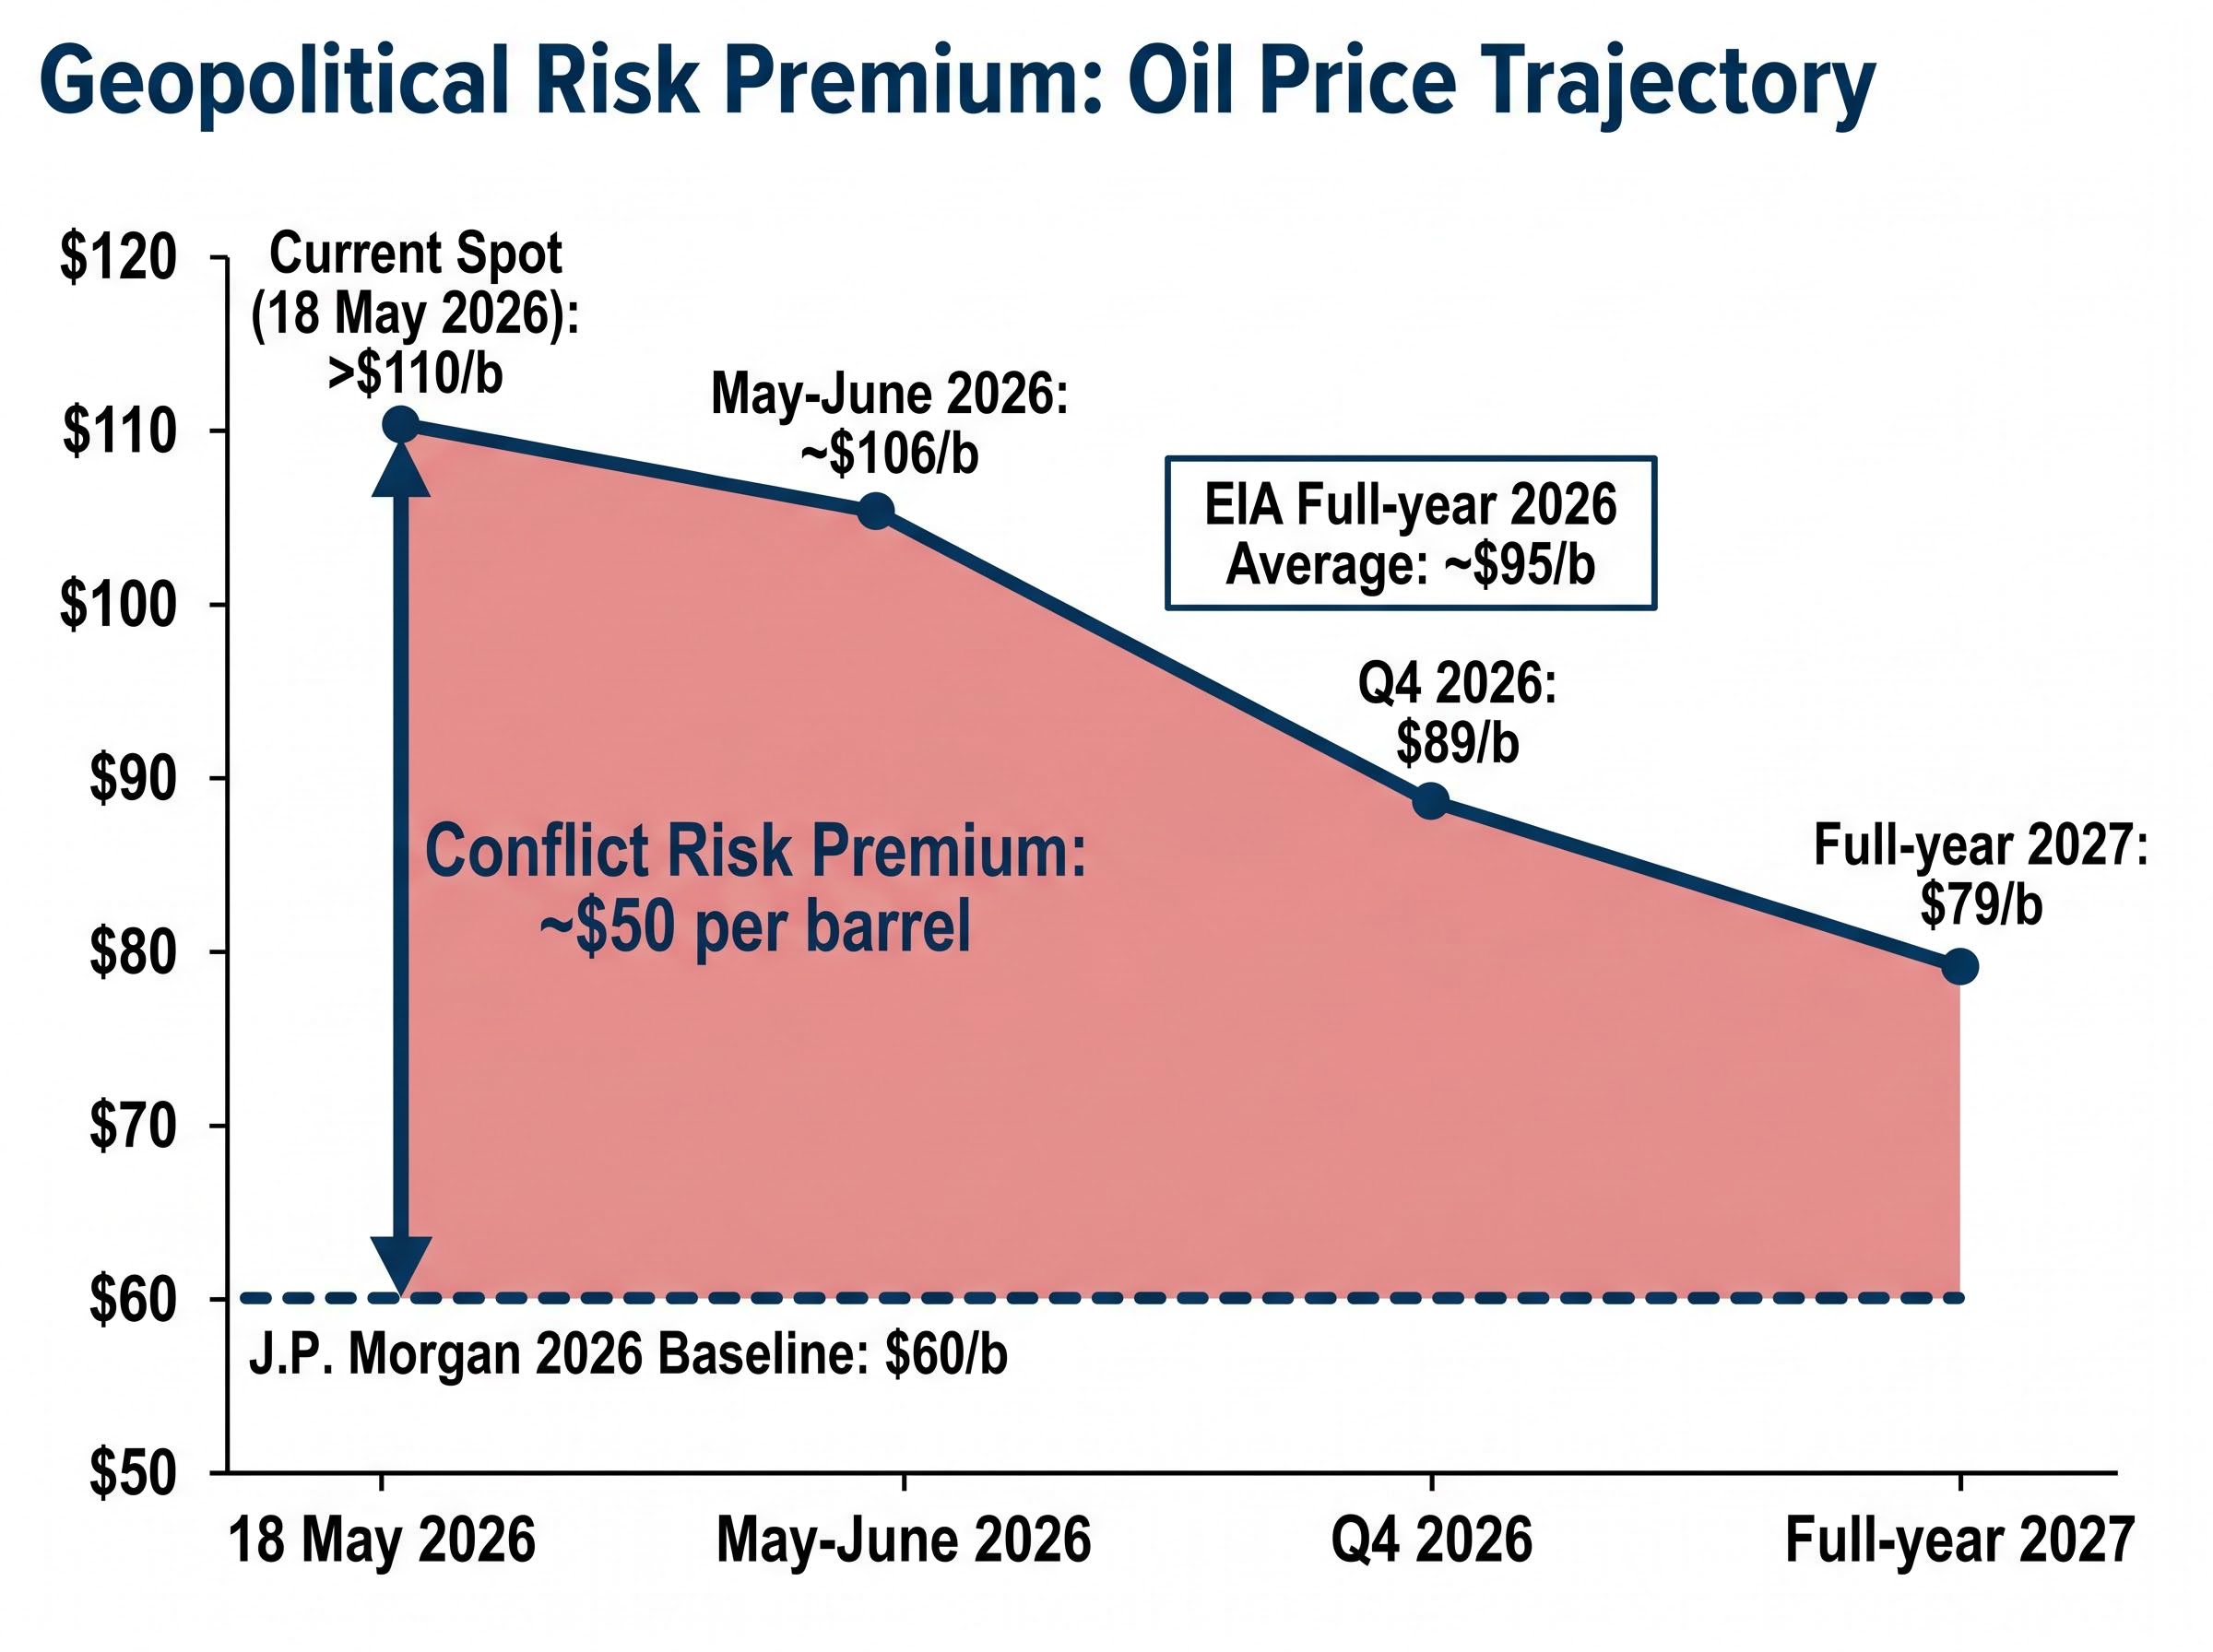
The EIA’s conflict-scenario price path, published in the 12 May 2026 STEO, projects a gradual decline from current levels as the disruption unwinds:
| Time Period | EIA Conflict-Scenario Brent Forecast | Context |
|---|---|---|
| May-June 2026 | ~$106/b | Peak disruption period; Hormuz assumed closed |
| Q4 2026 | $89/b | Assumes shipping traffic recovery underway |
| Full-year 2026 average | ~$95/b | Blended across disruption and partial recovery |
| Full-year 2027 | $79/b | Assumes sustained de-escalation and production recovery |
J.P. Morgan Global Research, by contrast, maintains a pre-disruption baseline of approximately $60 per barrel for 2026 under non-disruption conditions. This is not a competing conflict forecast. It represents the structural view of where oil prices sit when geopolitical risk is removed from the equation.
The gap between J.P. Morgan’s $60 baseline and the current spot price above $110 is the conflict risk premium, roughly $50 per barrel of pure disruption pricing embedded in live markets.
The EIA explicitly caveats that its price forecast is “highly dependent on our assumptions of both the duration of conflict in the Middle East and resulting outages in oil production.”
J.P. Morgan’s characterisation reinforces this conditionality: the firm has stated that “brief, geopolitically driven crude rallies are likely to continue, but these should eventually subside, leaving soft underlying global market fundamentals.” The question is not whether the premium fades, but when.
Investors wanting to stress-test the EIA and J.P. Morgan projections against the full range of institutional views will find our full explainer on Hormuz oil price forecasts, which maps Goldman Sachs, Barclays, and Bank of America scenarios through 2027 across reopening timelines and includes the tanker transit collapse data that anchors the upper-bound projections.
The $110-per-barrel Brent price as of 18 May 2026 is not an abstraction. It carries concrete exposure for three distinct groups:
Sustained energy price elevation feeds directly into headline consumer price index measures, creating pressure on central banks to maintain or tighten monetary policy even as growth concerns from the conflict itself build simultaneously.
ING analysts described the global bond sell-off on 18 May as the “dominant story” in financial markets, with energy-price inflation concern identified as the primary driver. The cross-asset spillover illustrates that the Hormuz closure is no longer confined to commodity markets; it is shaping rate expectations and fixed-income positioning globally.
The Fed rate path has narrowed sharply under the oil shock, with CME FedWatch data showing the probability of a June rate cut collapsing from 45% to just 12% while the 2-year Treasury yield rose 22 basis points to 4.65% in a single session, translating the commodity disruption directly into the interest rate environment that governs equity valuations and mortgage costs.
The oil price surge from $70 to $110 is the direct, quantifiable consequence of a forced chokepoint closure removing nearly 11 million barrels per day from global supply. It is not speculative froth. It is supply-side arithmetic.
The uncertainty runs in both directions. The EIA’s $89/b Q4 2026 forecast implies meaningful price relief if de-escalation proceeds on the assumed schedule and shipping traffic resumes through the Strait. The conflict’s trajectory, however, remains the dominant variable, and the weekend’s drone strikes on UAE and Saudi targets suggest that schedule is far from guaranteed.
Whether monitoring fuel costs, managing energy exposure in a portfolio, or tracking the monetary policy implications of sustained crude elevation, the operational status of the Strait of Hormuz is the single data point that matters most for the near-term price outlook. Until tanker traffic resumes at scale, the premium holds.
This article is for informational purposes only and should not be considered financial advice. Investors should conduct their own research and consult with financial professionals before making investment decisions. The EIA forecasts cited are modelled conflict-scenario estimates, not confirmed operational data. Past performance does not guarantee future results, and financial projections are subject to market conditions and various risk factors.
The 2026 oil price surge is driven by the effective closure of the Strait of Hormuz following military conflict in the Middle East, which has removed nearly 10.8 million barrels per day of Gulf production from global markets since late February 2026.
Under normal conditions, approximately one-fifth of global oil supply, around 21 million barrels per day, transits the Strait of Hormuz, making it the single most concentrated bottleneck in global energy trade with no alternative route at comparable scale.
The EIA's 12 May 2026 conflict-scenario forecast projects Brent averaging around $106 per barrel in May-June 2026, declining to $89 per barrel by Q4 2026, and falling further to $79 per barrel as a full-year 2027 average, assuming sustained de-escalation and production recovery.
J.P. Morgan's pre-disruption baseline for 2026 Brent crude sits at approximately $60 per barrel under non-conflict conditions, meaning roughly $50 per barrel of the current spot price above $110 represents pure conflict risk premium embedded in live markets.
No. Even if Saudi Arabia's East-West Pipeline, the UAE's ADCOP Pipeline, and the Iraq-Turkey Pipeline all operated at maximum rated capacity simultaneously, their combined throughput of roughly 8 million barrels per day would still fall well short of the 10.8 million barrels per day currently being shut in.