Several of the risks that analysts were debating as hypotheticals weeks ago are now active market realities. Bab el-Mandeb traffic has fallen to multi-month lows, a Chinese teapot refiner has been sanctioned for purchasing Iranian crude, and physical cargo premiums across the Middle East, Europe, and Africa have climbed to levels not seen in months. These are not warning signals. They are confirmed disruptions already reshaping how crude moves around the world.
This is not a story about a single geopolitical flashpoint. It is a story about three converging forces, each partially realised and each capable of intensifying, pressing on the same part of the oil market at the same time. The question for investors is no longer whether geopolitical risk has entered the crude price. It has. The question is how much further it has to run, and what that means for positioning.
Here is what the data tells you about where Brent goes from $91, which conditions would push it toward $100 or $120, and which specific variables are worth monitoring before you adjust energy or equity exposure.
Three forces are already moving the crude market, not just threatening to
The shift that matters most right now is one of tense. What was forward-looking risk a month ago is present-tense reality. Brent crude is trading at approximately $91-92 per barrel, and that price already reflects friction that has raised costs and constrained supply across three distinct channels.
Here is where each pressure vector stands:
- Iran’s leverage strategy: Active. Tehran is deliberately pursuing higher crude prices as a pressure tool against Washington, with maximalist conditions for any negotiated settlement.
- Houthi Red Sea disruptions: Escalating. Vessel transits through Bab el-Mandeb have fallen to multi-month lows following late-July attacks, and tankers are actively rerouting away from the strait.
- US sanctions on Chinese buyers: Partially realised. The US Treasury has sanctioned Shandong Shengxing Chemical Co., Ltd. and associated shipping vessels, with further escalation possible.
Shandong Shengxing Chemical was sanctioned for purchasing over $1 billion of Iranian crude linked to Iran’s Islamic Revolutionary Guard Corps (IRGC), making it the first major enforcement action against a Chinese teapot refiner in this cycle.
Physical crude premiums in the Middle East, Europe, and Africa have already risen to multi-month highs. The market is not simply pricing in fear; it is pricing in friction that has already materialised. That makes the current $91-92 baseline a floor established by active disruptions, not a ceiling defined by speculation.
VLCC daily hire rates tracking around $110,000 per day are a physical market signal that often moves faster than crude futures, and the history of geopolitical risk premiums in the Hormuz corridor shows they decompress slowly rather than snapping back, a pattern directly relevant to how long the current Brent floor holds.
When big ASX news breaks, our subscribers know first
Iran’s strategic calculus: why higher oil prices are the goal, not the side effect
Iran is not reacting to events. It is engineering them. Tehran’s core aim is to push crude prices as high and as rapidly as possible, using that economic pressure to compel a shift in US policy. The maritime chokepoints and proxy forces that Iran commands, from the Strait of Hormuz to the Houthis operating in Bab el-Mandeb, are not side effects of regional instability. They are leverage instruments deployed with a defined purpose.
Any potential agreement faces demands that are deliberately set at an extreme: financial compensation for war damages, the unconditional release of all frozen assets, and comprehensive removal of sanctions. These are not opening positions in a negotiation that is trending toward compromise. They are conditions designed to be unacceptable, which keeps the pressure campaign running and crude prices elevated.
Iran’s annual defence spending is estimated at approximately $10 billion, while the US allocates roughly $1 trillion per year to defence. That gap explains why Tehran’s preferred arena is economic rather than military; applying pressure through disruption costs far less than matching American firepower directly.
What this means for you: the probability of a near-term negotiated settlement that removes oil market risk premia is low. Diplomatic de-escalation is not the base case.
What the US response posture tells you about the timeline
The USS Abraham Lincoln has returned to home port, a development that points toward no imminent military strike on Iran. Meanwhile, the USS George Washington was assessed to be roughly three weeks away from the region at the time of this analysis, leaving a significant gap in forward-deployed naval power.
Gen. Dan Caine, Chairman of the Joint Chiefs of Staff, has described the choice facing policymakers in starkly binary terms: accept a withdrawal and concede defeat, or commit to a substantial escalation, with no viable middle option available.
That binary creates a political wrinkle. Republicans’ midterm election prospects could improve if the administration takes decisive military action and declares a clear outcome. The political calculus adds complexity without adding clarity, which is precisely the environment in which risk premia persist rather than dissipate.
Red Sea rerouting and what shipping data is already pricing in
The vessel tracking data tells a clearer story than the headlines. In the two weeks leading up to this analysis, tanker movements from the Suez Canal into the Mediterranean rose noticeably. Vessels carrying Saudi crude loaded in the Red Sea have been diverting toward northward routes into European ports, bypassing the risk of southward passage through waters where Houthi threats remain active. European physical crude markets have consequently remained relatively well-supplied, while southward passage through Bab el-Mandeb has contracted sharply, with transits falling to multi-month lows.
A tactical lull in Houthi attacks that began in early August has since ended. Active disruption has resumed, and the rerouting patterns have intensified accordingly.
| Route | Current Status / Market Effect |
|---|---|
| Suez Canal to Mediterranean | Increased tanker traffic as Saudi-loaded vessels divert northward into Europe, keeping European physical markets relatively well-supplied |
| Cape of Good Hope rerouting | Emerging risk if Bab el-Mandeb disruptions persist; longer voyages add tonnage demand, insurance costs, and delivery delays |
| Bab el-Mandeb transit | Vessel transits at multi-month lows following late-July Houthi escalation; very limited commercial traffic confirmed by Kepler tracking data |
Route changes, longer voyages around the Cape of Good Hope, and higher insurance premiums create a physical supply shock that futures curves can be slow to fully reflect. Physical crude cargo prices in the Middle East, Europe, and Africa have already risen to multi-month highs, outpacing the move in derivatives pricing.
The Sumed Pipeline and Egypt’s Sidi Kerir terminal have effectively become primary conduits for Gulf crude, with eight supertankers tracked heading there in late July, and Brent backwardation data suggests bypass infrastructure is absorbing diverted volumes rather than failing under the pressure.
When physical premiums are rising faster than futures curves, it signals that the real-world supply constraint is more severe than what derivatives markets currently reflect. That gap is where informed buyers are getting ahead of the market.
The sanctions escalation ladder and what it means for Iranian crude flows
Sanctions against Chinese buyers of Iranian crude are not a binary switch. They are a ladder with distinct rungs, and where the US currently stands on that ladder determines the market impact.
Here is the escalation sequence, ranked by impact on Iranian crude flows and global markets:
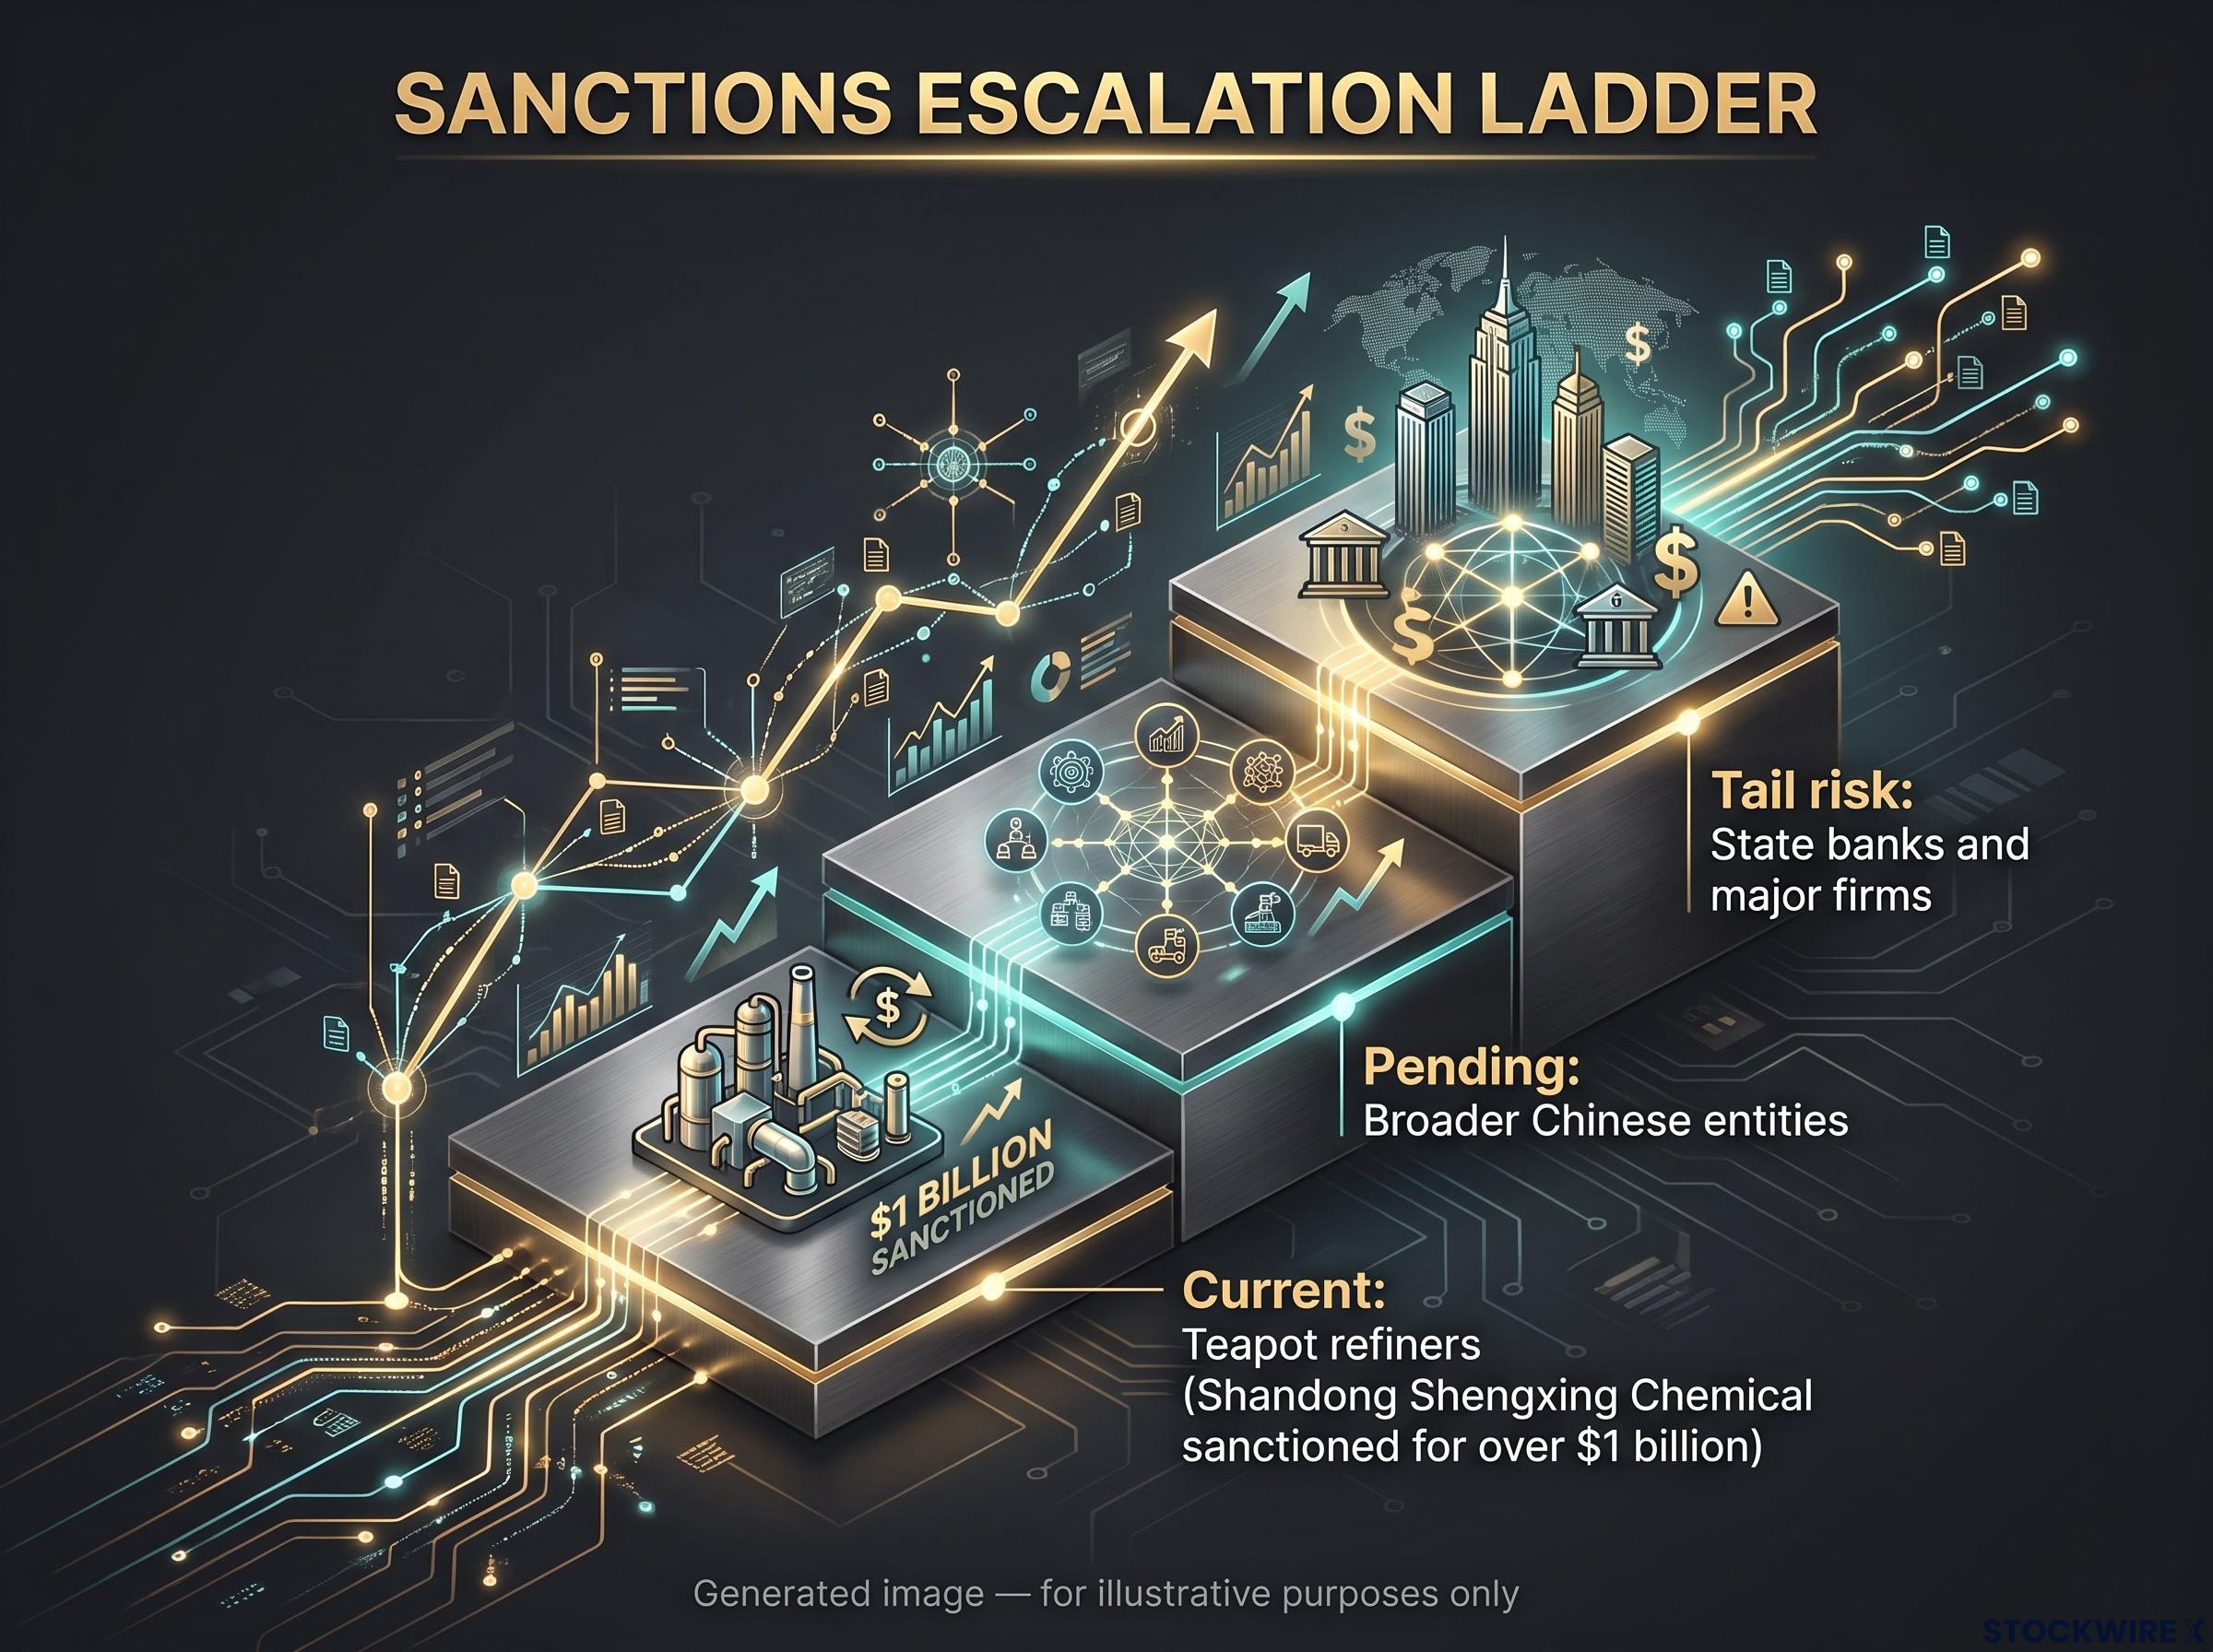
- Current step (active): Targeted sanctions on independent teapot refiners. Shandong Shengxing Chemical sanctioned for over $1 billion in Iranian crude purchases linked to the IRGC. Associated shipping companies and vessels also targeted.
- Next step (pending): Broader sanctions on additional Chinese entities, including state-owned refiners and terminals. This would move Iranian export disruption from contained to severe.
- Tail risk step: Penalties extended to major Chinese state-owned financial institutions and banking groups. This is the rung that would apply the greatest upward pressure on oil prices and the sharpest downward pressure on equities, particularly in manufacturing, autos, and technology hardware.
China is the largest buyer of Iranian oil, with imports peaking around 1.8 million barrels per day in March, largely via independent teapot refiners rather than major state-controlled firms. That concentration makes targeted sanctions on this segment genuinely impactful on Iranian flows.
| Sanctions Scope | Iranian Flow Impact | Market Implication |
|---|---|---|
| Teapot refiners (current) | Moderate: disrupts primary purchase channel but allows workarounds | Supports current risk premium; keeps Brent in $90-100 range |
| Broader Chinese entities (next step) | Severe: restricts alternative channels and complicates dollar financing | Bullish for oil ($100-120); bearish for equities via supply chain risk |
| State banks and major firms (tail risk) | Near-complete: forces Iranian exports into deep discount or storage | Highly bullish for oil; additive equity pressure if China retaliates via critical minerals |
Beijing has indicated a willingness to deploy countermeasures through its control of critical mineral supply chains and specialist processing capacity, drawing on a pattern of economic leverage it has applied during previous periods of supply chain stress. That retaliation channel is the amplification risk: combining higher oil with Chinese countermeasures on minerals and industrial inputs would create compounding pressure on manufacturing, autos, and technology hardware in the US and Europe.
Chinese countermeasures through critical mineral supply chains are a documented pattern: Beijing’s willingness to deploy economic leverage in previous periods of supply chain stress provides a concrete template for how the retaliation channel described in the sanctions escalation ladder could activate, compounding oil cost headwinds with input cost pressure across manufacturing and technology hardware.
The question for you is not whether the current sanctions matter. They do. It is whether the next rung gets pulled, because that is the move that shifts Iranian flows from disrupted to severely constrained.
Brent at $91, $100, or $120: what each scenario requires and what breaks it
Oil price predictions in the current environment are better framed as scenario analysis than point forecasts. Each price range requires a specific set of conditions, and each has an identifiable circuit breaker.
| Scenario | Brent Range | Key Conditions Required | Equity Market Implication |
|---|---|---|---|
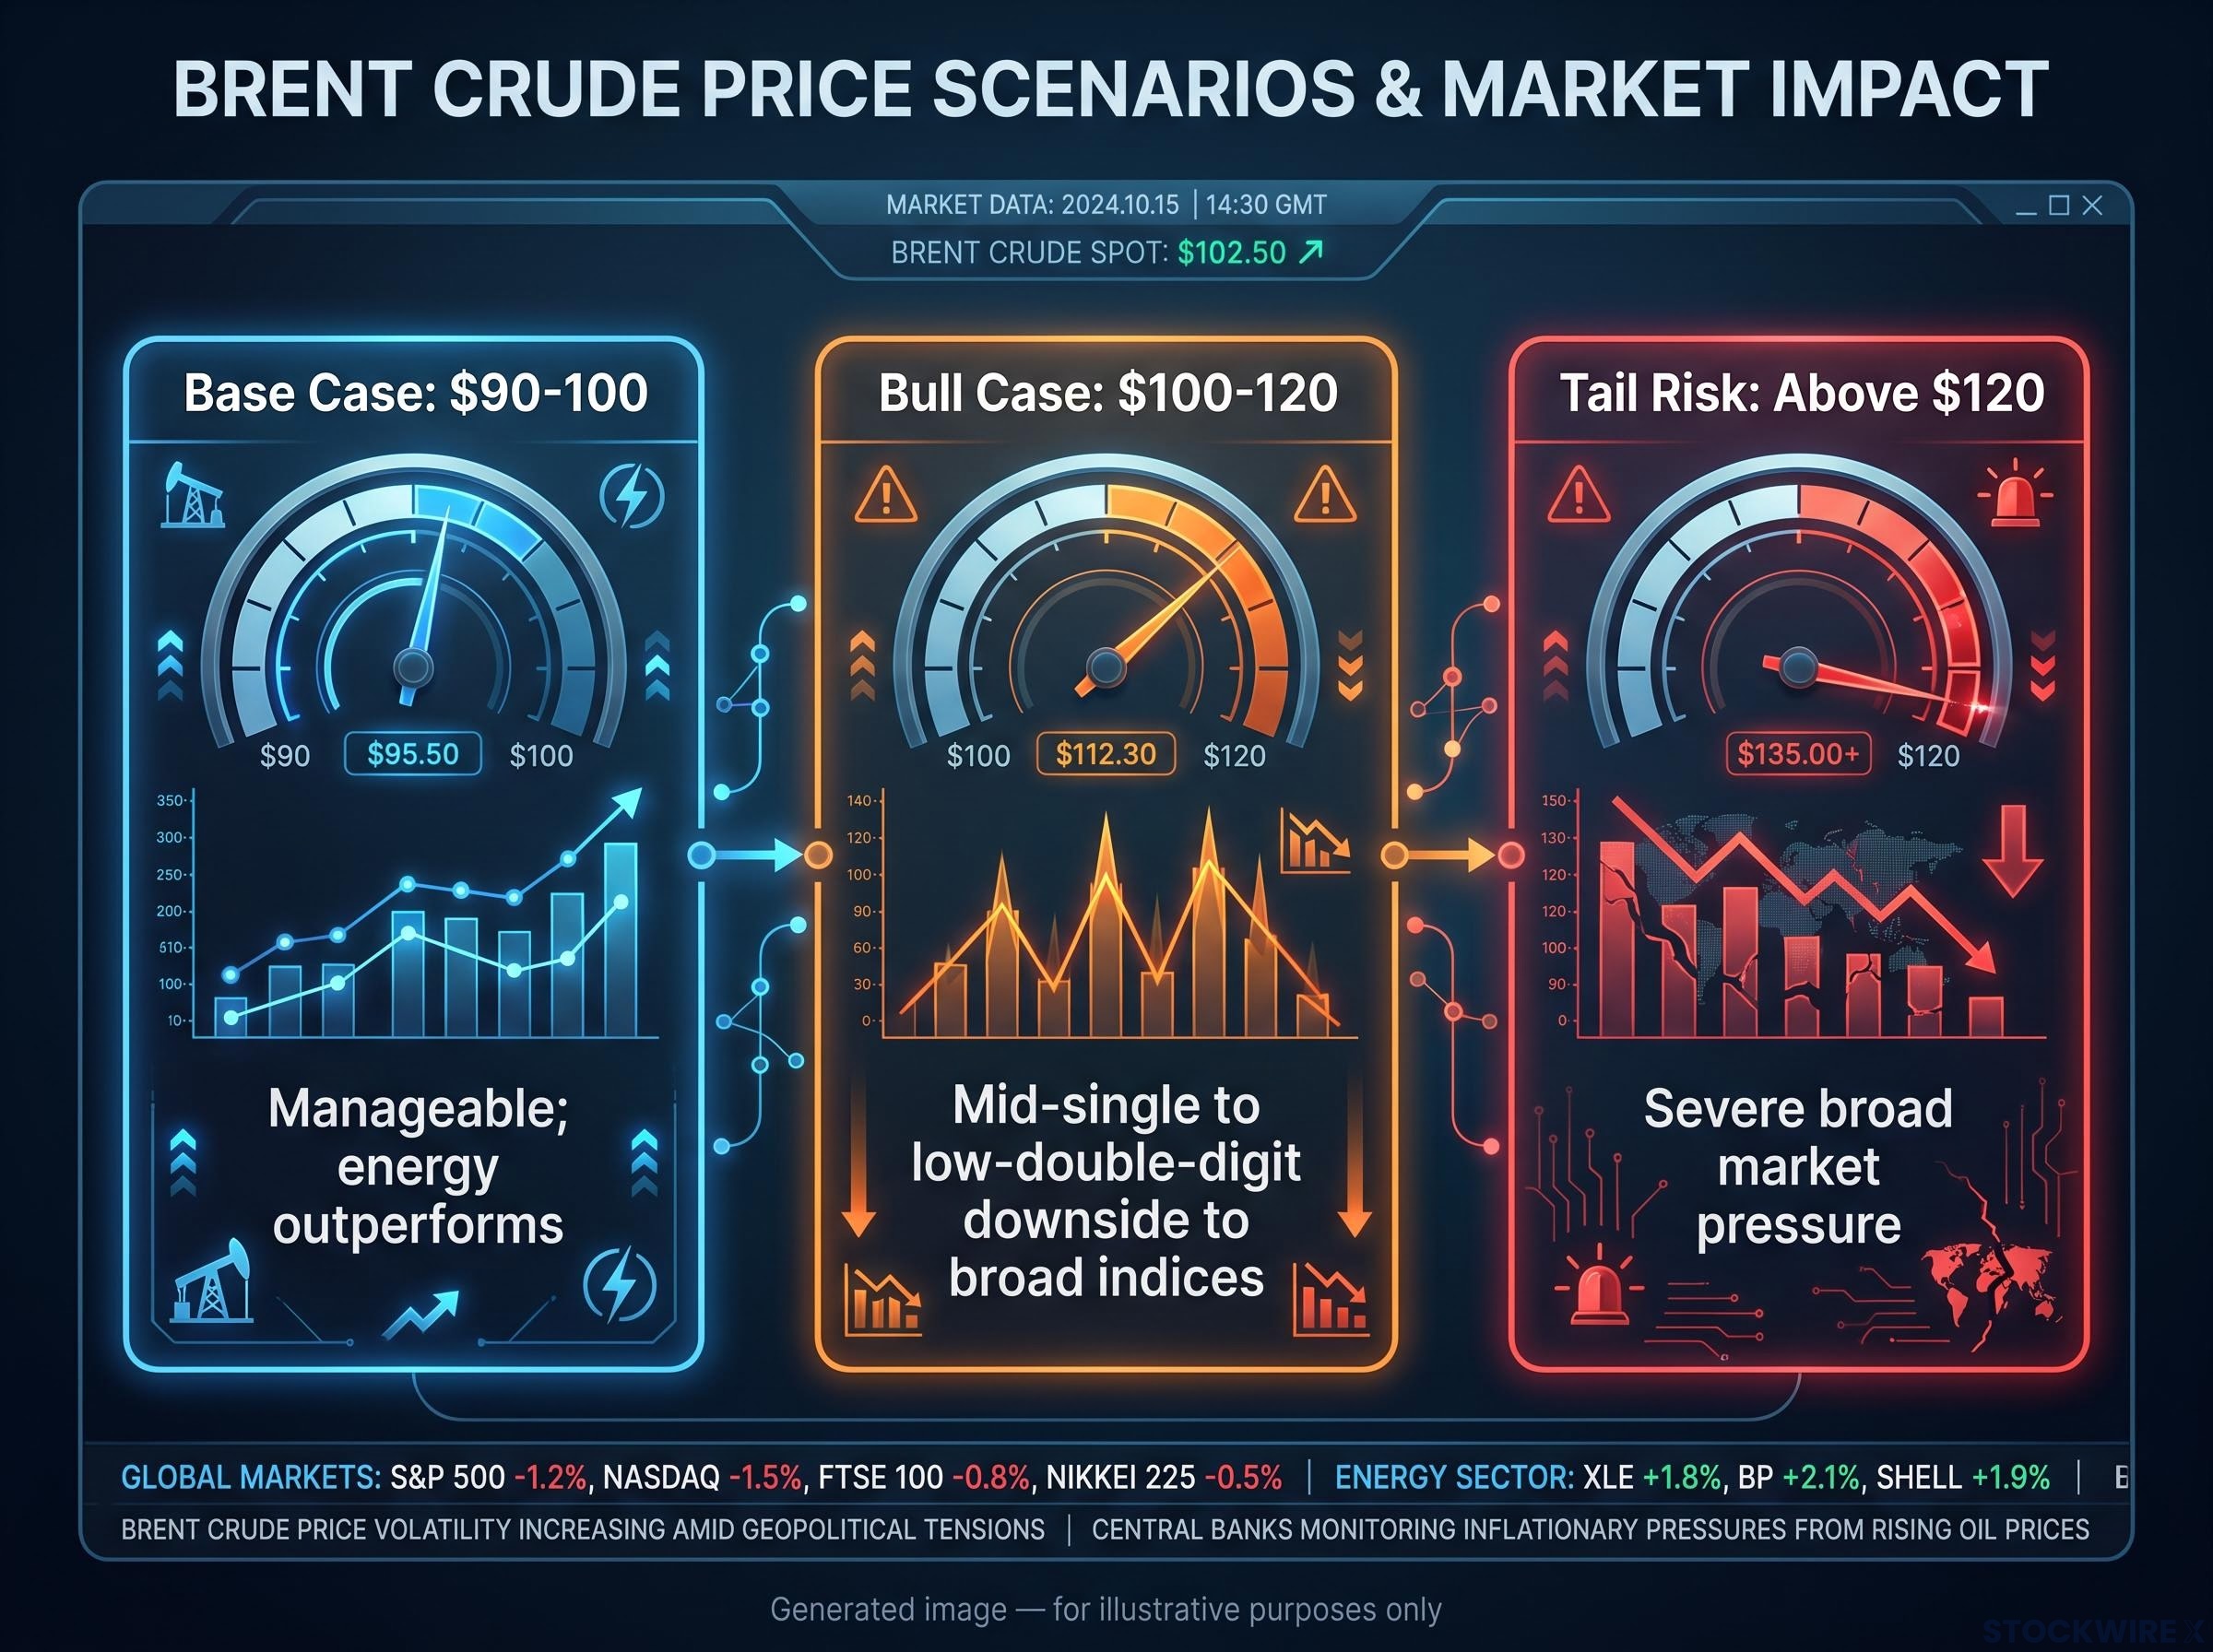
| Base case | $90-100 | Current disruptions persist without step-change escalation; sanctions remain targeted at teapot refiners; no Hormuz closure | Manageable; energy outperforms, broad indices absorb moderate headwind |
| Bull case | $100-120 | Large-scale Cape of Good Hope rerouting; sanctions broaden to Chinese state entities; Iran resists compromise; no large OPEC+ supply increase | Mid-single to low-double-digit downside to broad indices; airlines, manufacturing, consumer discretionary under pressure |
| Tail risk | Above $120 | Strait of Hormuz disruption or closure; strikes on Iranian energy infrastructure; sustained military escalation | Severe broad market pressure; energy producers and shipping names as primary hedges |
The bull case is no longer a low-probability tail. It is a plausible near-term outcome if two or three of the conditions already in motion intensify modestly. Energy producers, select commodity-linked assets, and shipping names are the natural beneficiaries. Consumer discretionary, airlines, manufacturing, and technology hardware (via the China mineral retaliation channel) face the most acute pressure.
Under sustained $100-120 Brent, models suggest mid-single to low-double-digit percentage downside to broad equity indices. If China retaliates via critical minerals alongside elevated crude, the pressure compounds across manufacturing, automotive, and technology hardware sectors.
NBER research on oil price shocks documents that all but one of the eleven US recessions since World War II were preceded by a sharp increase in crude petroleum prices, a historical pattern that gives empirical weight to the equity downside projections embedded in the bull and tail-risk scenarios above.
OPEC+ supply response remains the primary supply-side offset capable of restraining prices in the bull case. The absence of a confirmed large production increase is itself a market signal.
Past performance does not guarantee future results. Financial projections are subject to market conditions and various risk factors.
Six variables that will tell you which scenario is building
Geopolitical analysis is only useful if it converts into something you can monitor. These six variables, ranked by market impact, are the signals that will tell you whether the base case holds or the bull case is building:
- Houthi attack frequency and severity: Any acceleration beyond the current baseline signals movement toward the bull case. Watch for targeting of specific infrastructure rather than individual vessels.
- Vessel routing data: The share of traffic using the Cape of Good Hope route versus Suez Canal is a quantitative leading indicator of physical market tightening.
- US sanctions scope expansion: Any move to target major Chinese state refiners or banks is the highest-impact single signal in this framework.
- Chinese countermeasures: Any explicit action on critical minerals, technology components, or energy cooperation agreements signals escalation into the compounding-pressure scenario.
- OPEC+ supply response: A large announced production increase would be the primary supply-side dampener on the bull case.
- Strait of Hormuz traffic: Any escalation in interference or closure threats is the leading indicator of tail-risk territory.
These variables are observable in near real-time through shipping data providers, US Treasury releases, and OPEC+ communiqués. You do not need to rely on geopolitical forecasting to stay ahead of the next price move.
The one supply-side offset that could change the picture
OPEC+ production increases are the primary variable capable of restraining the bull case. US shale response typically operates on a longer lag than OPEC+ decisions, meaning short-term supply relief depends on the cartel’s willingness to accommodate. The fact that no confirmed large increase has materialised tells you the supply buffer is not forming.
Where the risk-reward sits for oil and equity portfolios right now
The three pressure vectors converge on a single risk-reward observation: the asymmetry in the current setup favours investors who have already adjusted energy exposure over those waiting for confirmation.
Here is what is already priced:
- Initial sanctions on teapot refiners (Shandong Shengxing)
- Current Red Sea rerouting and elevated physical premiums
- Baseline Houthi disruption and Bab el-Mandeb traffic reduction
Here is what is not yet fully priced:
- Sanctions escalation to Chinese state entities or banks
- Large-scale Cape of Good Hope rerouting if Bab el-Mandeb disruptions persist
- Military tail risk involving the Strait of Hormuz
- Chinese retaliation via critical minerals compounding the oil cost headwind
Active disruptions have established $91-92 Brent as a floor. Escalation scenarios drive the ceiling. That asymmetry means the risk of being underweight energy is larger than the risk of being overweight it, unless the disruptions currently in motion reverse.
Energy producers and selected shipping names provide a natural hedge against the equity market pressure that higher oil creates for consumer discretionary, airlines, manufacturing, and technology hardware. The monitoring framework from the previous section is your operational tool for knowing when to adjust.
Many integrated majors and upstream producers built their 2026 budgets around $75-80 oil, which means Brent sustaining at current levels generates earnings upgrades not yet in consensus estimates, reinforcing the structural case for energy stocks as an inflation hedge in a portfolio absorbing broader equity market pressure.
By the time the bull case is confirmed by headlines, much of the move in crude will already have occurred. The data available today, from shipping routes to sanctions filings, is where positioning advantages are built.
This article is for informational purposes only and should not be considered financial advice. Investors should conduct their own research and consult with financial professionals before making investment decisions.