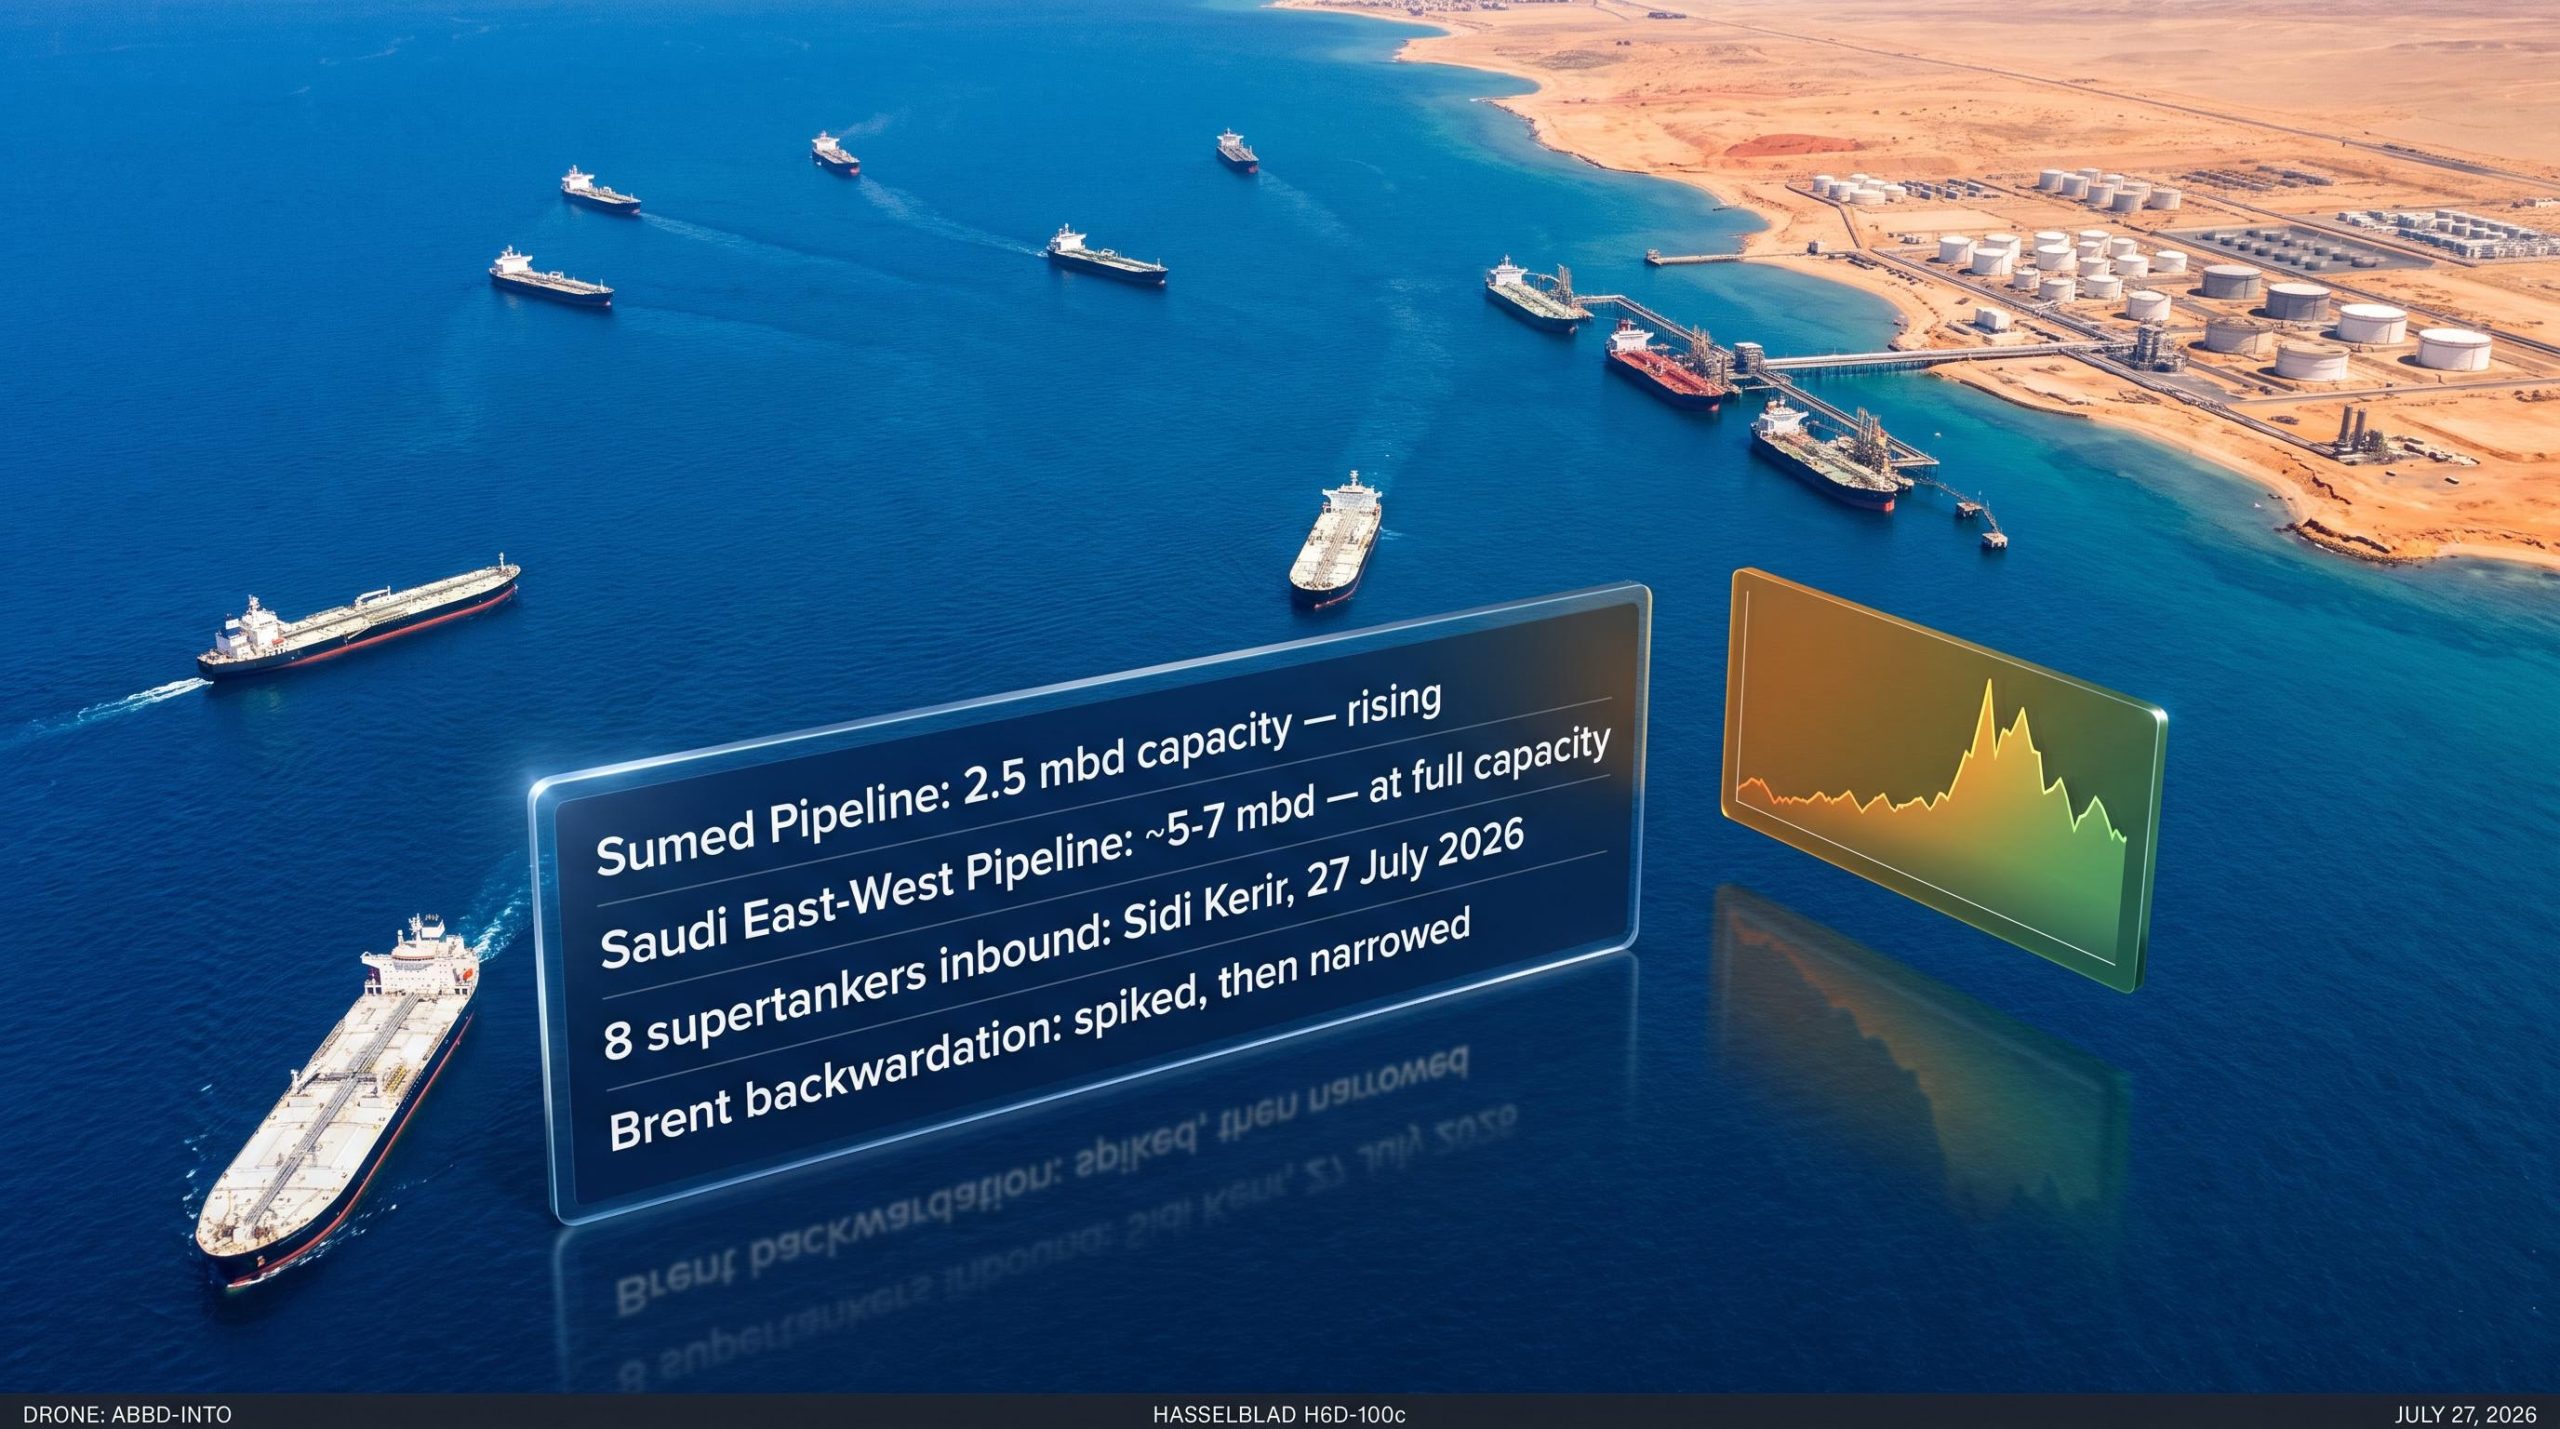
Eight supertankers were heading toward Sidi Kerir, a port on Egypt’s Mediterranean coast, as of 27 July 2026. Most readers have never heard of Sidi Kerir. By the time this crisis is over, commodity traders will not be able to forget it.
The world’s two most important oil export chokepoints are under simultaneous stress. The Strait of Hormuz has been effectively shut to commercial traffic since late February 2026, not by formal blockade but by prohibitive war-risk insurance and seafarer refusals. The main alternative, the Red Sea corridor through Bab el-Mandeb, came under escalating Houthi attack in July 2026. And yet oil is still moving.
What follows is not reassurance or alarm. It is a working map of where the barrels are actually going, what infrastructure is carrying them, and what the futures curve is telling you about whether that routing holds. This is not a hypothetical scenario. It is the real-time anatomy of a rerouting already underway.
Two chokepoints, one supply shock
The scale of what is simultaneously offline is worth stating plainly before anything else:
- Strait of Hormuz: Effectively shut since late February 2026. Commercial traffic has fallen to near zero, driven not by formal closure but by insurance costs so high and seafarer refusal rates so widespread that transiting is commercially unviable for most operators. Hormuz normally carries approximately 20% of global oil supply, roughly 20 million barrels per day at recent baseline flows.
The war-risk insurance withdrawal that effectively closed Hormuz to commercial traffic operated through a compounding mechanism: as premiums rose to commercially unviable levels, vessel owners refused assignments, which reduced the number of completed transits, which in turn fed the actuarial models that insurers use to price the next voyage even higher.
- Bab el-Mandeb: In July 2026, Houthi forces operating as Iranian allies struck vessels in the strait, attacked the East-West Pipeline, and moved to threaten the port of Yanbu, cutting across the primary export route connecting Saudi Red Sea terminals to Asian buyers. Kpler data showed transit volumes falling sharply after the attacks.
Each of these disruptions alone would be significant. Together, they squeeze the two corridors that carry the overwhelming majority of Gulf export volume.
This is not a single-point failure with a single workaround. It is a layered compression of the system’s two primary arteries, and that is what makes the infrastructure response detailed in the sections that follow genuinely significant rather than routine contingency planning.
When big ASX news breaks, our subscribers know first
The pipeline bypasses already running at capacity
Long before this crisis, Saudi Arabia and the UAE built pipeline infrastructure for precisely this scenario. The significance of that infrastructure is only now fully visible.
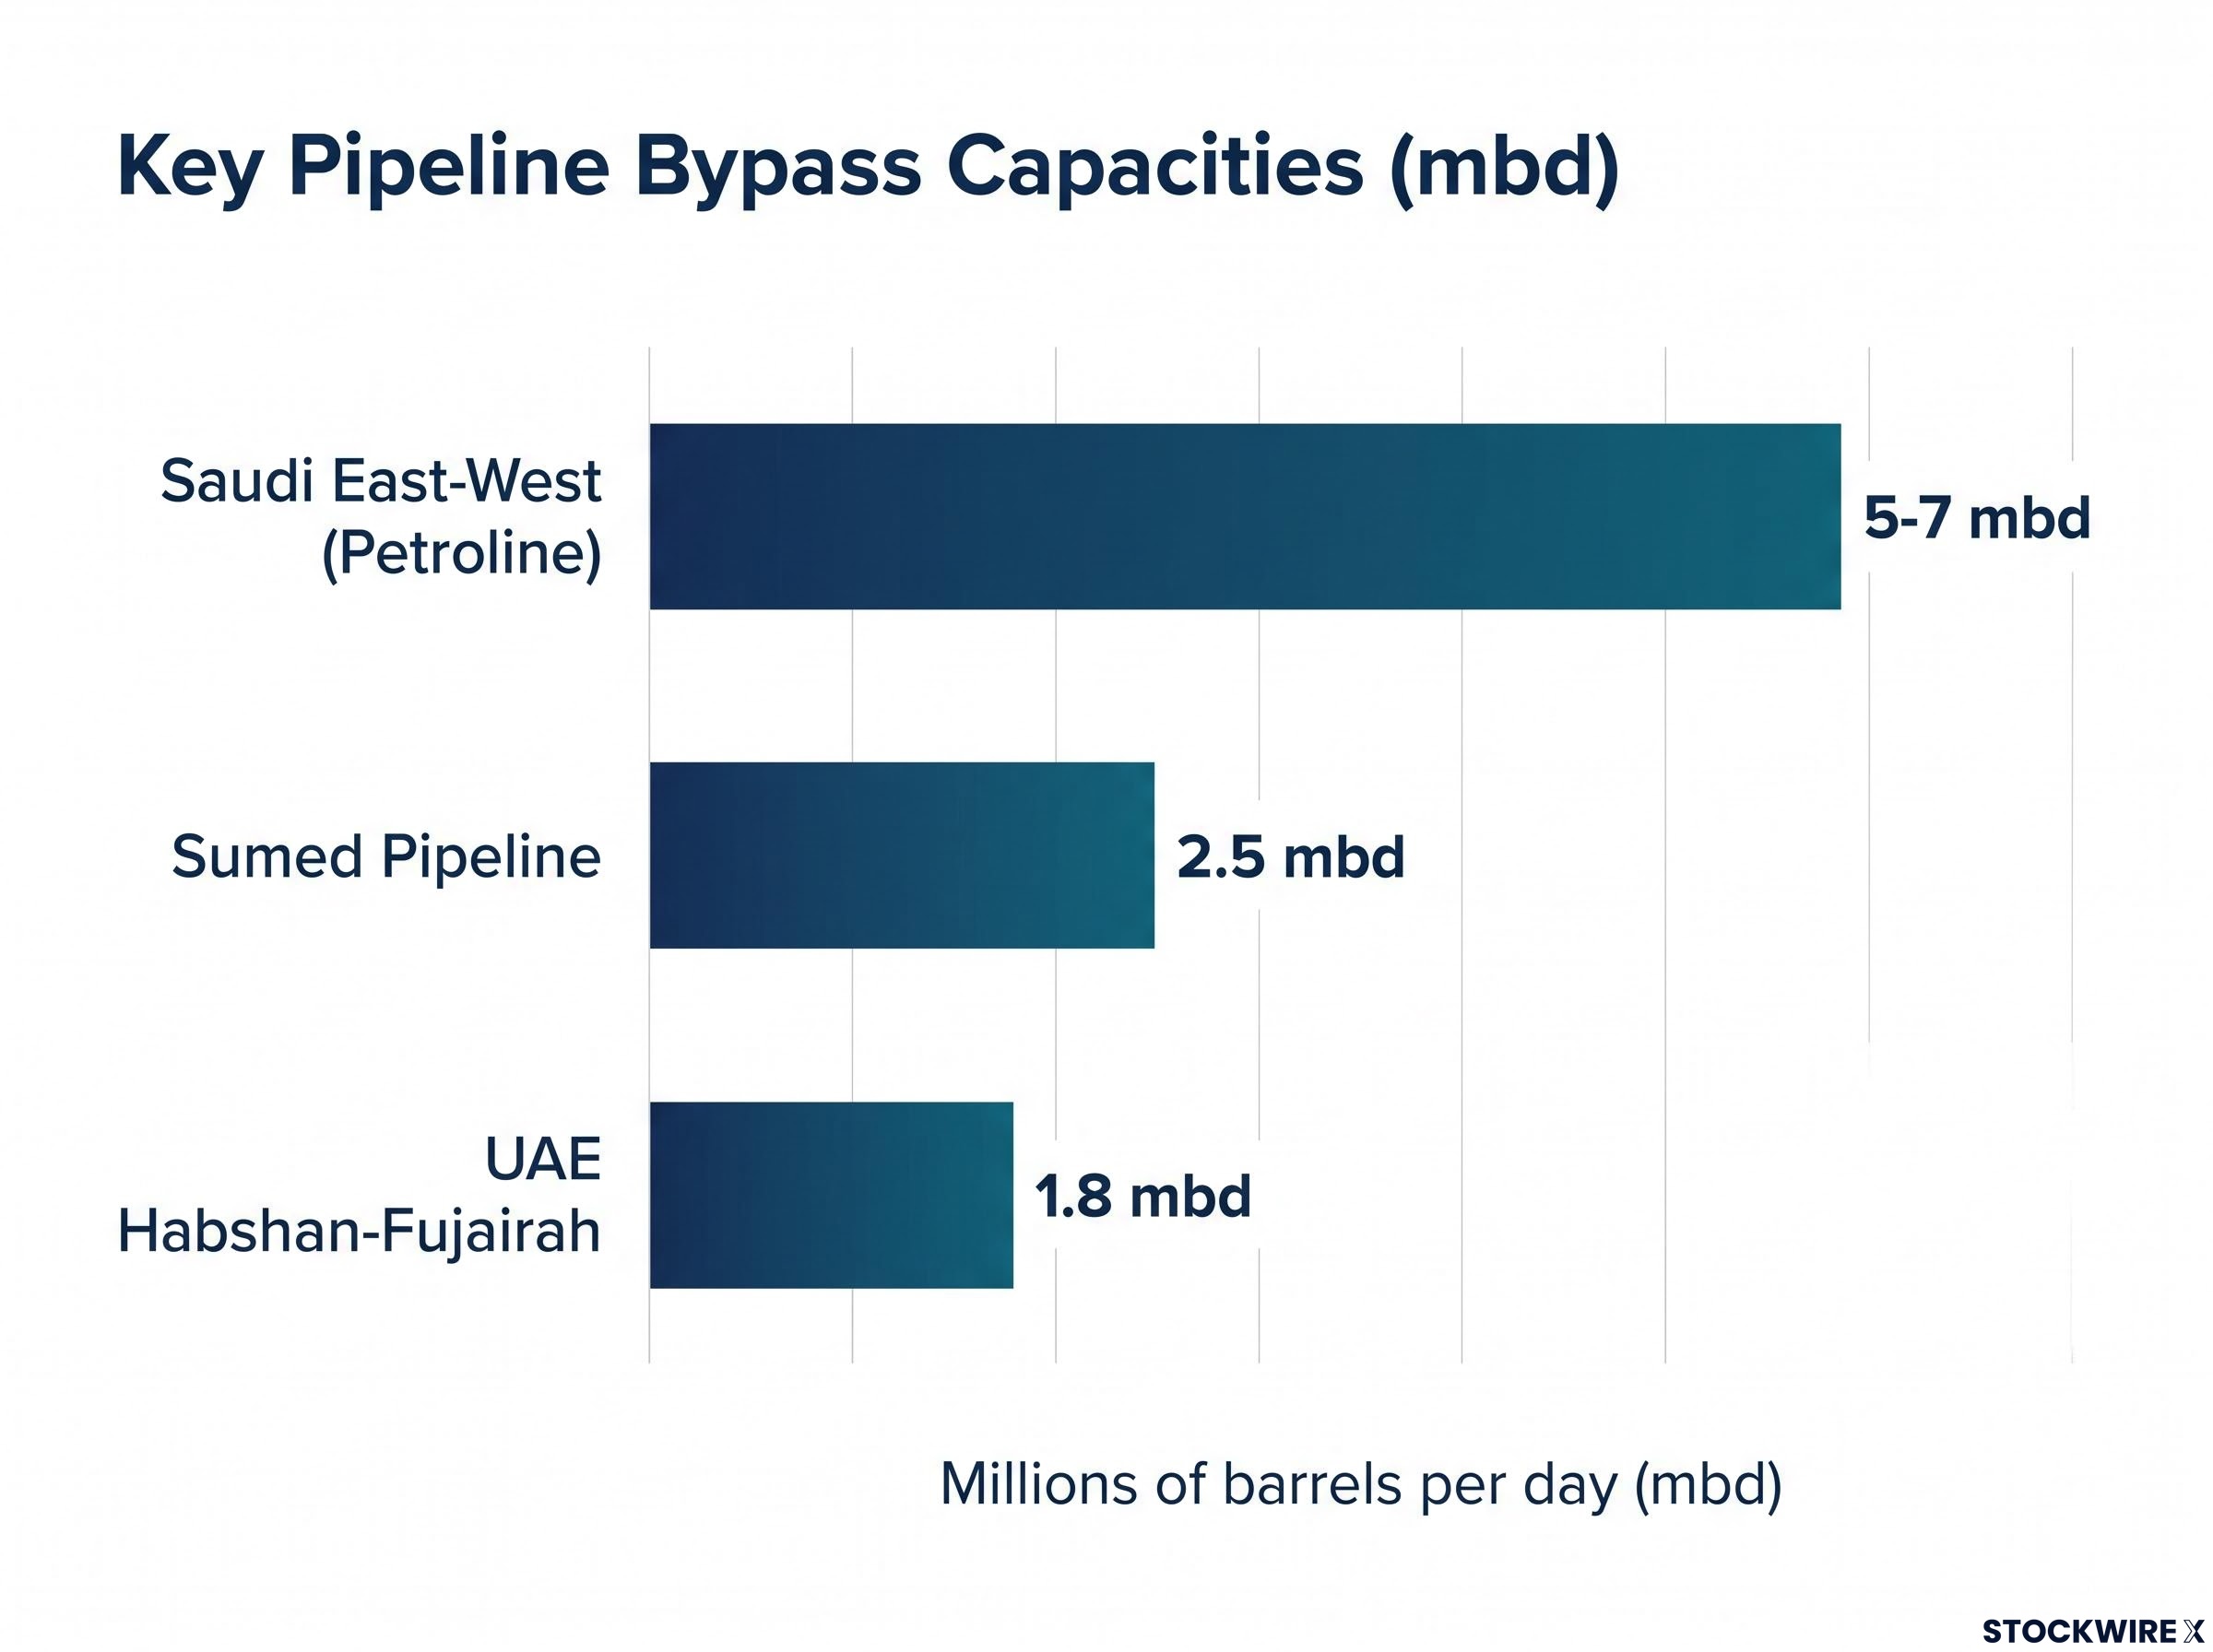
Saudi Arabia’s East-West Pipeline (also known as Petroline) was explicitly designed as a hedge against Hormuz closure. It moves crude from the kingdom’s eastern fields to Yanbu on the Red Sea coast, bypassing the Strait of Hormuz entirely. It is now running at or near full capacity. The pipeline delivers approximately 5 million barrels per day to Yanbu specifically, with a broader 5-7 mbd range reflecting design capacity and subsequent expansions.
The UAE’s Habshan-Fujairah pipeline provides a second simultaneous bypass, delivering approximately 1.8 million barrels per day to Fujairah on the Gulf of Oman, also sidestepping Hormuz.
The Fujairah bypass vulnerability became concrete on 4 May 2026 when Iranian strikes on the Fujairah Oil Industry Zone pushed Brent to $113.67, demonstrating that pipeline infrastructure designed to sidestep one chokepoint can itself become a target, a risk that the UAE’s Habshan-Fujairah pipeline now carries in the current threat environment.
| Pipeline | Route | Capacity (mbd) | Current Status |
|---|---|---|---|
| Saudi East-West (Petroline) | Eastern fields to Yanbu (Red Sea) | ~5-7 | At or near full capacity |
| UAE Habshan-Fujairah | Habshan to Fujairah (Gulf of Oman) | ~1.8 | In active use |
These pipelines were built as insurance policies. They are now being cashed in simultaneously. For investors, the implication is direct: the near-term supply floor is meaningfully higher than it would be in a world without this pre-positioned redundancy.
Why Yanbu is constrained but not closed
The East-West Pipeline is physically delivering crude to Yanbu. But the port’s effective throughput in the current threat environment is reduced. War-risk insurance costs have climbed sharply, and Houthi targeting of the Red Sea coast has forced loading operations into a more cautious posture. Wartime loading capacity at Yanbu is estimated at around 3-4 mbd, though this figure has not been independently confirmed.
Yanbu is still operating, but the gap between what the pipeline can deliver and what the port can safely load under current conditions is precisely what drove the next stage of the rerouting: the shift toward Egypt.
How Egypt became the pivot point of global oil routing
The pivot did not start as a plan announced in a boardroom. It started as a pattern visible in vessel-tracking data.
Bloomberg reported, via journalist Weilun Soon, that eight supertankers were heading toward Sidi Kerir as of 27 July 2026, a concrete signal that the Egyptian routing is operating at scale.
The geographic logic is sequential:
- Crude loaded at Red Sea terminals moves northward, away from the Houthi-threatened Bab el-Mandeb strait.
- It reaches Egypt via the Suez Canal or the Sumed Pipeline, which runs from the Red Sea coast to Sidi Kerir on the Mediterranean.
- At Sidi Kerir, cargoes are loaded onto tankers for European buyers or routed onward to other destinations.
The Sumed Pipeline carries a total capacity of 2.5 mbd and throughput is rising on diverted volumes. Saudi Aramco has been actively redirecting export shipments to Sidi Kerir as an operational response to the dual chokepoint squeeze.
This is not a contingency plan being discussed. It is a deployment visible in real-time data. If you are tracking energy markets or commodity-linked equities, Egyptian infrastructure capacity, specifically Sumed throughput and Sidi Kerir loading rates, should be treated as a live variable in supply assessments, not background context.
Why rerouted oil does not disappear from global supply
A common assumption during chokepoint crises is that closure equals proportional volume loss. If Hormuz carries 20% of supply and Hormuz shuts, global supply drops by 20%. The logic feels intuitive. It is also wrong.
Crude oil is fungible, meaning one barrel can substitute for another in most refining applications. When Saudi barrels that would have gone to Asia via Hormuz are instead routed to European buyers via Sidi Kerir, those barrels displace North Sea, West African, and U.S. export cargoes that Europe would otherwise have purchased. Those displaced barrels then become available to Asian refiners, who bid for them on alternative routes.
The supply does not vanish. It rearranges.
Where the disruption does land is in the distribution of costs:
- Asian delivered prices rise as voyage times and insurance costs increase on longer routes
- Freight rates climb as ton-miles per barrel increase across the system, tightening tanker markets
- Refiner margins compress for those exposed to delivered-price contracts, while upstream producers whose pricing is set at load port or wellhead face less direct impact
For equity investors in commodity-linked names, this fungibility dynamic tells you that the disruption is more likely to compress refiner margins and lift tanker rates than to produce an outright volume shortfall at the upstream producer level. That distinction matters directly for sector positioning.
The Cape of Good Hope as the system’s release valve
When both Hormuz and Bab el-Mandeb are threatened, the fallback is the longest route available: circumnavigating Africa via the Cape of Good Hope. Barrels still move, but voyage times extend by weeks, freight costs rise materially, and tanker utilisation tightens across the global fleet.
This is not theoretical. During the 2023 Houthi disruptions, major carriers including Maersk publicly suspended contested corridor transits and rerouted around southern Africa. Shippers accepted higher costs and longer transit times rather than leaving oil stranded. The 2026 episode is the same playbook at larger scale.
What the futures curve is telling you right now
When futures contracts for near-term oil delivery trade at a higher price than contracts for delivery further out, the market is in backwardation. Put simply, buyers are prepared to pay a premium for prompt barrels over those delivered in six months, reflecting a judgement that supply is tighter right now than it will be later.
Approximately two weeks before 29 July 2026, as pressure on Hormuz deepened and Houthi activity around Bab el-Mandeb intensified, backwardation moved sharply higher. The market was pricing in genuine concern that crude would not reach buyers on schedule. Since then, the spread has pulled back considerably. Even as fighting has continued, the premium on prompt delivery has retreated from those peak levels through late July. Curves remain somewhat elevated by historical standards, but the acute stress signal has faded.
Then it narrowed. Substantially. Even as hostilities continued, the degree of backwardation pulled back from its peak through late July. Curves remain tighter than in a typical well-supplied market, but they are no longer at panic levels.
The narrowing of backwardation is not a signal that the crisis is over. It is a signal that the market believes current workarounds, pipelines at capacity, Egyptian rerouting, and Cape detours, are sufficient for now. A future spike that fails to narrow would be the early warning that bypass capacity has been exhausted.
The insurance restoration timeline is the variable that most consistently lags behind political developments; VLCC daily hire rates tracking near $110,000 per day in May 2026 showed that physical markets were pricing a multi-month reopening lag well before diplomatic channels had acknowledged one.
| Indicator | Recent Signal | What It Means |
|---|---|---|
| Brent backwardation | Spiked ~2 weeks before 29 July; narrowed substantially since | Acute supply fears receding as workarounds absorb volume |
| Saudi East-West Pipeline | Running at or near full capacity (~5-7 mbd) | Primary Hormuz bypass fully engaged |
| Sumed Pipeline throughput | Rising on diverted volumes (2.5 mbd capacity) | Egyptian infrastructure absorbing Red Sea rerouting |
| War-risk insurance premia | Elevated across Hormuz and Red Sea corridors | Leading indicator of route viability before cargo data confirms |
The backwardation trajectory is the most time-sensitive data point in this analysis for anyone holding energy equities or commodity exposure. It translates geopolitical noise into a market-readable verdict on supply adequacy.
Three variables that will determine whether the workaround holds
The routing architecture detailed above is layered, but it is finite. Three specific variables will determine whether it continues to absorb the shock or reaches its limits:
- Egyptian infrastructure capacity. Sumed throughput and Sidi Kerir loading capacity have physical ceilings. The Sumed Pipeline’s 2.5 mbd capacity is already seeing rising volumes. If diverted flows continue to climb, congestion or technical limits at Egyptian facilities become the next constraint in the system.
- Geographic expansion of Houthi targeting. Current Houthi attacks focus on the southern Red Sea and Bab el-Mandeb. Any move to threaten the northern Red Sea or Suez Canal approaches would materially change the risk calculus, potentially forcing substantially more flows onto the Cape route with significant cost and timing consequences.
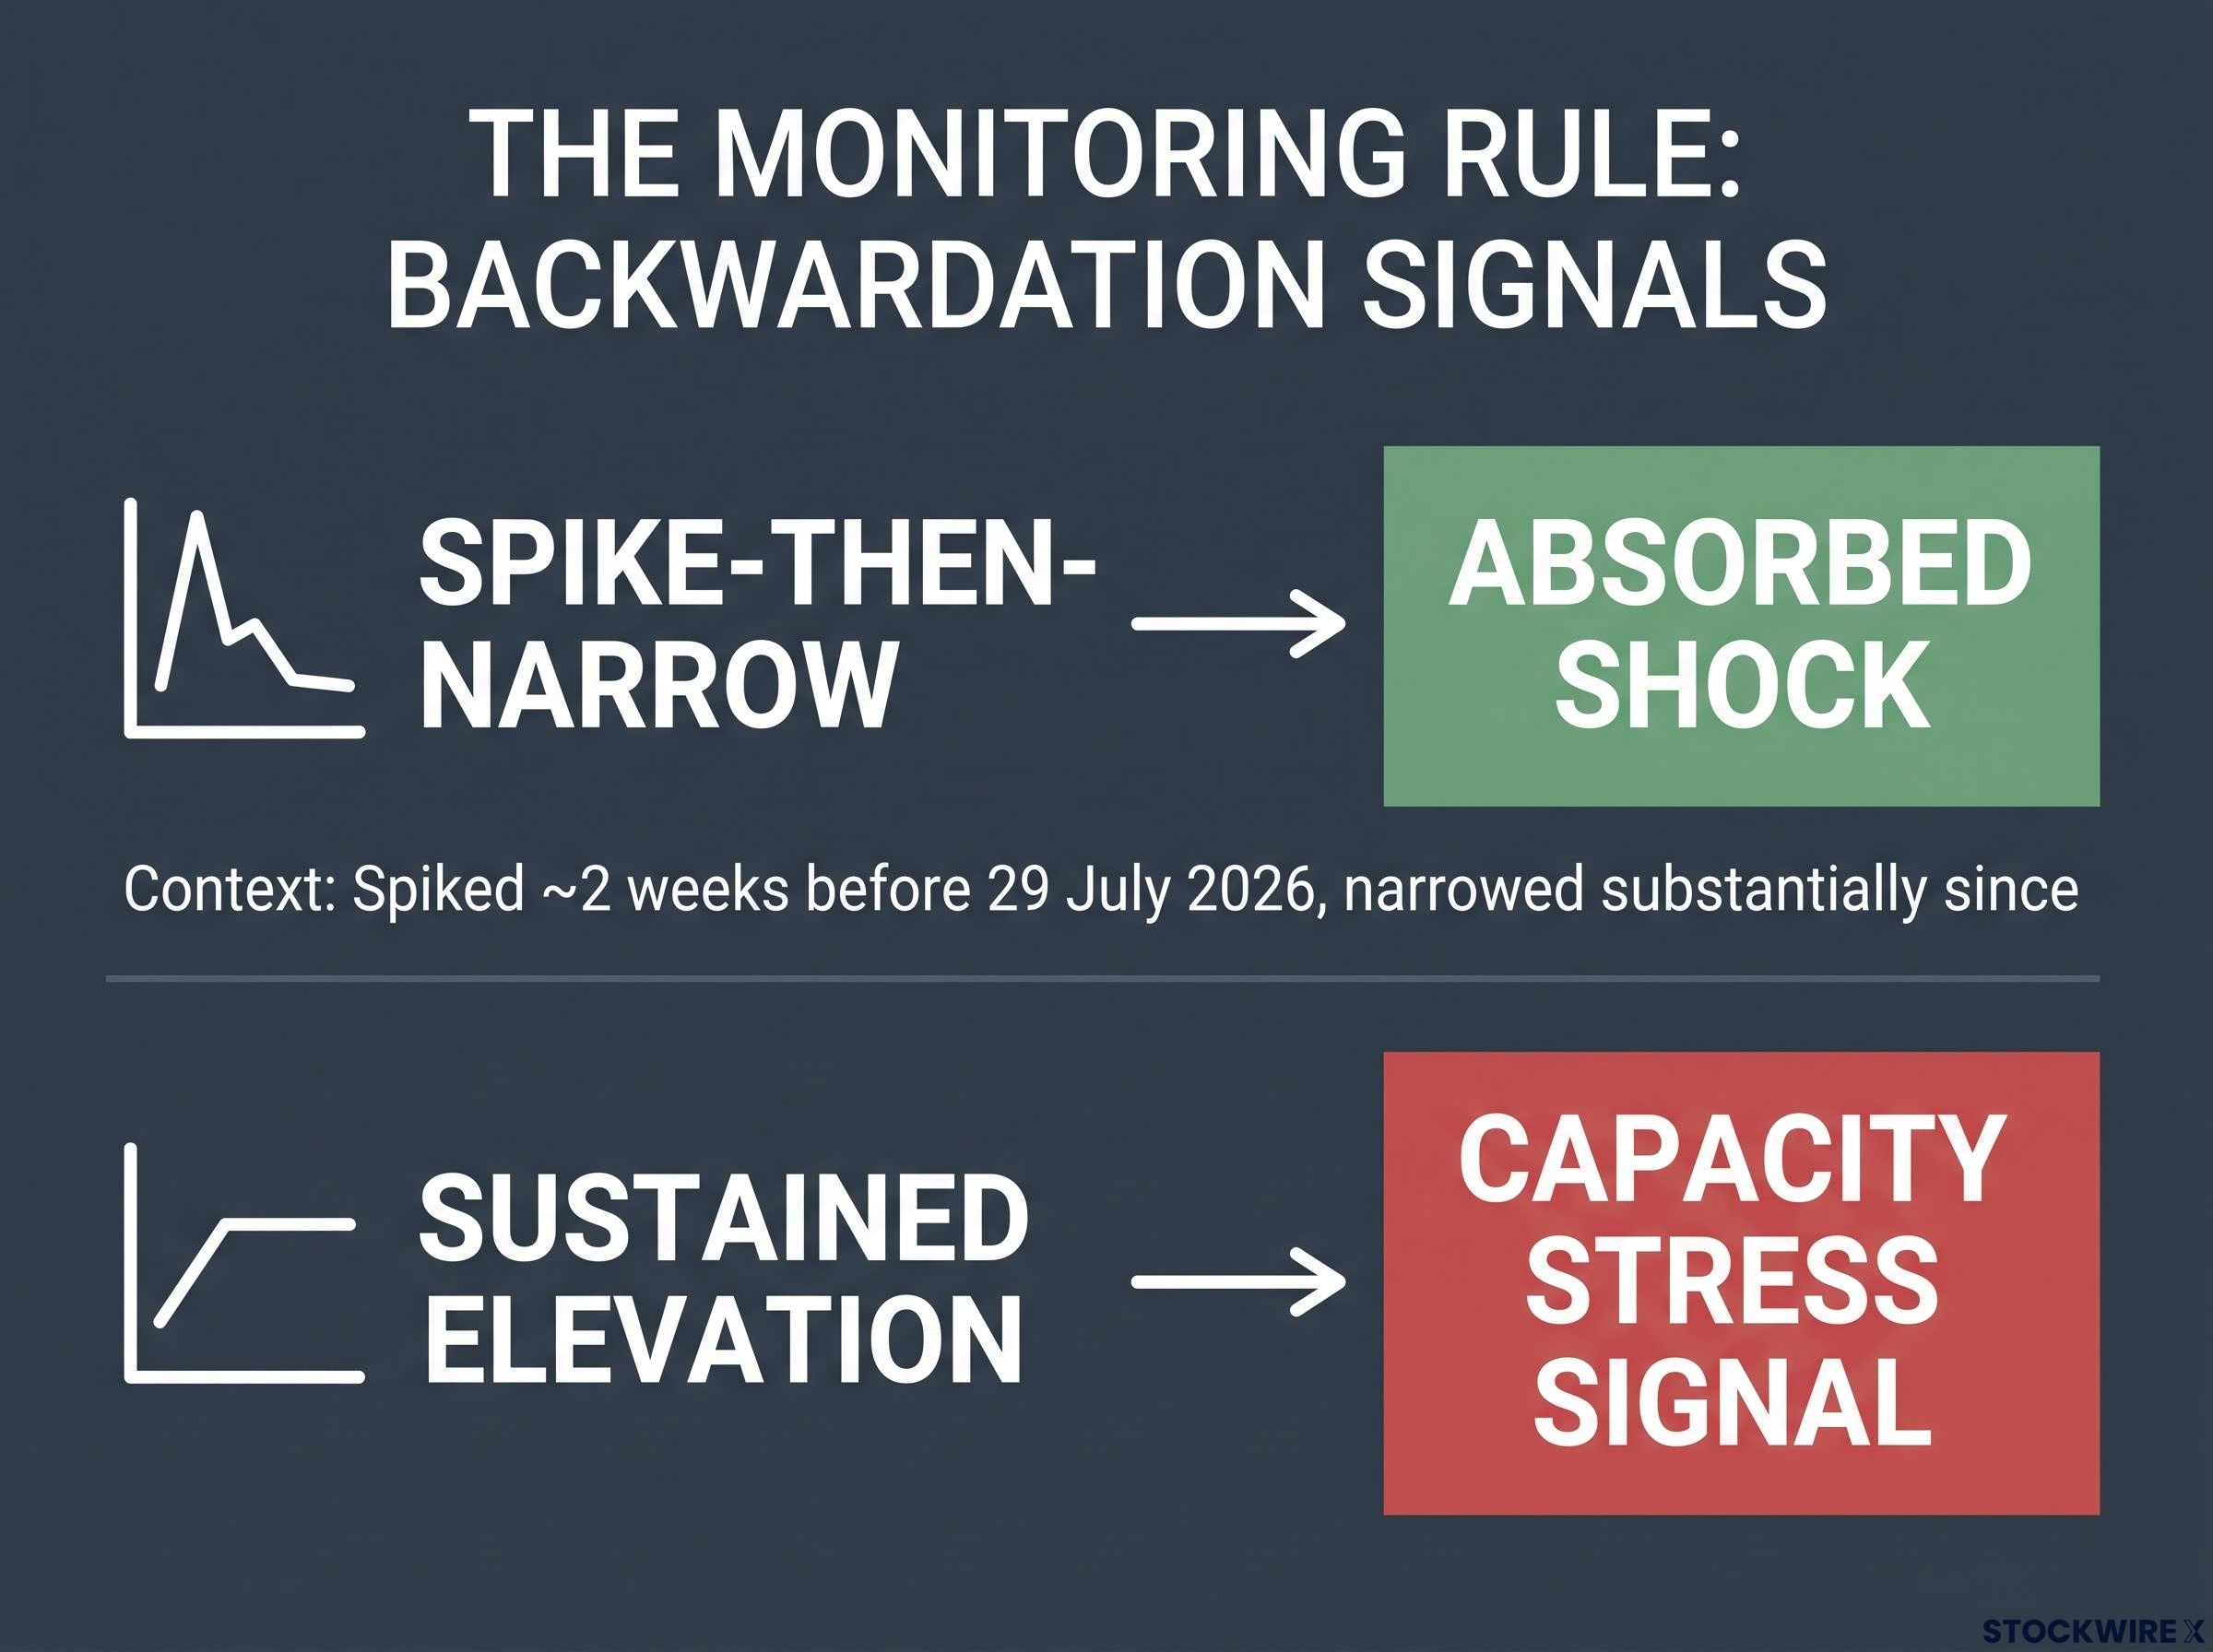
- Backwardation behaviour at the next shock. This is the self-reinforcing monitoring tool. If backwardation spikes again and narrows quickly, the workarounds are holding. If it spikes and stays elevated, the market is signalling that bypass capacity has been exhausted.
The monitoring rule: Spike-then-narrow equals absorbed shock. Sustained elevation equals capacity stress signal. War-risk insurance premia and charter rates provide earlier signals than cargo flow data, and both are publicly trackable.
These three variables give you a concrete monitoring framework that does not require proprietary data, only attention to publicly available futures curves, insurance market commentary, and vessel-tracking reporting.
What this episode confirms about commodity markets and what remains unresolved
The current episode adds a real-time data point to a pattern established in 2023 and earlier crises: global oil logistics are more resilient and reconfigurable than headline chokepoint risk implies. Pipelines built as insurance policies are delivering. Egyptian infrastructure has moved from secondary to load-bearing. The futures market recognised the system’s adaptability within weeks, not months.
What remains genuinely unresolved is whether this architecture can sustain the weight indefinitely. Egyptian infrastructure was not designed to serve as the primary conduit for Gulf exports on an ongoing basis. The geopolitical conditions driving the disruption remain active. The workaround is layered, but every layer has a capacity ceiling.
Readers who understand this routing architecture are better positioned to distinguish between a manageable logistics repricing event and a genuine supply volume crisis. That distinction shapes how energy-sector exposure should be sized, timed, and monitored in the weeks ahead.
Strategic petroleum reserve replenishment, war-risk insurance priced on actuarial rather than diplomatic timescales, and tanker repositioning lags all contribute to structural price floor mechanics that keep crude elevated even when geopolitical headlines soften, a pattern documented clearly in the weeks following the June 2026 ceasefire announcement.
This article is for informational purposes only and should not be considered financial advice. Investors should conduct their own research and consult with financial professionals before making investment decisions. Forward-looking statements regarding infrastructure capacity, futures market behaviour, and geopolitical developments are speculative and subject to change based on evolving conditions.