The Federal Reserve just raised interest rates for the first time in over three years, and the dot plot is telling markets this is not a one-off. Chair Kevin Warsh’s unanimous 12-0 decision to lift the federal funds target to 3.75%-4.00% landed with a clear message: inflation is still the primary concern, and the committee is not close to done.
Rate decisions of this character, a resumption of tightening after a long pause, do not move just one asset class. They reprice the relationship between cash, bonds, equities, and commodities at once, and for investors carrying any of these right now, understanding how a Fed rate hike impact travels through markets is not optional.
This maps the Fed’s rationale directly onto the market moves it has already triggered, then frames what the forward guidance means for Treasury yields, gold, and the dollar in the months ahead. The data is specific, and so are the implications.
Why the Fed pulled the trigger now, after three years of holding
The case for this hike was building in the data well before Warsh stepped to the podium. Inflation had shown no meaningful improvement over the summer, the economy remained resilient, and energy prices stayed stubbornly high. By the time the committee met on 16 September 2026, the harder question was arguably why not to move rather than why to move.
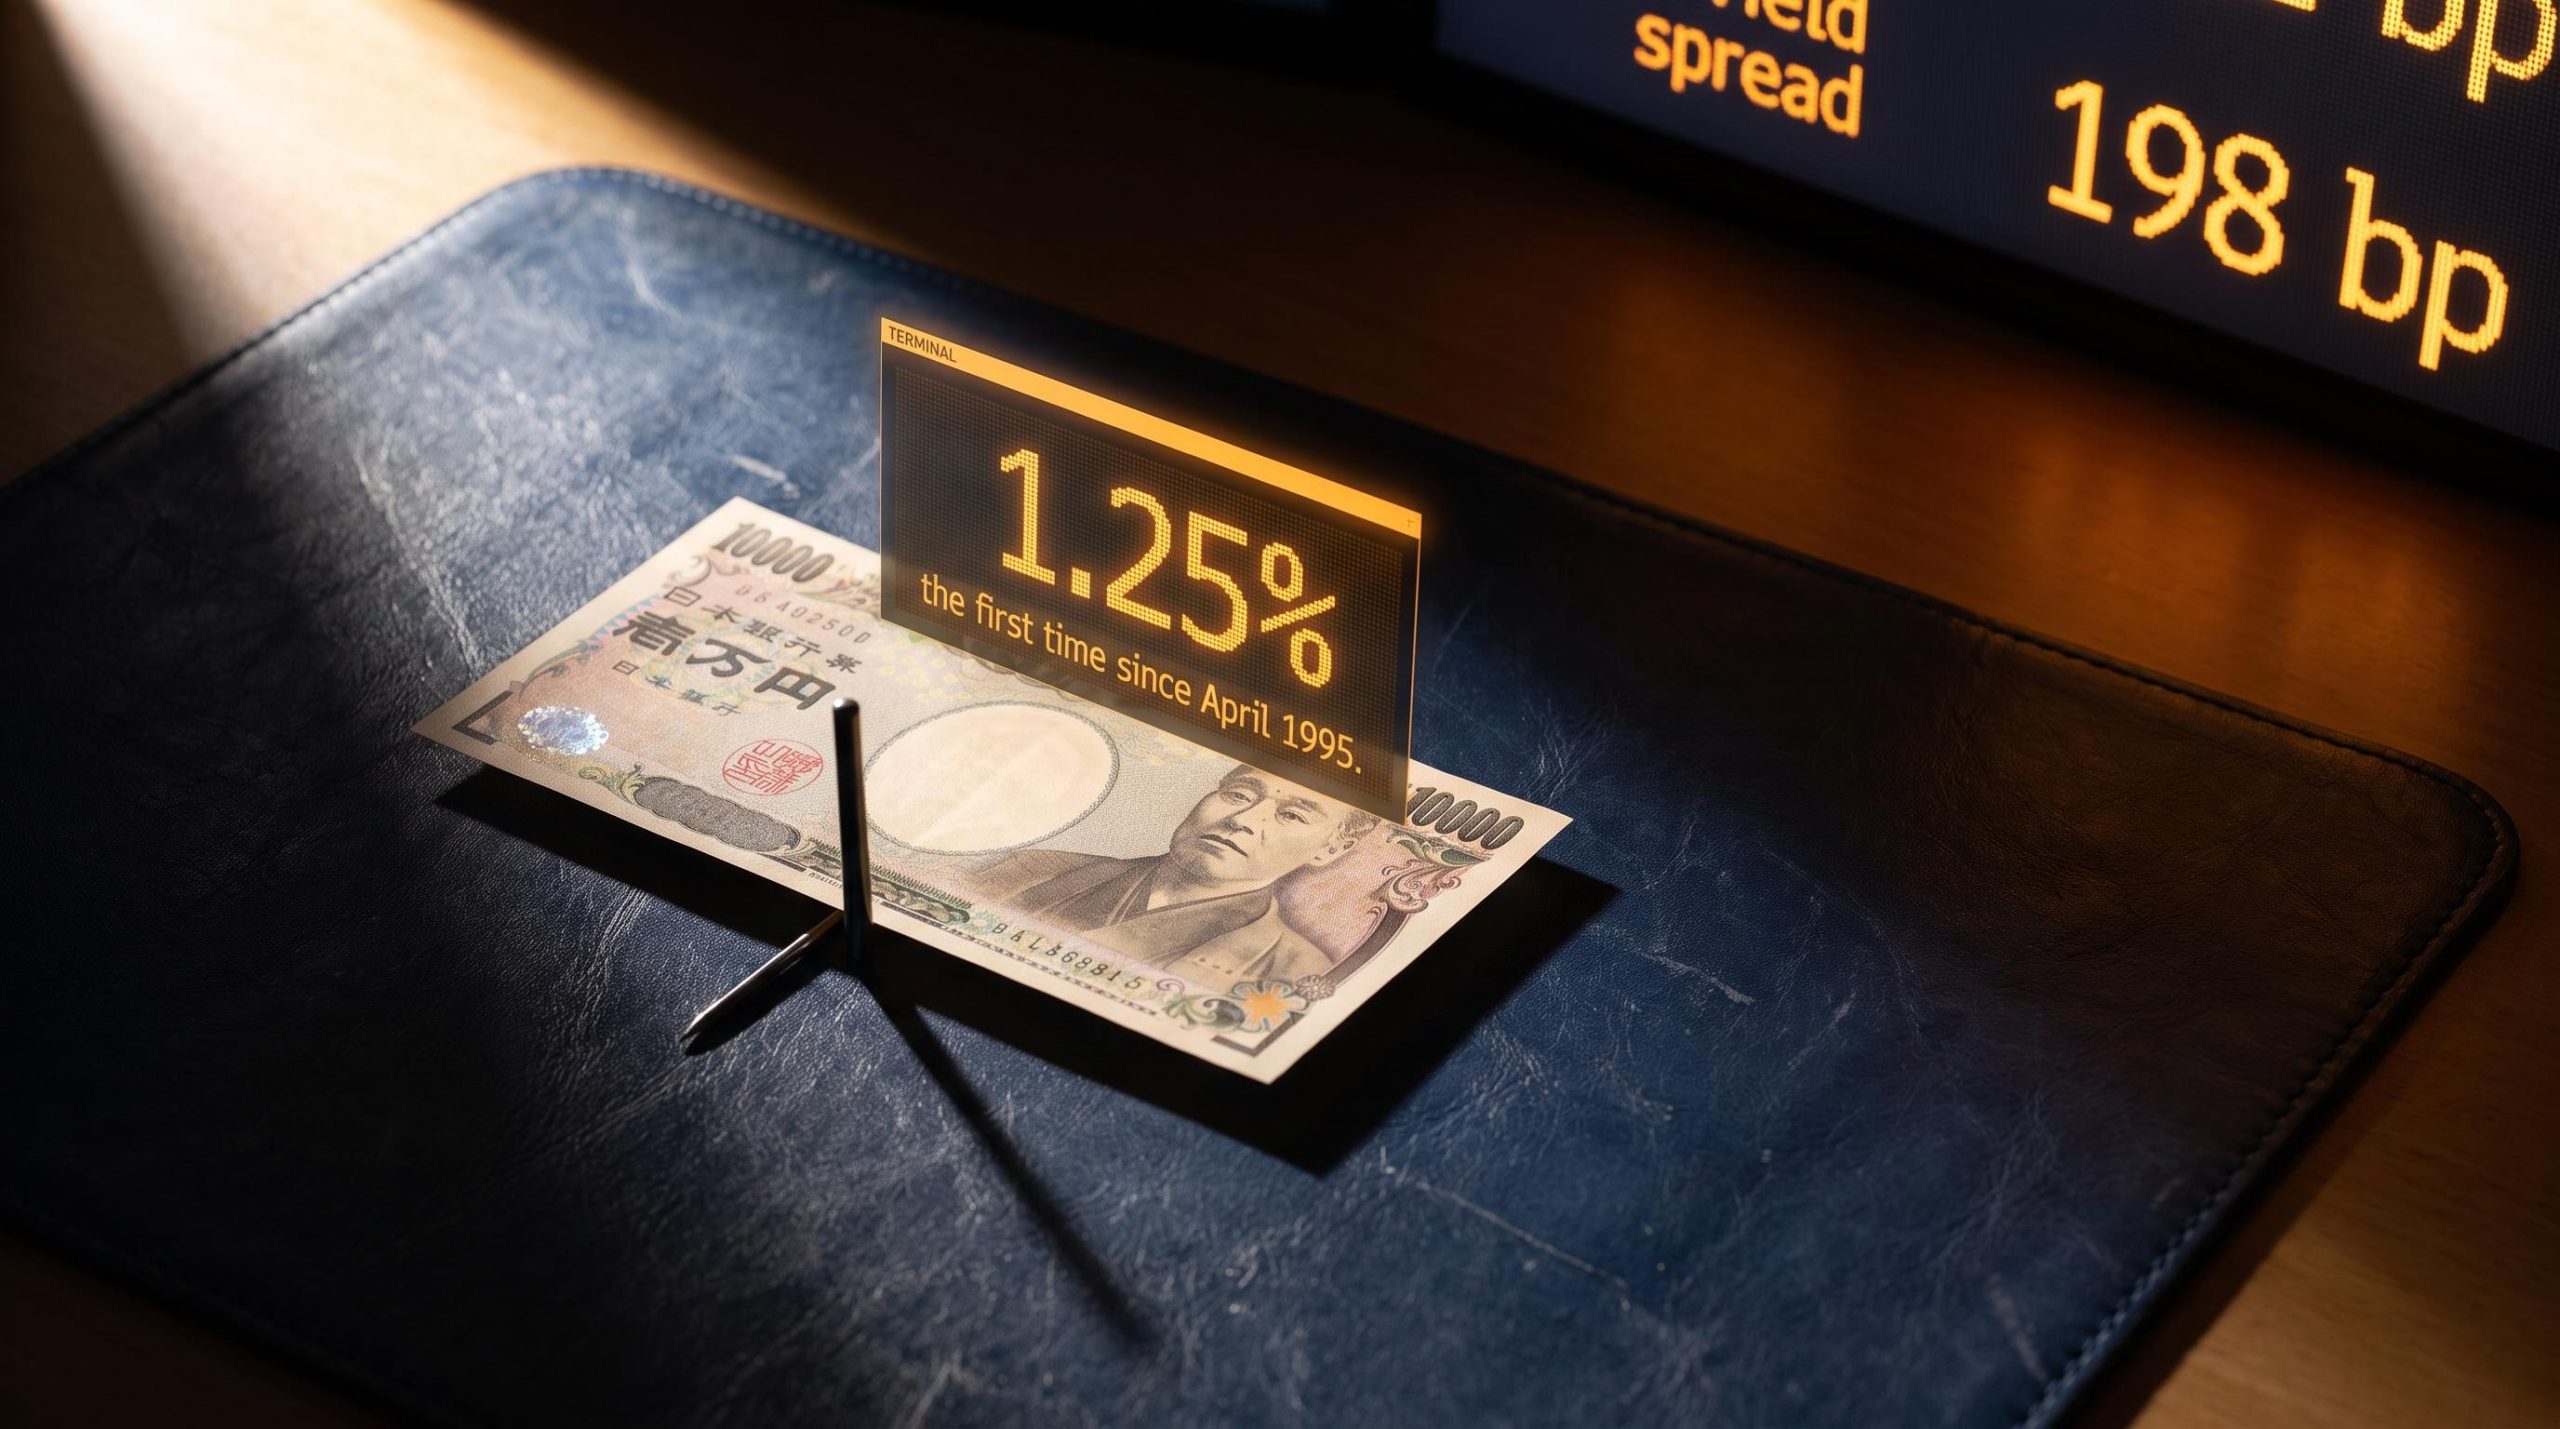
The decision itself was a 25 basis point increase, lifting the federal funds target range from 3.50%-3.75% to 3.75%-4.00%, effective 17 September 2026. It marked the first hike since July 2023.
The Federal Reserve’s official FOMC statement confirmed the 25 basis point increase and cited resilient demand, stalled inflation progress, and elevated energy prices as the committee’s primary justifications for resuming tightening after a three-year pause.
Warsh laid out four specific reasons for the move:
- A resilient US economy that continues to support demand-driven price pressure
- The absence of any meaningful improvement in inflation over the summer months
- Geopolitical factors adding to the inflationary environment
- Persistently elevated energy prices as a further upside risk to inflation
Reuters coverage noted that soaring oil prices in mid-September had sharpened inflation fears, reinforcing the committee’s tightening case in the days before the meeting. The energy story was not background noise; it was central to the decision.
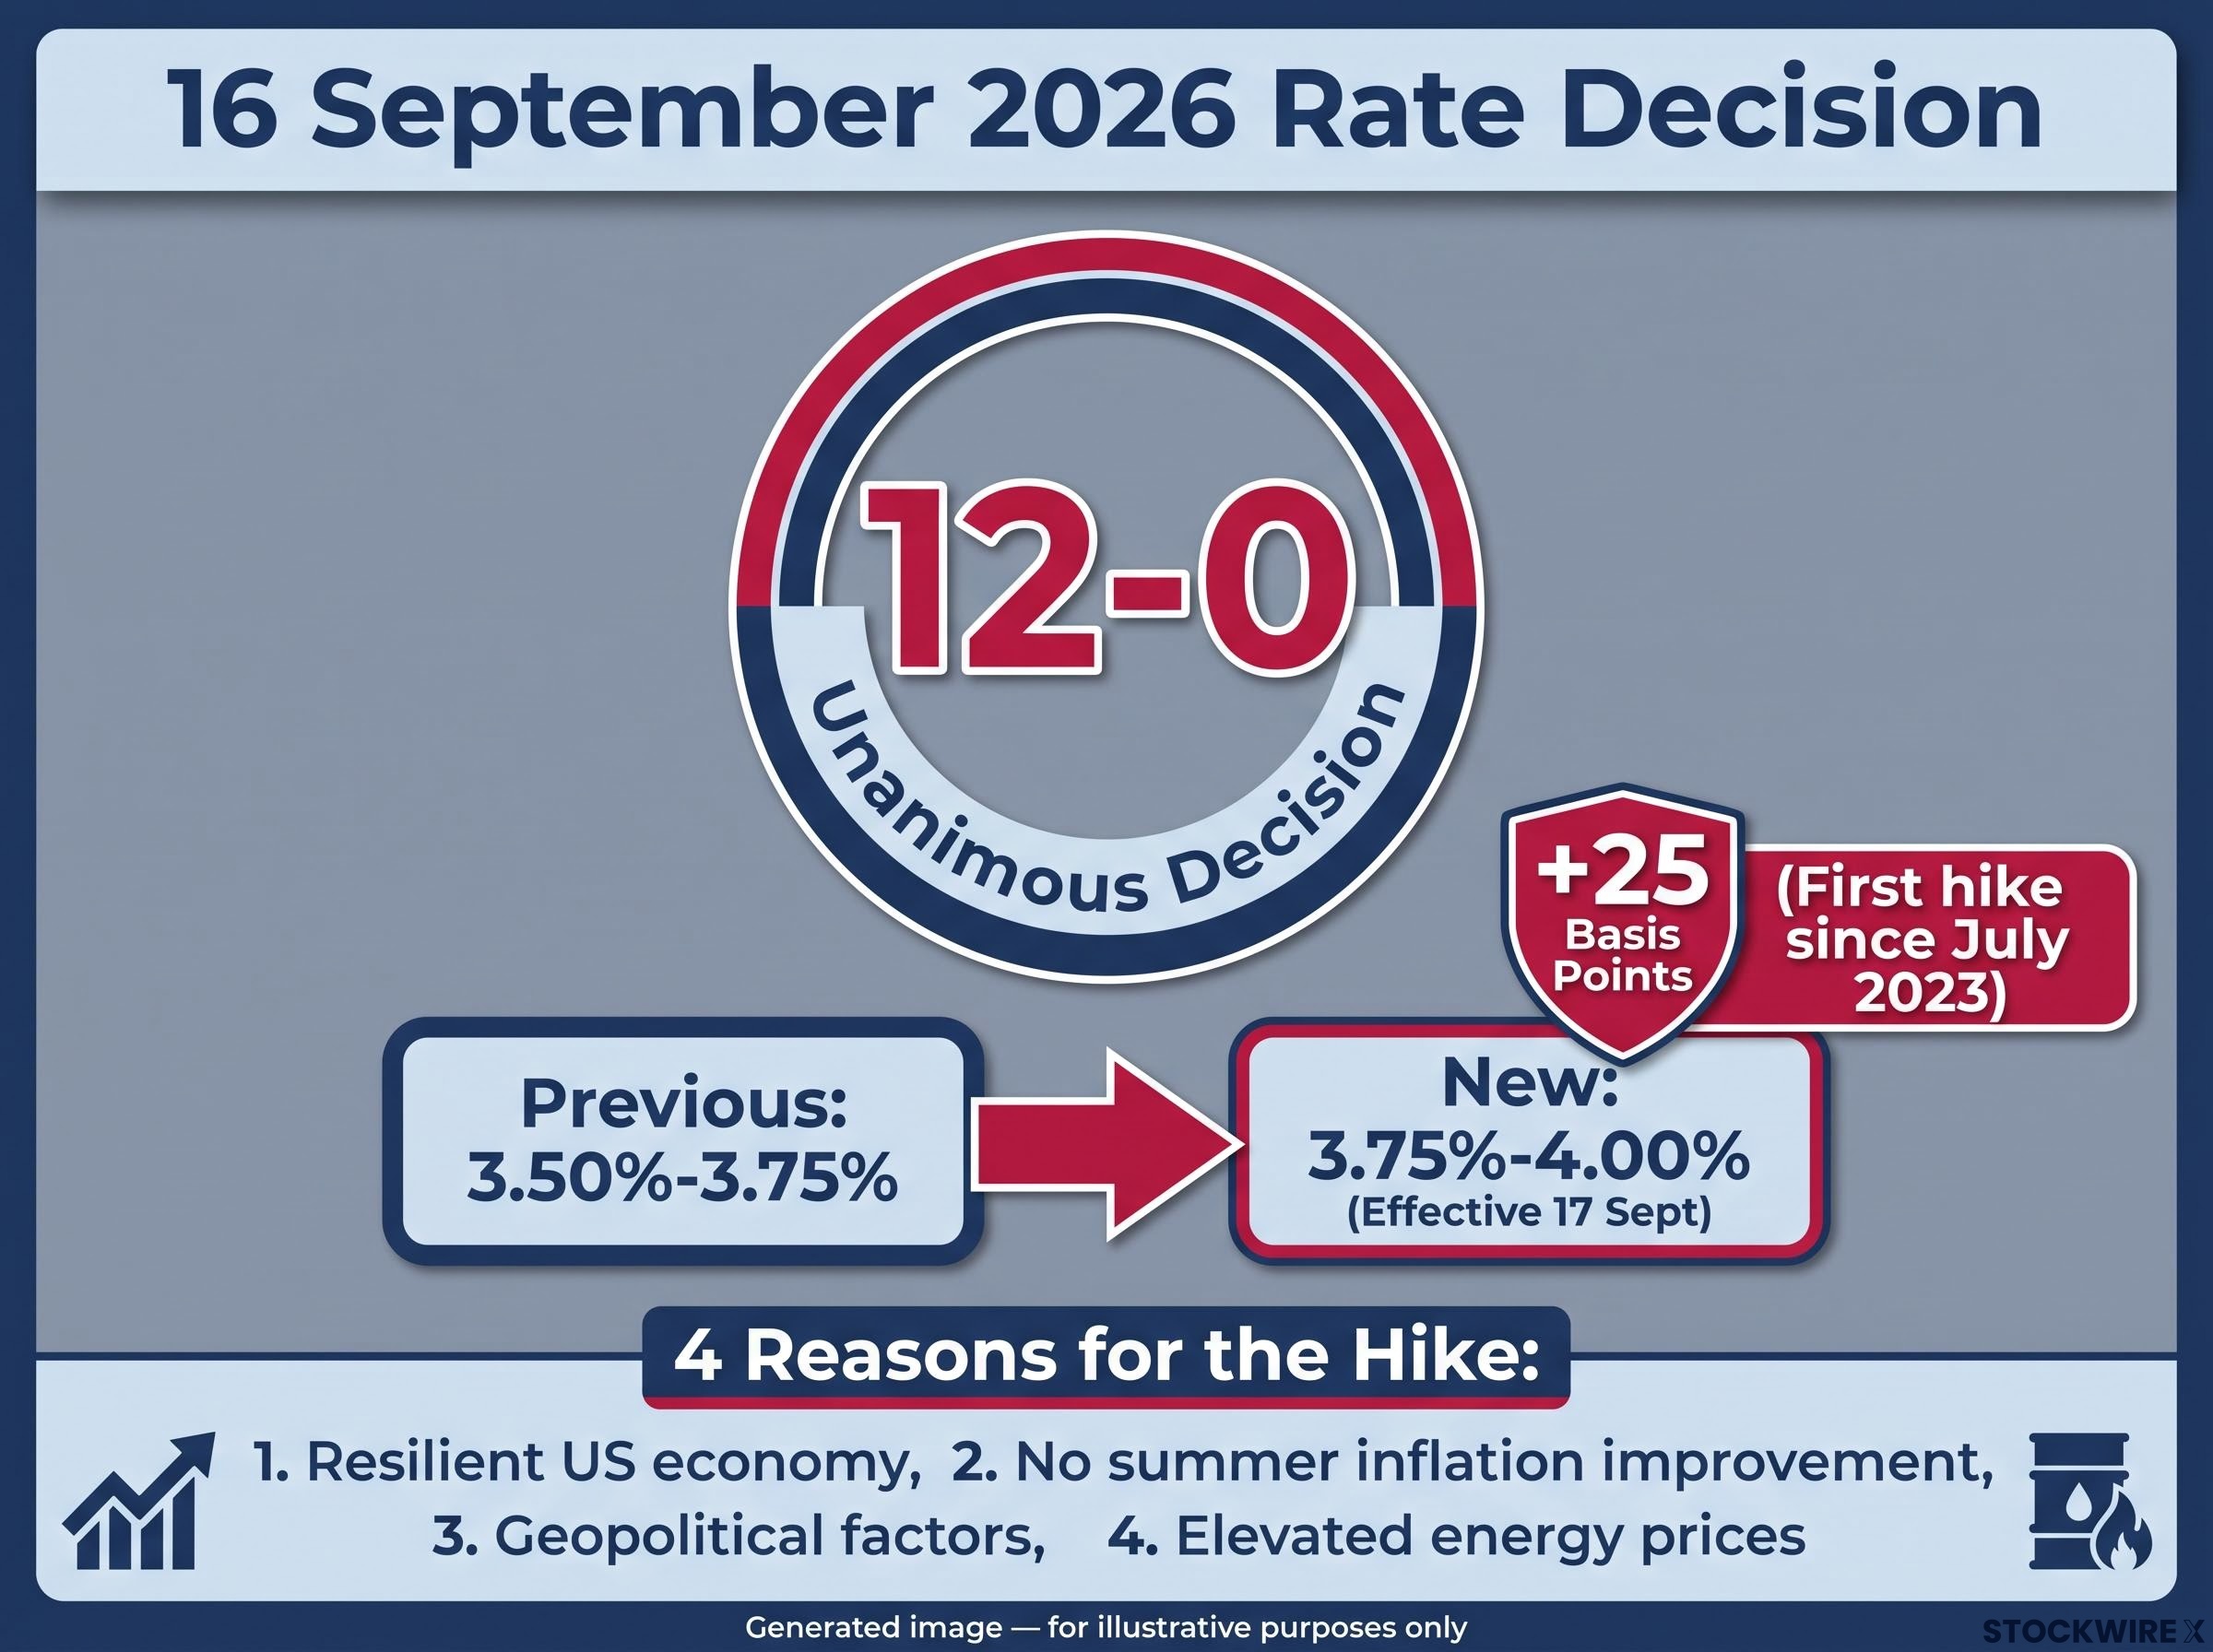
Then there was the vote. A 12-0 unanimous decision at a genuine pivot point is unusual, and it functions as a policy signal in its own right. Unanimity here tells you the committee is not split on the direction of travel, which sharply narrows the odds of a near-term reversal.
A unanimous 12-0 result stands in sharp contrast to the July 2026 dynamic, when the FOMC vote split nine-to-three represented the most internally divided committee in close to a decade, and the shift from deep division to full unanimity in a single meeting cycle is itself a policy signal about the committee’s settled conviction.
Crucially, the Fed did not frame this as a single corrective move. The posture is explicitly one of tightening and then holding.
The committee’s stated strategy is “higher for longer”: err on the side of tightening now, then hold rates elevated rather than rushing toward cuts.
A unanimous hawkish pivot after a three-year pause tells you the committee has collectively concluded that waiting carried more risk than acting. That reading matters, because it means you should weight the probability of further hikes well above the probability of a policy U-turn. Investors who fixate on the rate number alone miss the directional conviction underneath it.
When big ASX news breaks, our subscribers know first
What the dot plot is actually signaling about the rate path ahead
The rate number tells you what the Fed just did. The dot plot tells you what it intends to do next, and this one is unambiguous.
The dot plot is a chart within the Summary of Economic Projections (SEP), where each committee participant marks where they expect the federal funds rate to sit at the end of upcoming years. Read together, the dots reveal the committee’s collective thinking about the path ahead, not just its most recent action.
For end-2026, the median projection landed at approximately 4.1%, up from 3.8% in the June projections. That upward revision alone implies at least one more 25 basis point hike before the year closes.
The participant distribution is where the conviction becomes visible.
| Projected end-2026 rate | Number of participants | Implied additional hikes from September |
|---|---|---|
| 4.375% | 4 | Two more |
| 4.125% | 12 | One more |
| 3.875% | 2 | None |
Read down that table and the weight accumulates. The bulk of the committee, twelve of eighteen, expects one more hike this year. Four want two more. Only two see the September move as the last.
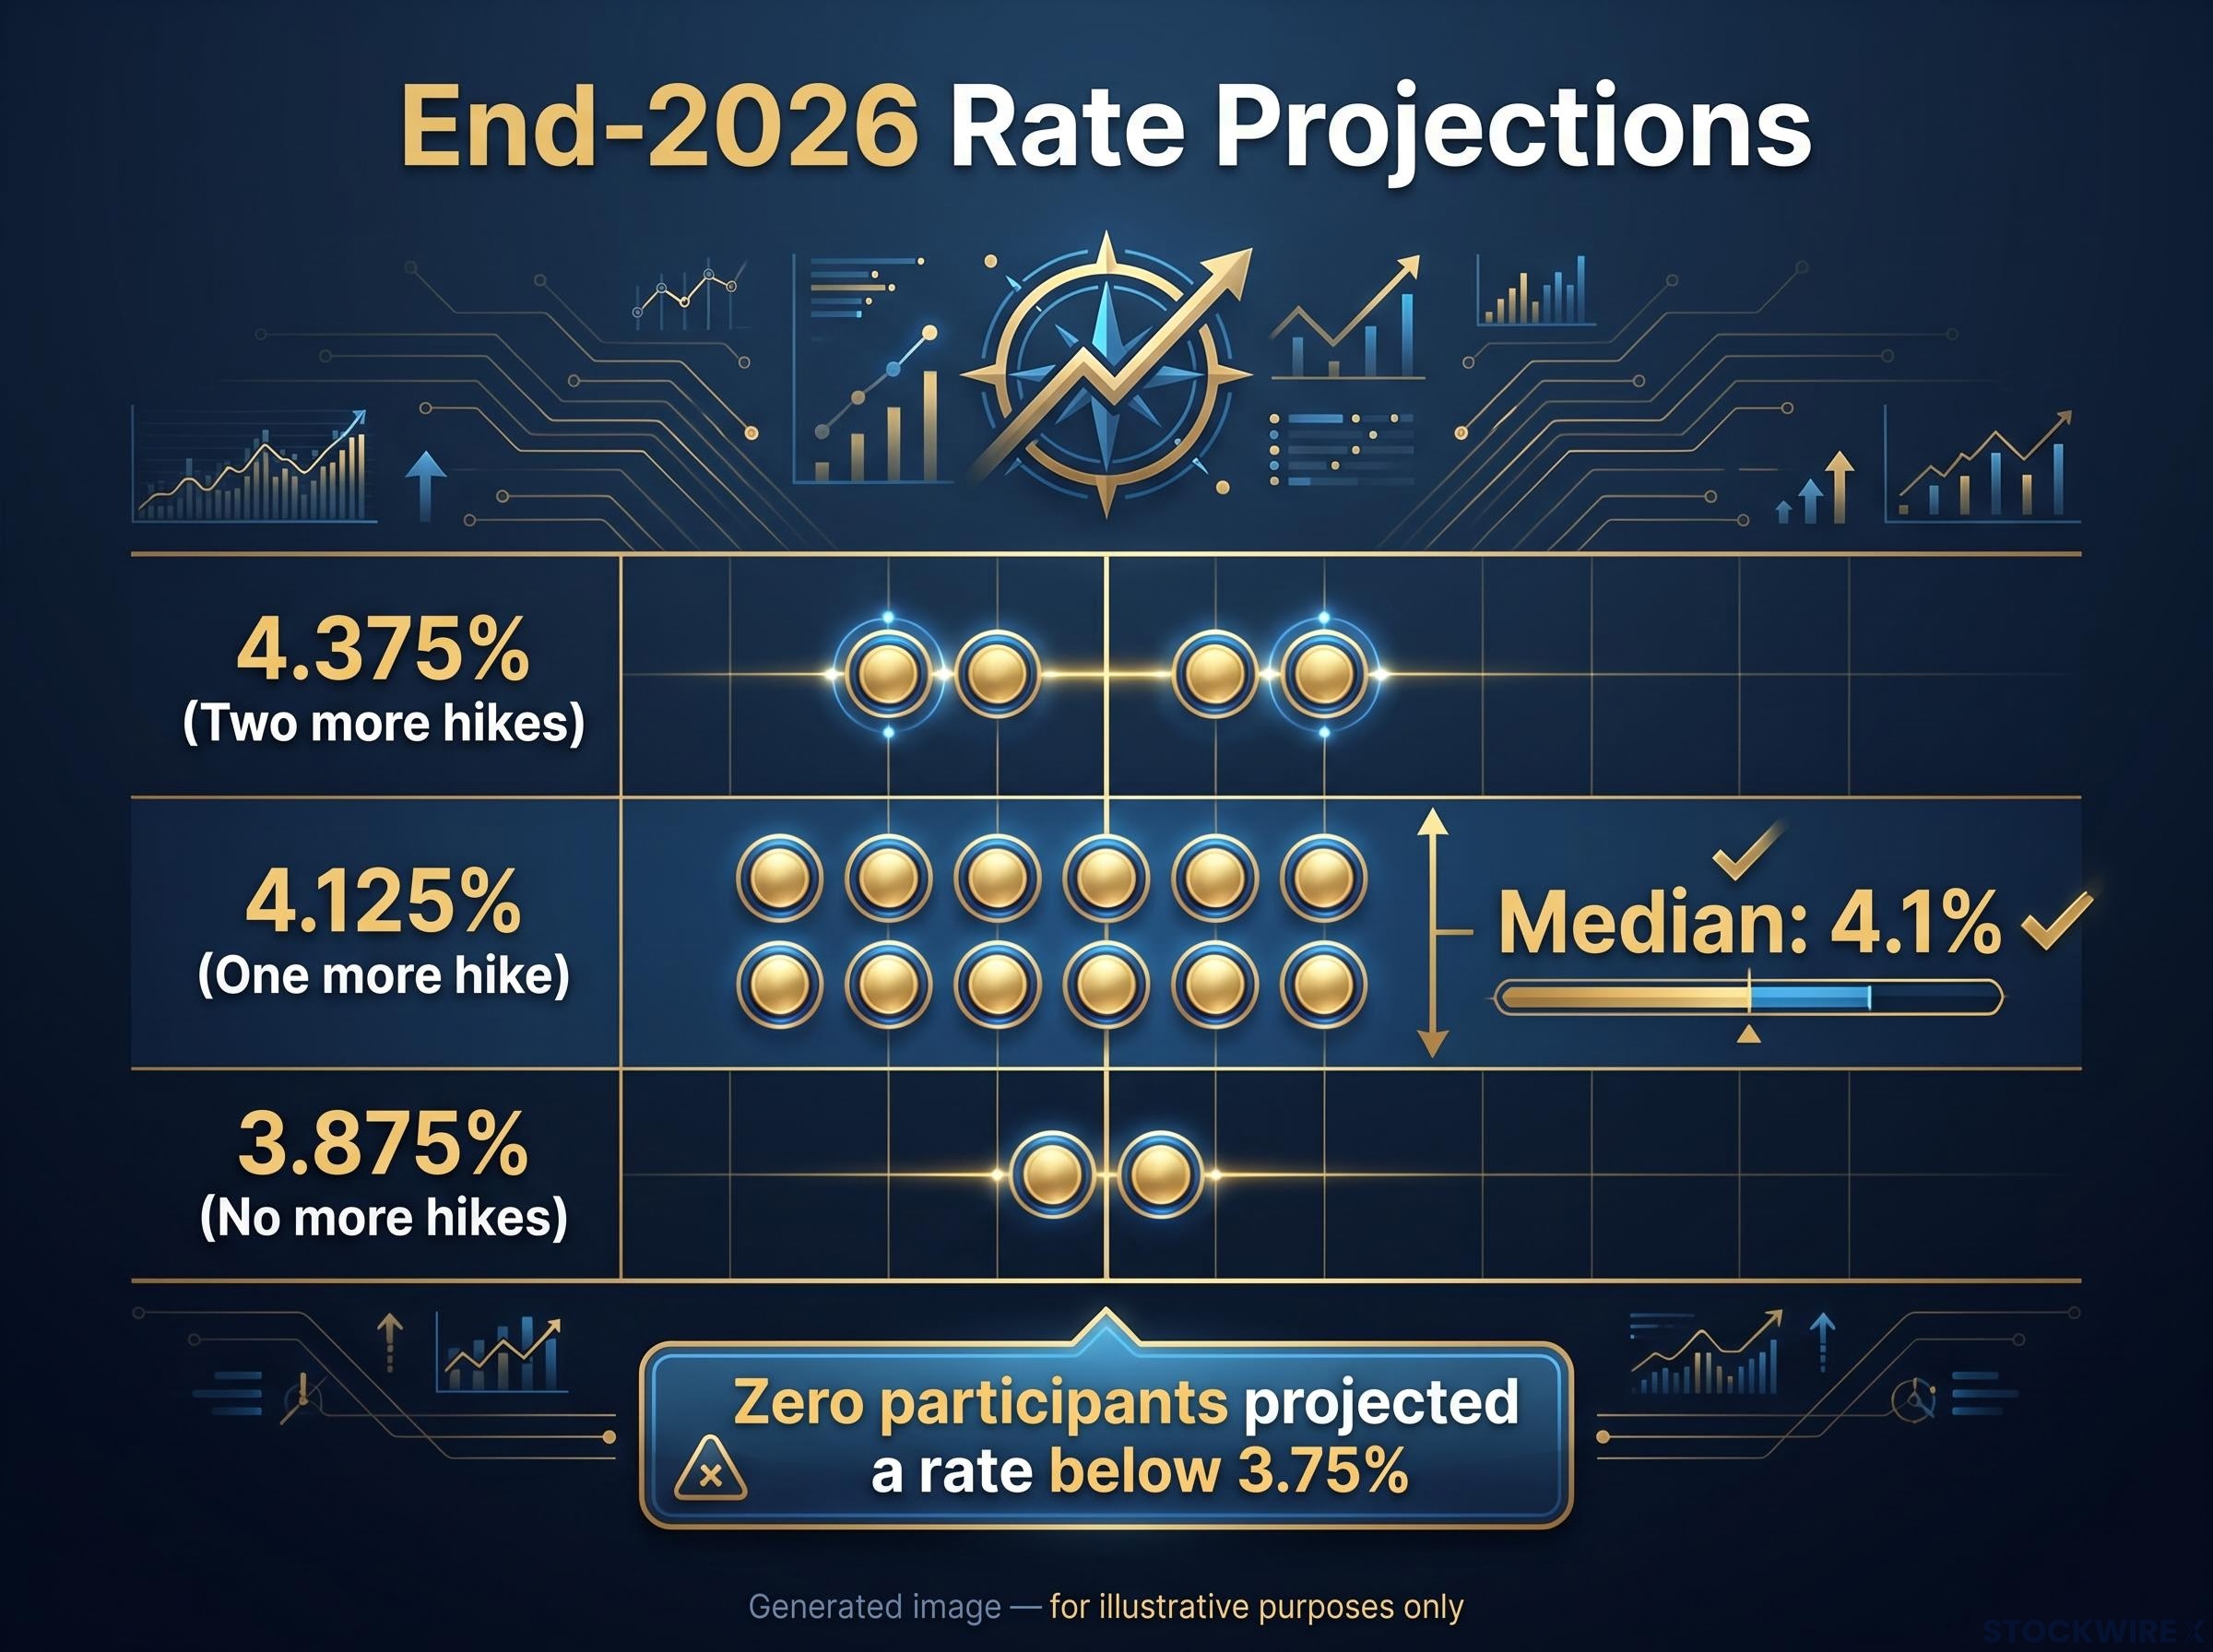
Here is the number that matters most: not a single participant projected a year-end rate below 3.75%, where rates already sit. There is no dot pointing toward a near-term cut. That is a harder commitment than the headline median conveys, because it removes the floor entirely.
The 2027 projection shift that changes the calculus
The June SEP had penciled in at least one cut for 2027. The September SEP removed it.
The median now holds flat at approximately 4.1% at both end-2026 and end-2027. That is not a brief tightening cycle followed by relief; it is a prolonged hold with a specific timeline attached. Kiplinger’s reads the projections as pointing to two additional hikes in total, one more in 2026 and one in 2027, before any easing begins.
Higher for longer now has a date on it. Any portfolio thesis built around a Fed pivot arriving before at least late 2027 is running against the committee’s own published projections, and that is the single most important recalibration this SEP demands.
How the rate decision is moving Treasury yields, gold, and the dollar
One Fed decision, three markets, one story. The clearest place to watch it unfold is the 10-year Treasury yield, the primary channel through which the Fed’s policy stance reaches equities and credit.
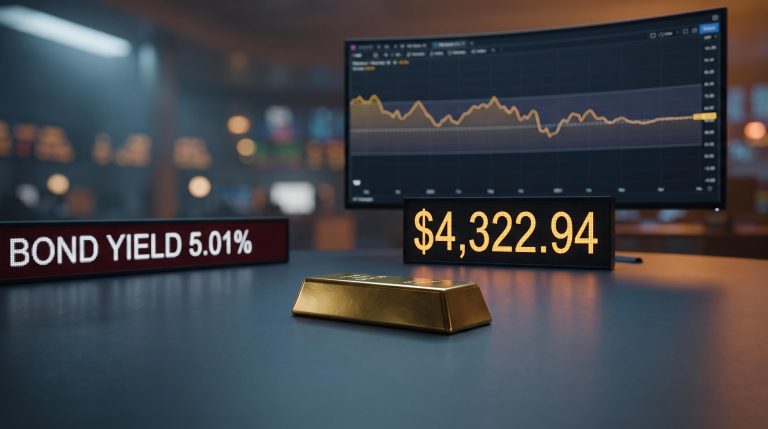
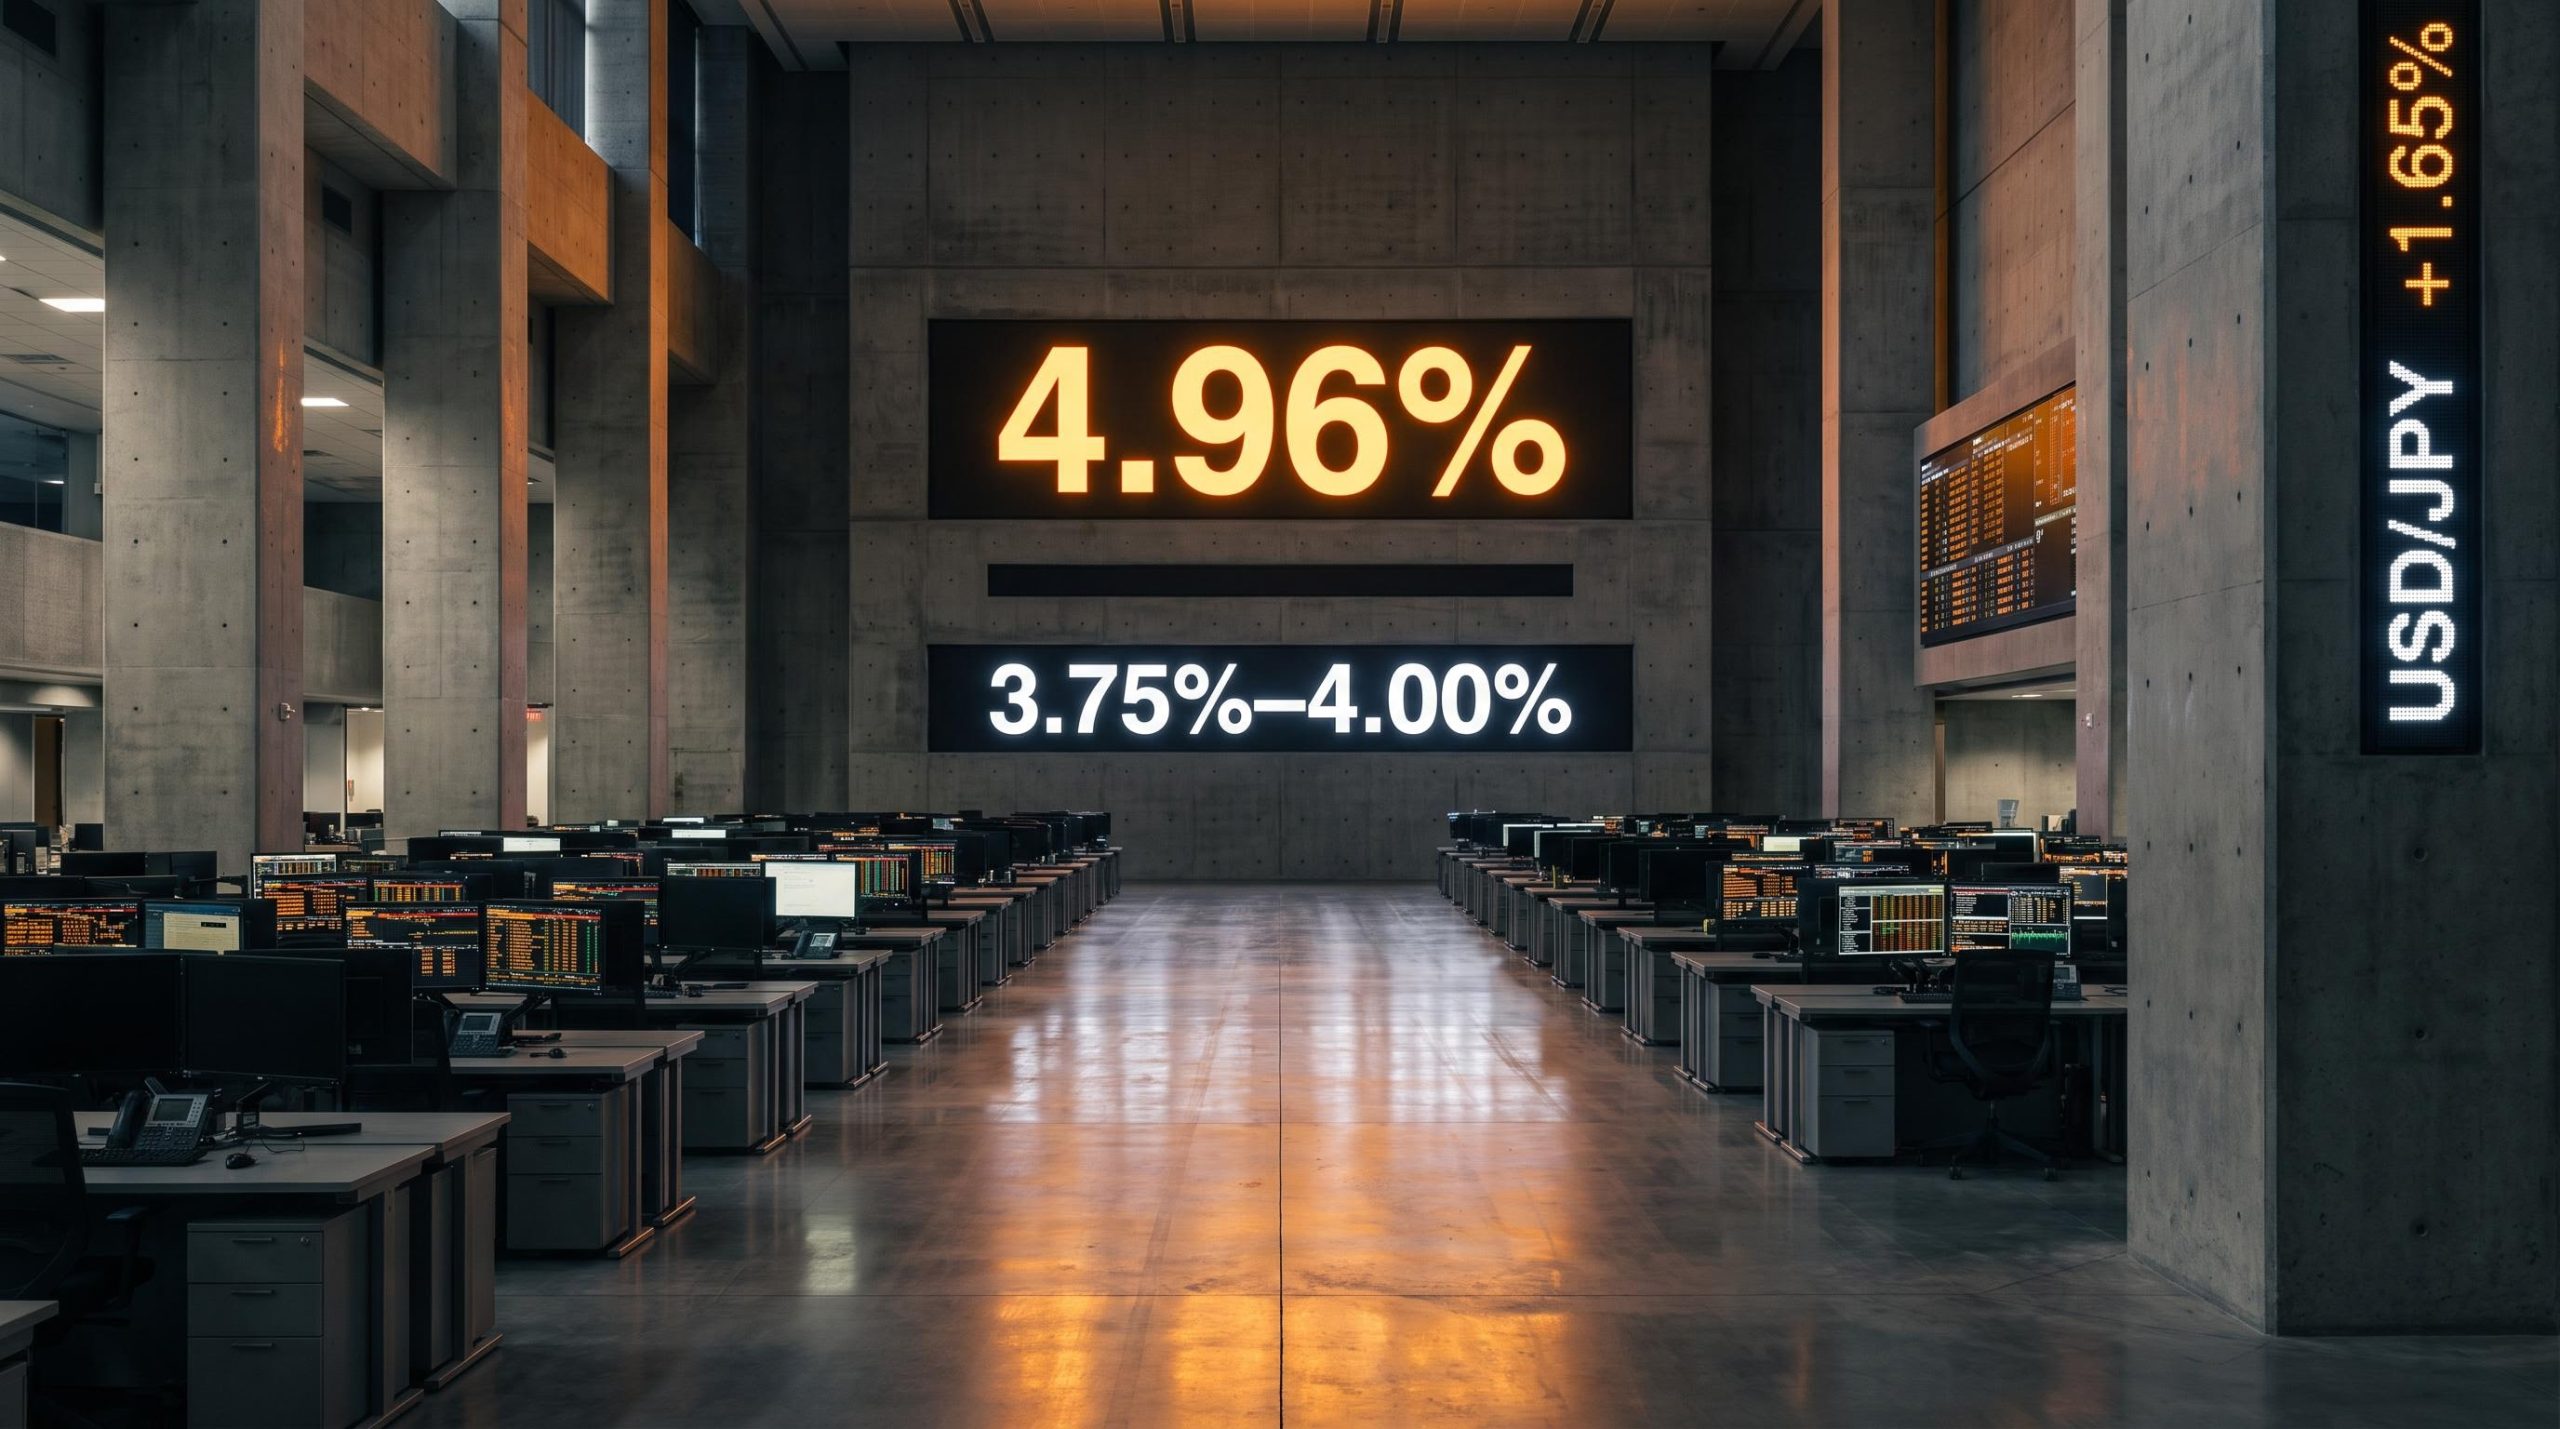
That yield has been pressing against 5.0%, a level not seen in nearly two decades. As of late morning on 16 September 2026, MarketScreener reported it at approximately 4.96%. The day before, per Reuters, it touched an intraday high of 5.041%, the highest since 2007.
The 4.96% intraday reading on 16 September was not an isolated data point; the Treasury yield dynamics driving that level had been building across four simultaneous forces for weeks, including a hotter core CPI print, fiscal deficit anxiety, and curve-wide selling that a single Fed meeting could clarify but not fully resolve.
The 2007 reference is not incidental. It invokes pre-Global Financial Crisis conditions as the benchmark for how unusual this rate environment has become, and it explains why analysts are watching the 5% line so closely.
Analysts cited by Reuters describe 5% as a “closely watched psychological threshold,” warning that yields at that level could ripple through the US economy and threaten the bull market in stocks by denting the relative appeal of US equities.
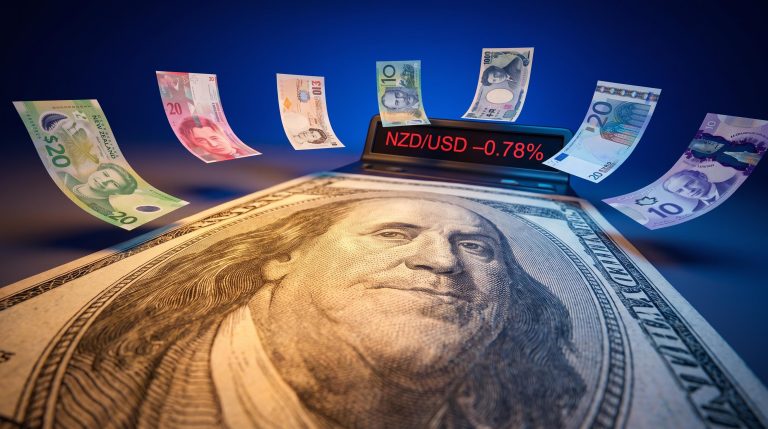
If bonds are repricing the rate path, the dollar is capturing the yield differential, and it did so with speed. The USD reached its highest point since late July on the hawkish stance, and it strengthened against every major pair on the board.
| Currency pair | USD weekly gain (%) |
|---|---|
| USD/JPY | +1.65% |
| USD/NZD | +1.64% |
| USD/EUR | +1.22% |
| USD/CHF | +1.20% |
| USD/GBP | +1.17% |
| USD/CAD | +0.88% |
| USD/AUD | +0.85% |
The Japanese Yen took the steepest hit. A broad, uniform advance like this tells you currency markets did not hesitate; they priced the higher-for-longer signal in full and moved as one.
When the 10-year touches 5%, the dollar strengthens across every major pair, and gold cannot hold above a key level all at once, you are not watching three separate events. You are watching one Fed decision express itself across asset classes in real time.
Gold’s tug-of-war between rate headwinds and geopolitical support
Gold sat awkwardly in the middle of all this. As of 16 September 2026, Bloomberg quoted spot XAU/USD at approximately $4,264 per ounce, down from $4,349 on 11 September. Shortly after the Fed announcement the prior day, gold slipped to an intraday low near $4,235, a six-week depth.
Two forces are pulling in opposite directions. Higher real yields and a stronger dollar push gold lower, since bullion pays no yield and becomes more expensive for non-US buyers as the dollar climbs. Working against that, heightened geopolitical tension in the Middle East is keeping a safe-haven bid alive.
The tell was gold’s failure to reclaim $4,300. According to FXStreet analysis by Haresh Menghani, buyers attracted limited interest in Asian trading but could not establish acceptance above that level, leaving the recovery attempt stalled.
That leaves three competing reads on where gold heads next: one camp expects sustained pressure while real yields stay elevated; another sees a durable geopolitical floor holding firm; a third anticipates range-bound trading until the Fed’s forward guidance shifts. What you should take from this is that gold’s direction is now hostage to whichever of those forces wins out, and neither has yet.
The mechanics behind the moves (and why they connect the way they do)
Everything above traces back to a single decision. Follow the chain of cause and effect, and the scattered price moves resolve into one coherent system. Three channels do the work.
- The opportunity-cost channel. Higher nominal yields raise the hurdle rate for every risk asset, because investors can now earn more from cash and short-term bonds with far less risk. That same rise increases the real cost of holding non-yielding assets like gold, which is why bullion struggled the moment yields climbed.
- The dollar-yield differential channel. When US yields rise faster than yields abroad, global capital flows toward dollar-denominated assets in search of the better return. That inflow pushes the dollar higher, which in turn makes gold more expensive for overseas buyers and adds a second, indirect layer of pressure on the metal.
- The equity valuation channel. As the risk-free rate marches toward 5%, the discount rates used in equity valuation models rise, and higher discount rates compress price-to-earnings multiples. This is precisely why the 5% line draws such outsized attention from equity analysts.
Reuters analysts captured the stakes plainly, warning that yields at 5% could ripple through the US economy and threaten the bull market in stocks by denting the relative appeal of US equities. Downstream, elevated long-term rates feed into higher corporate bond yields and tighter credit across the economy.
Notice how one risk factor works through multiple channels at once. Geopolitics and energy prices sit at the centre of Warsh’s inflation rationale, and the same tension provides gold’s safe-haven support. The identical force pressures the Fed toward tightening while lending gold a floor.
The IEA characterised geopolitical oil risk from Middle East tensions as a persistent structural upside risk rather than a transient spike, which is precisely why it sits at the centre of both Warsh’s inflation rationale and gold’s safe-haven bid simultaneously, the same force pulling the Fed toward tightening while lending the metal a floor.
Once you grasp that a single hike simultaneously raises the discount rate for equities, strengthens the dollar through yield differentials, and lifts the opportunity cost of holding gold, you can read the next rate decision’s market impact before the price data even lands. That is the difference between waiting for commentary and interpreting the move yourself.
What the rate path ahead means for your portfolio positioning
The framework is only useful if you act on it, so here is what the September projections actually change. The dot plot’s message is not a temporary disruption to wait out; it is a durable constraint. No participant sees a rate below 3.75% at year-end 2026, and the median holds at 4.1% through end-2027.
That reshapes each asset class in a specific way:
- Bonds: With the 10-year near 4.96% and pressing the 5% threshold that analysts tie to valuation compression, duration risk is real. Long-dated bonds carry genuine price risk until inflation data shifts the committee’s view.
- Dollar-exposed international equities: A stronger dollar and higher US yields tighten financial conditions globally. Investors with international exposure, particularly in emerging markets, should expect that spillover to persist while the yield differential favours US assets.
- Gold: At around $4,264, with resistance capping near $4,300 and support tested near $4,235, gold faces a structural rate headwind partly offset by geopolitical demand. Its role as a hedge is intact, but its upside is constrained while real yields stay high.
The “wait for the Fed to pivot” strategy now has a quantified timeline problem. No participant sees cuts before at least late 2027, so any positioning built on an earlier pivot is built on a foundation the Fed itself has publicly rejected.
Two variables could rewrite this analysis. The first is incoming inflation data, energy prices above all, since a sustained easing there would soften the committee’s resolve. The second is any change in the dot plot distribution at the coming meetings; a single migration of dots downward would signal a shift the current projections do not contain.
This article is for informational purposes only and should not be considered financial advice. Investors should conduct their own research and consult with financial professionals before making investment decisions. Past performance does not guarantee future results, and financial projections are subject to market conditions and various risk factors.
Making an informed call in a rate-plateau environment
The September hike is not a standalone event. It is the first confirmed step in a documented, committee-endorsed plateau that runs through at least end-2027, and the unanimous vote plus the vanished 2027 cut make that intention hard to misread. Bonds are repricing the path, the dollar is banking the yield advantage, and gold is caught between rate pressure and safe-haven demand, all flowing from the same source.
The one genuine uncertainty is worth naming clearly. Energy prices and geopolitical risk are the same force driving both the Fed’s tightening rationale and gold’s safe-haven bid, so a material move in either would cascade across every asset covered here. The productive stance is to watch the specific triggers rather than wait passively: the dot plot at the coming meetings, the next CPI prints, the direction of energy prices, and where the 10-year yield settles relative to 5%. Those four are what will tell you whether the plateau holds or the story turns.
For investors who want a structured framework beyond the asset-class snapshots above, our dedicated guide to positioning in a high-rate environment covers a five-step approach across equities, bonds, and property that is designed to perform across multiple rate outcomes without requiring a precise call on the Fed’s next move.