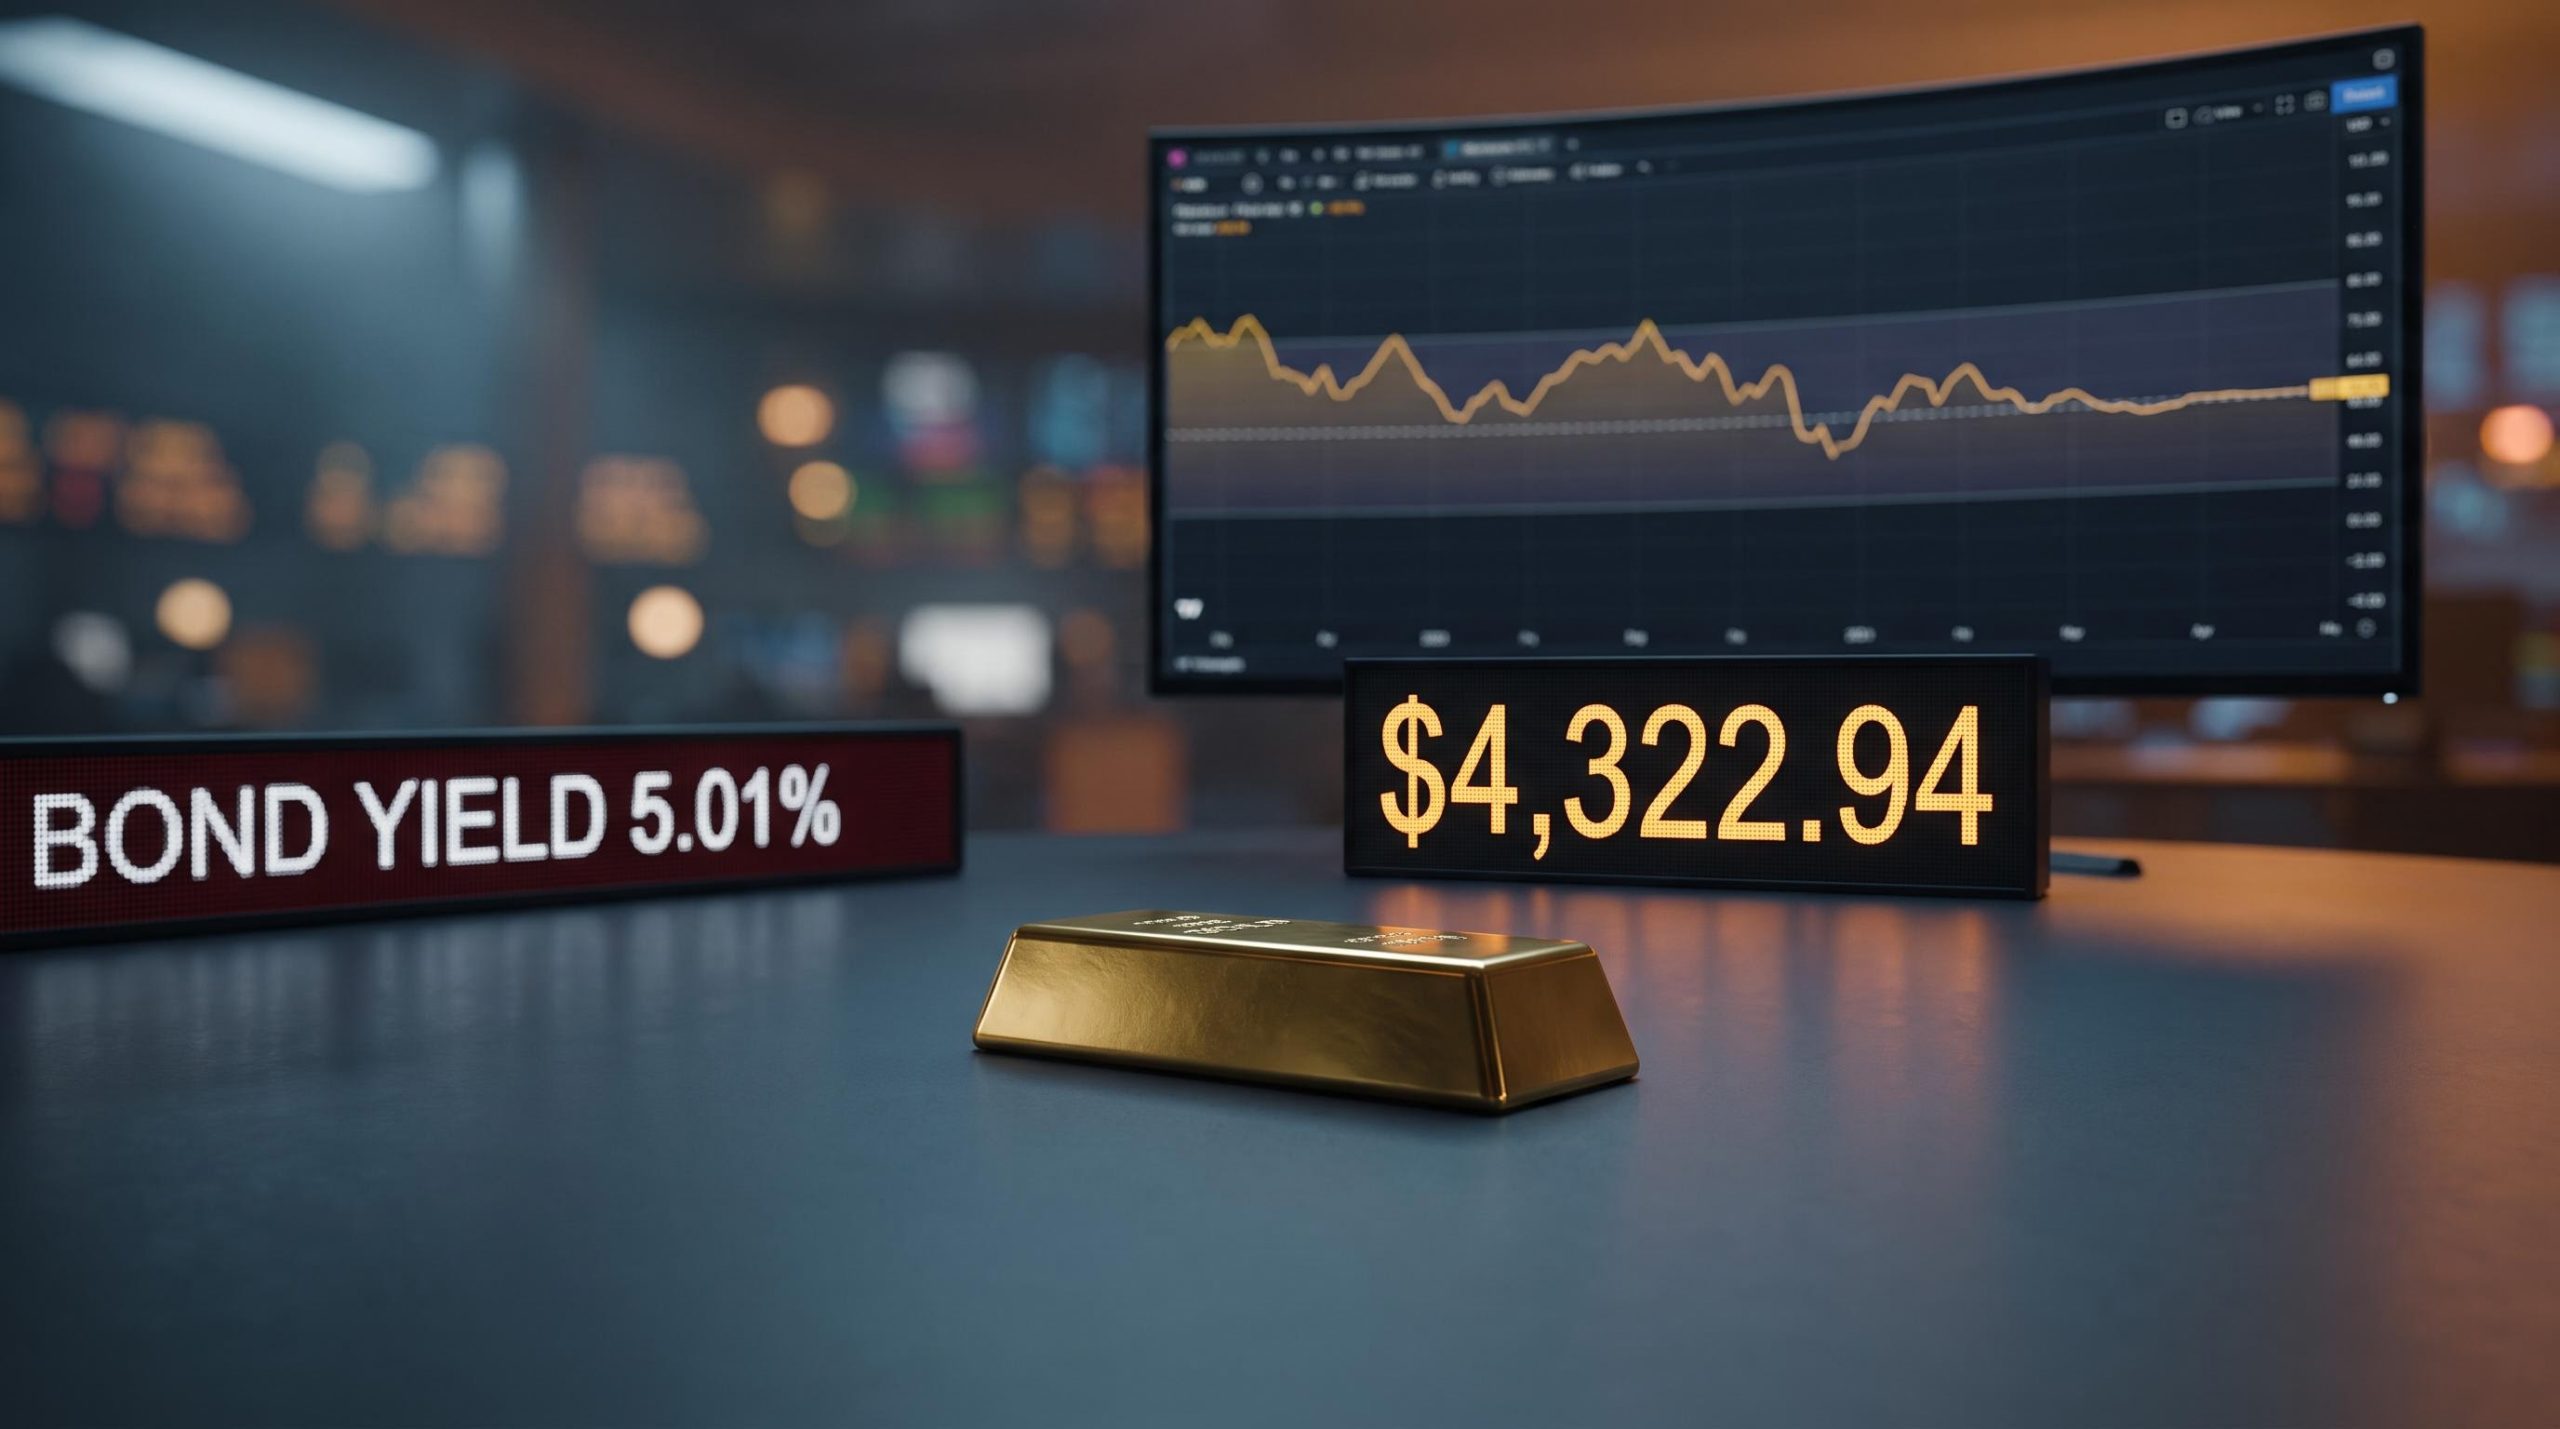
Gold is trading in the low-to-mid $4,300s with a daily RSI sitting almost dead flat near 48 and a Federal Reserve decision only hours away. That combination, a metal wedged into a tight range with no momentum and a market-moving event looming, is not a picture of confidence in either direction.
The tension has a source. The 10-year Treasury yield has crossed 5% for the first time since late 2023, markets are pricing in a 25 basis point rate hike, and gold is caught between two forces that rarely share the same room without friction: safe-haven demand from an active Middle East conflict on one side, and the structural drag of rising real rates on the other.
This gold price analysis lays out the technical levels that actually matter, the macro forces pulling in opposite directions, and the three things worth watching when the Fed speaks. By the time you finish, you will know which signals tell you the yield headwind is winning and which tell you the safe-haven floor is holding.
What the charts are telling you about gold right now
Where price sits right now
Look across the major platforms and the story is consistency, not confusion. Bloomberg quoted spot gold at $4,322.94 on 15 September 2026. Investing.com had it at $4,342.97, TradingView at $4,297.945, and CoinGecko at $4,286.33. FXStreet’s daily chart, in the European session, put XAU/USD at $4,341.86.
| Source | Gold spot price | Date |
|---|---|---|
| Bloomberg | $4,322.94 | 15 September 2026 |
| Investing.com | $4,342.97 | 15 September 2026 |
| TradingView | $4,297.945 | 15 September 2026 |
| CoinGecko | $4,286.33 | 15 September 2026 |
| FXStreet (daily chart) | $4,341.86 | European session |
That roughly $56 spread between the highest and lowest quote is not a data problem. It reflects different feeds and timestamps around a price that is genuinely going nowhere fast. This is consolidation, the market holding its breath rather than picking a fight.
What the moving averages and RSI reveal
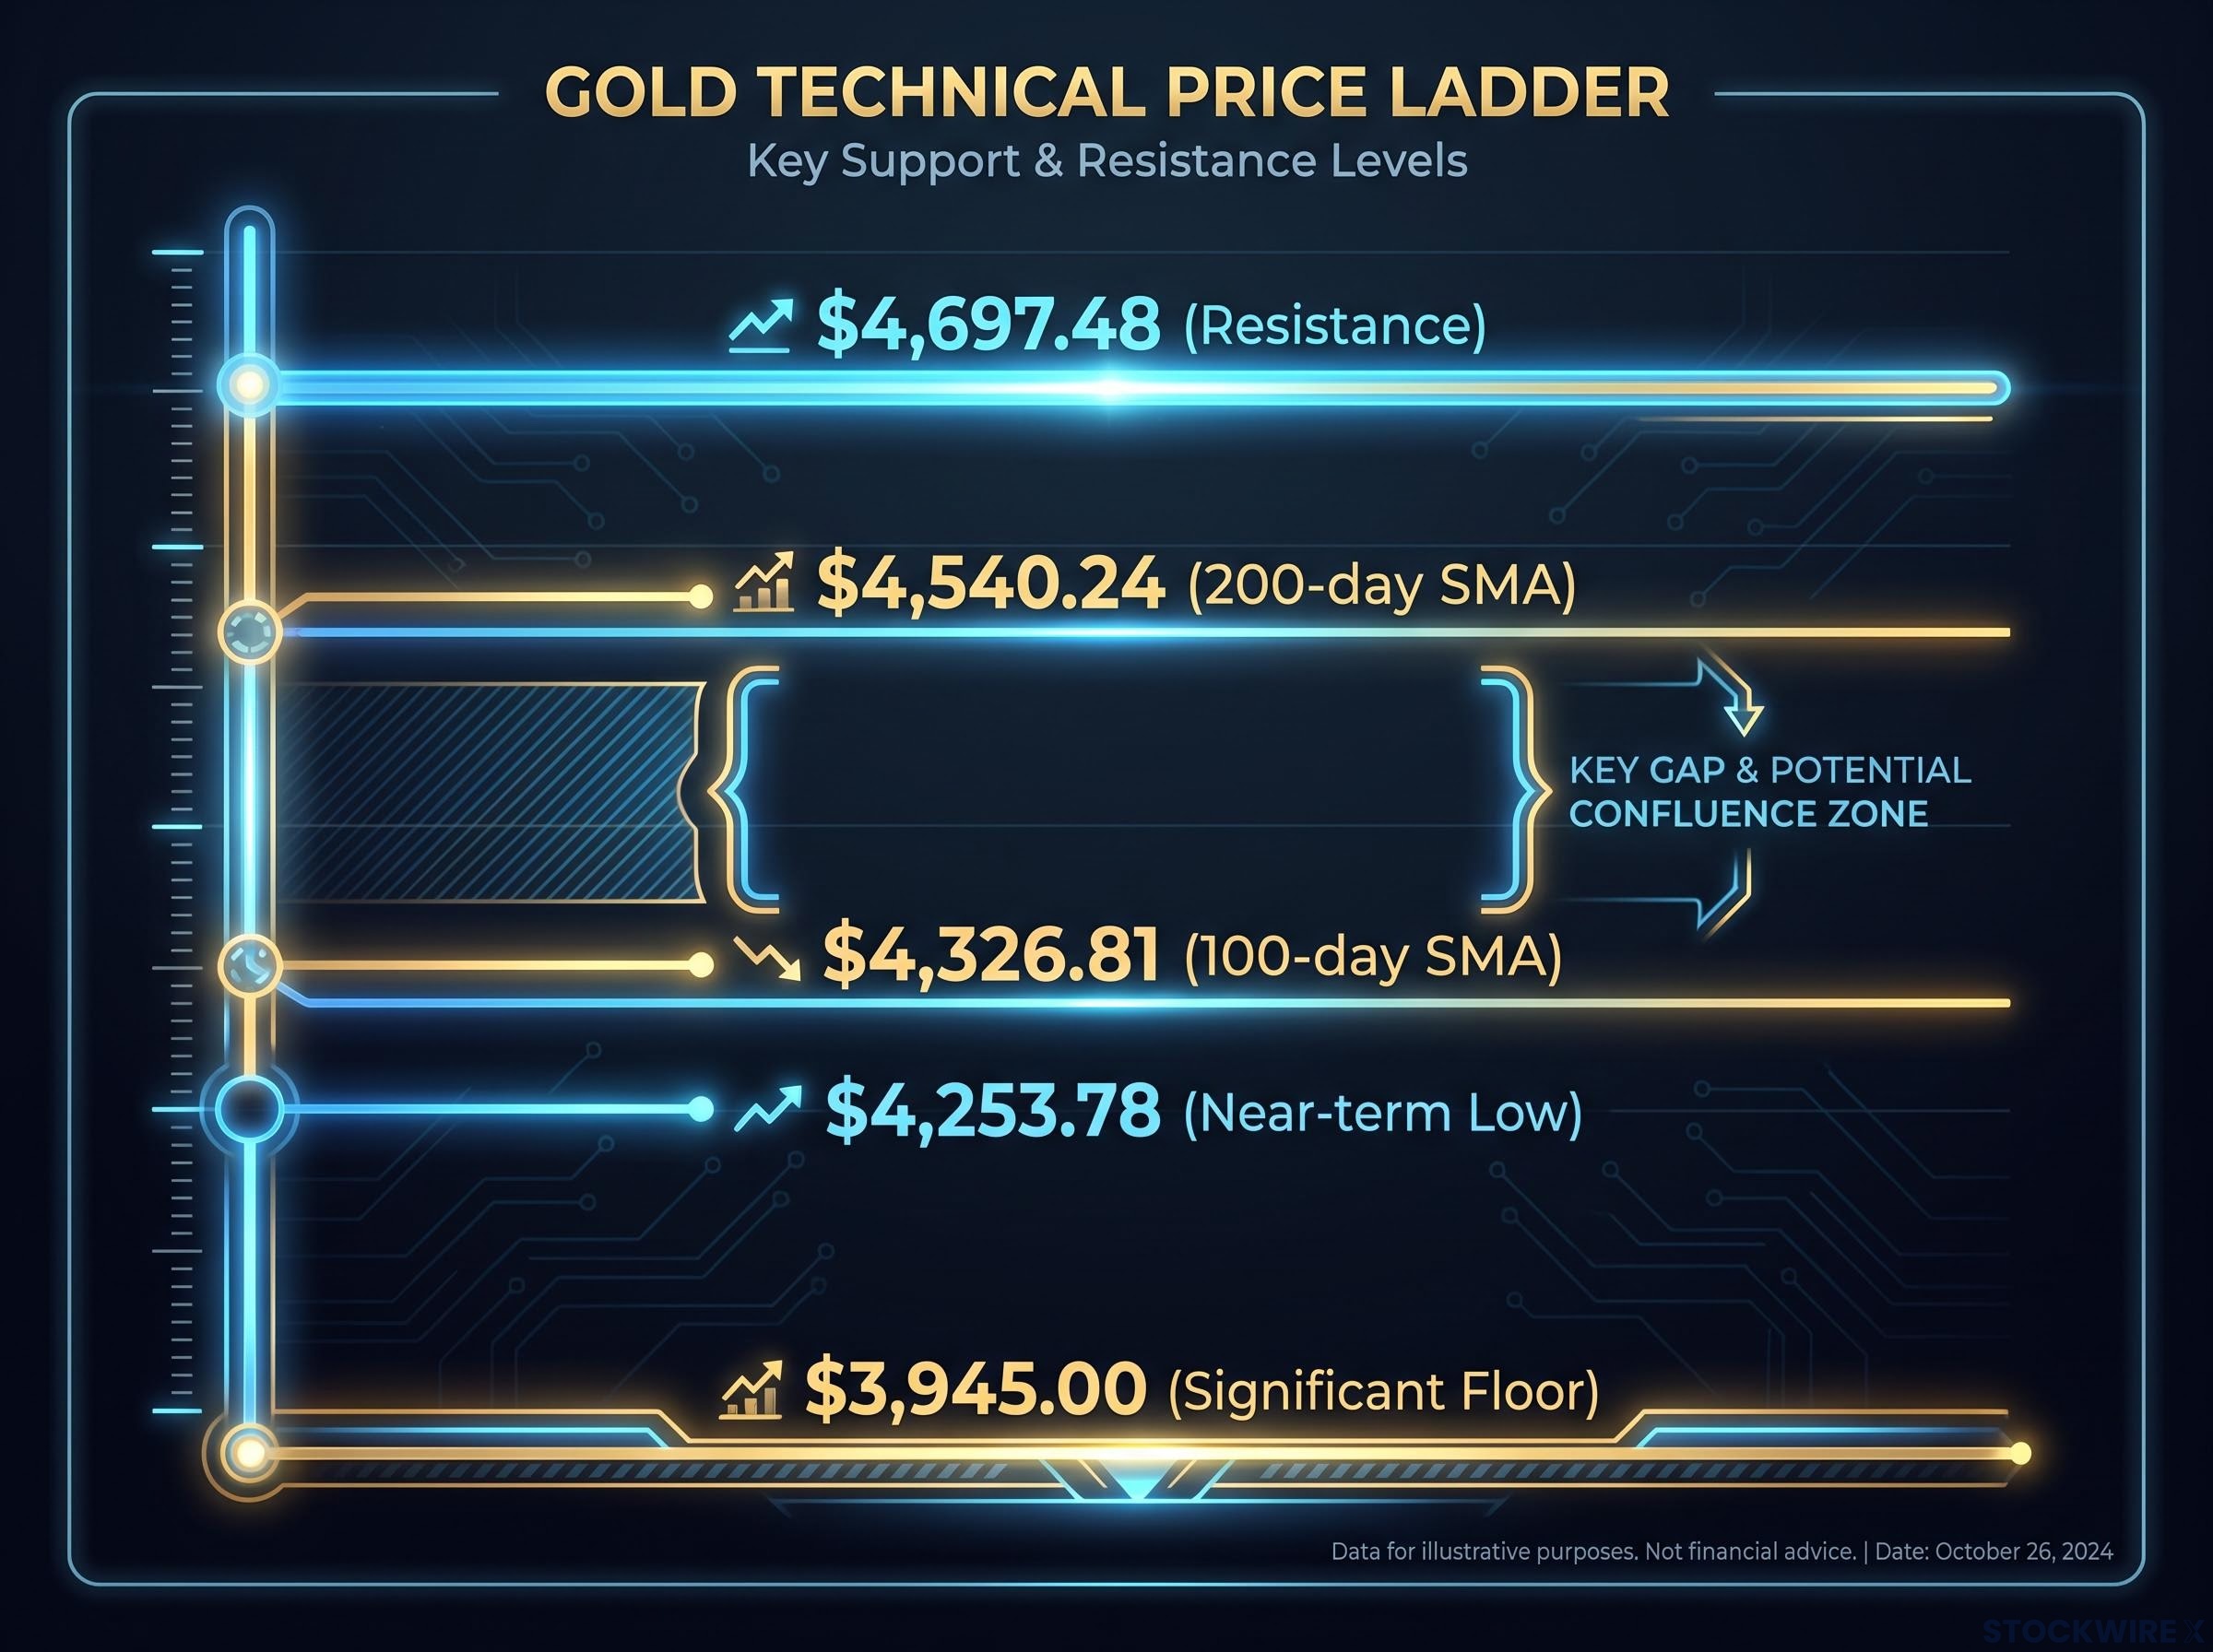
Here is the band gold is trapped in, according to FXStreet technical analysis by Ghiles Guezout. Price is sitting just above its 100-day simple moving average of $4,326.81, which is now acting as near-term support. But the 200-day SMA sits nearly $200 higher at $4,540.24, and that gap is the whole story.
The distance between those two averages tells you gold has room to run on the upside, but the climb to meaningful resistance is long enough that any near-term rally is likely to stall well before it confirms a fresh uptrend.
The RSI readings reinforce the standoff. On the daily chart the 14-period RSI is near 48, which signals no directional conviction at all. On the 1-hour chart it is closer to 64, suggesting short-term momentum building. When shorter timeframes heat up while the daily stays flat, it usually points to a small bounce brewing rather than a durable trend change.
The levels worth marking on your chart before the announcement:
- Resistance: $4,540.24 (200-day SMA), then a stronger barrier at $4,697.48; on the 1-hour chart, a descending trend line near $4,361 and a horizontal barrier at $4,511
- Support: $4,253.78 (near-term low), with a more significant floor around $3,945
Hold above $4,326.81 after the Fed and the short-term structure stays intact. Break $4,253.78 and the bearish case gains structural footing.
When big ASX news breaks, our subscribers know first
Why the 5% Treasury yield is a problem for gold bulls
Start with the simplest fact in the market. Gold pays you nothing. A 10-year Treasury now pays roughly 5%. That gap is where the headwind lives.
When a risk-free government bond hands you a 5% annual coupon and an ounce of gold hands you a storage cost, the opportunity cost of holding metal climbs with every uptick in yields. For an institutional portfolio manager weighing gold against Treasuries, higher yields make the choice easier, and not in gold’s favour.
The real yield mechanics that govern gold’s opportunity cost run through the spread between nominal Treasury yields and inflation expectations, not the headline Fed funds rate, which is why gold finished the 2022-2023 hiking cycle higher than where it started despite one of the most aggressive tightening sequences in modern Fed history.
The move that matters most is not the headline number but the speed of the repricing.
The 10-year yield ran from 4.80% on 8 September 2026 to 4.97% by 14 September, a 17 basis point jump in six days, before touching roughly 5.01% on 15 September (TradingEconomics). A single session on 10 September added more than 11 basis points, lifting the yield to 4.954%, its highest since late October 2023.
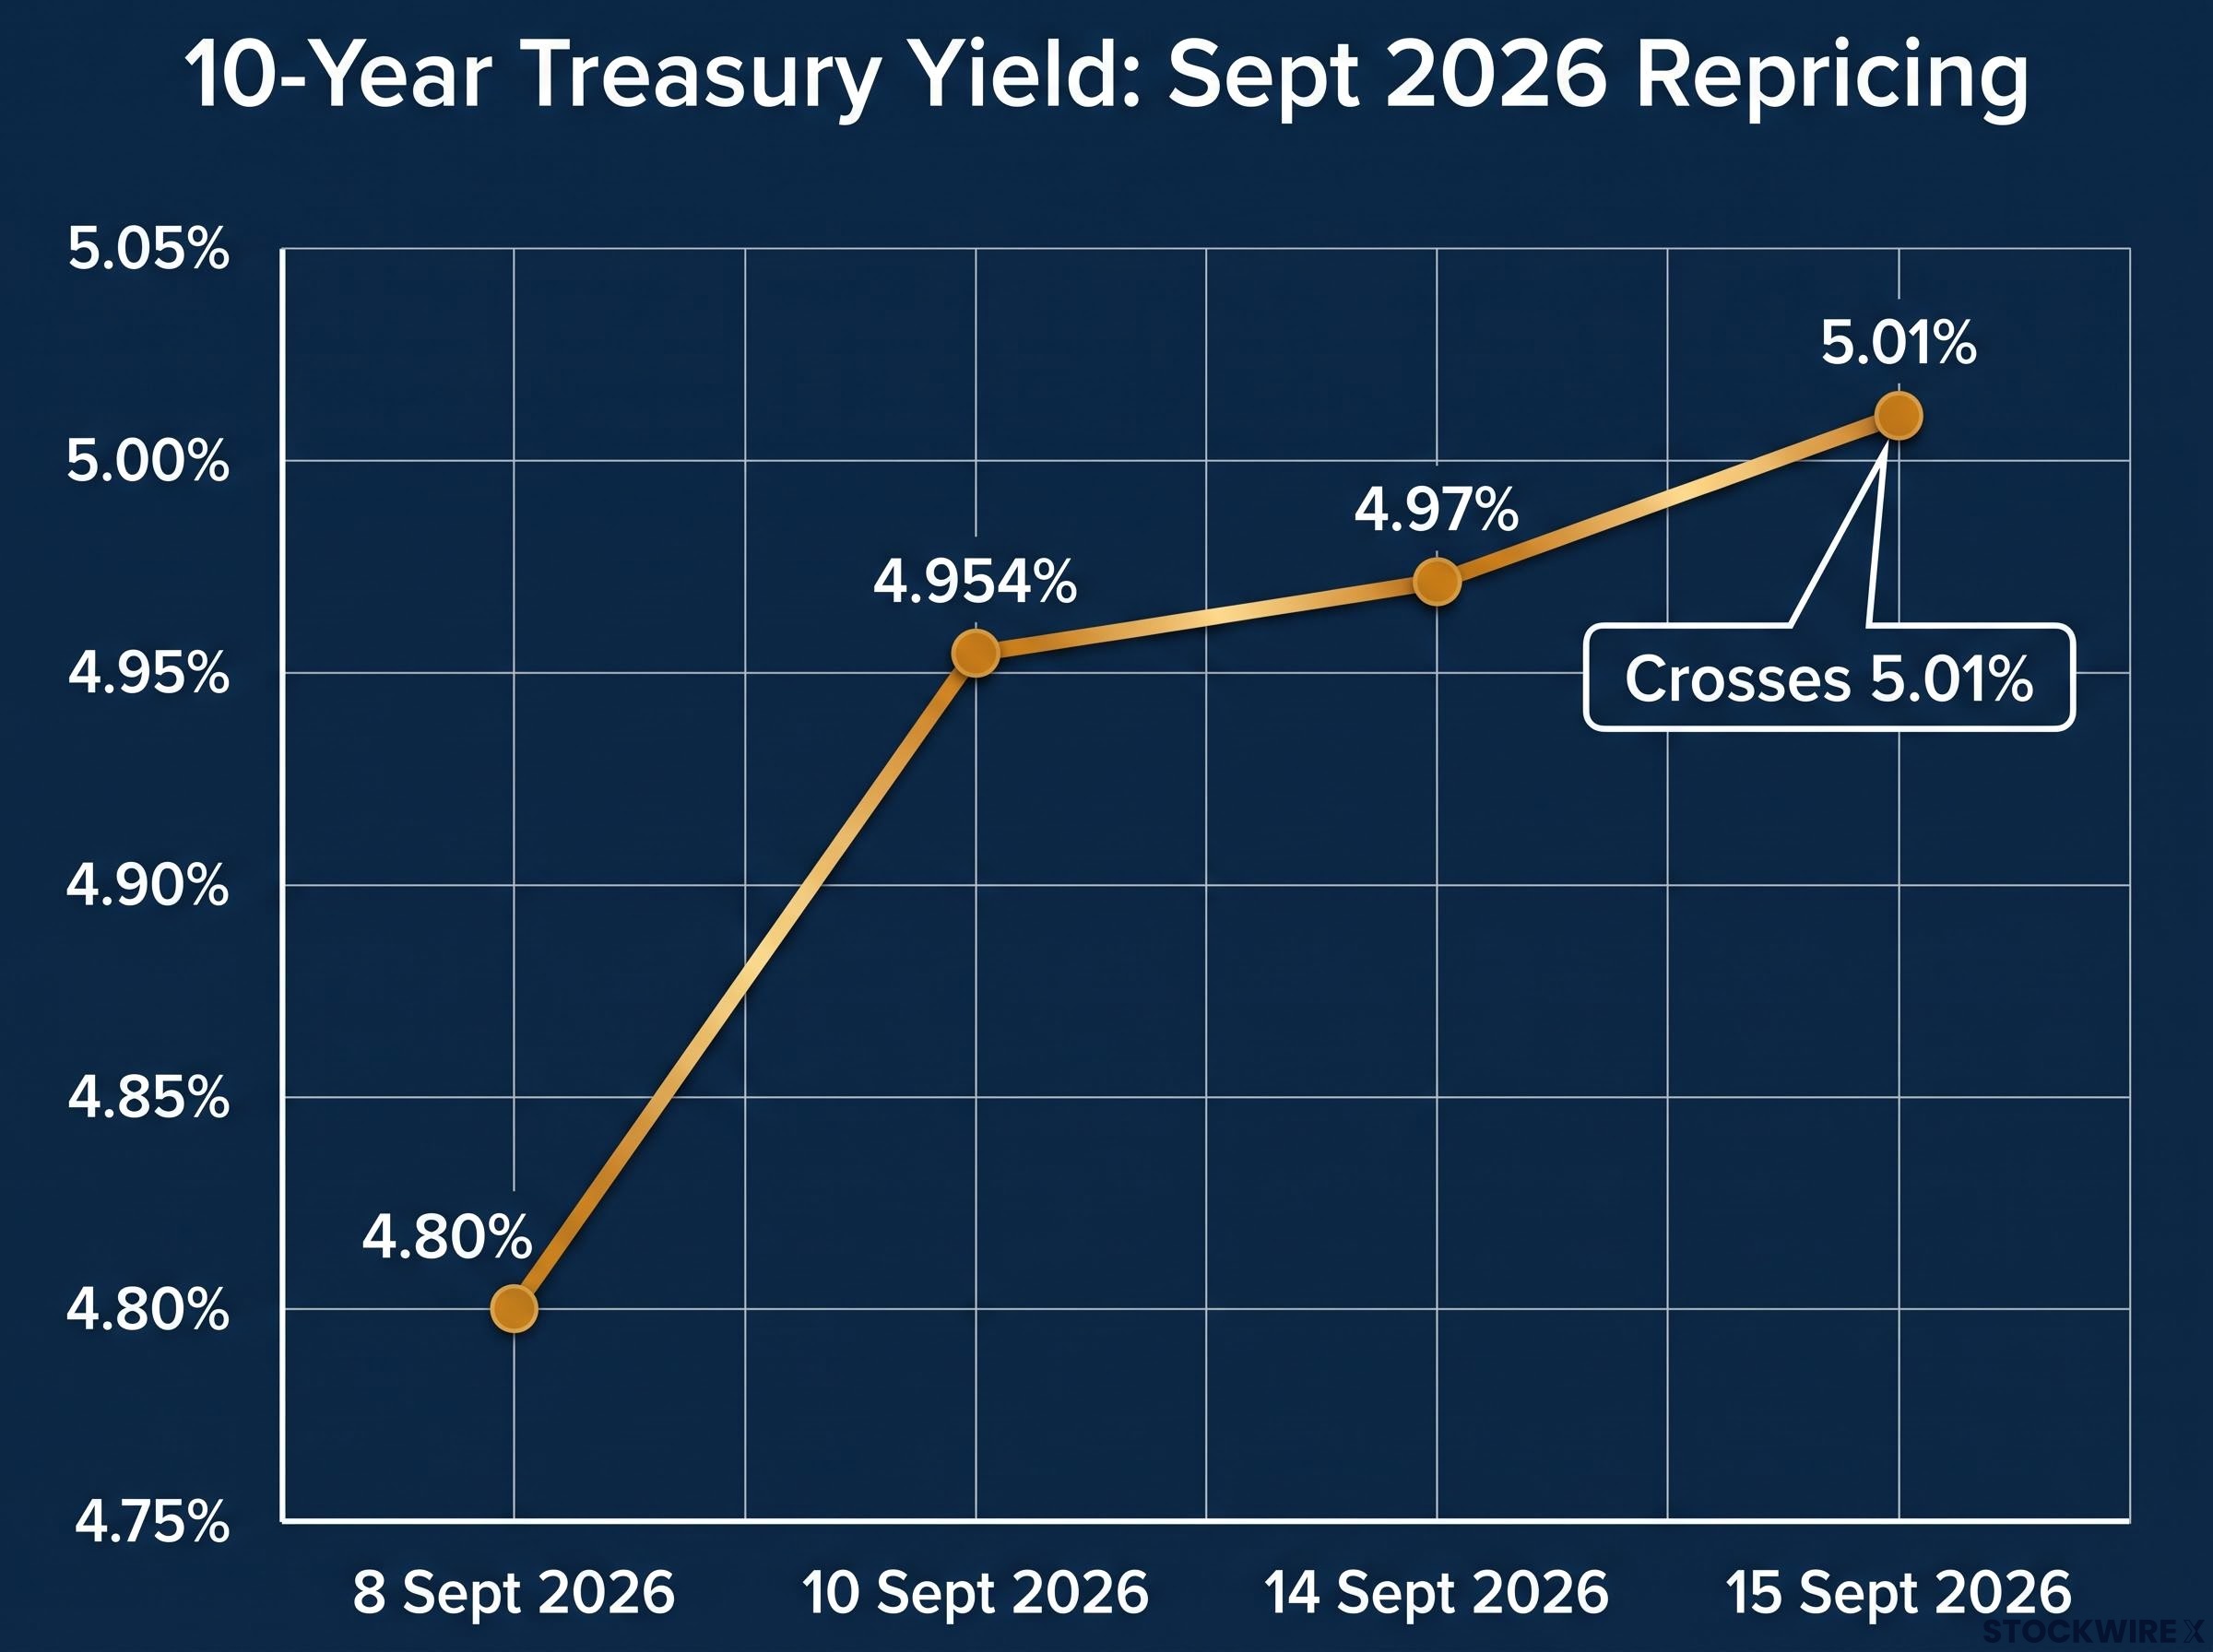
A 17 basis point rise over six days is not background noise. It is a meaningful repricing of the risk-free rate, and it directly raises the cost of holding gold for every professional with a Treasury alternative on the desk.
Fiscal stress yield dynamics complicate the standard bearish read on rising rates: Federal Reserve Board staff analysis from July 2026 attributed the 10-year yield rise almost entirely to higher far-forward real risk premiums tied to federal deficits, a signal that diverges sharply from the growth-driven yield rises that historically hit gold hardest.
There are three channels through which rising yields press on gold:
- Opportunity cost: every dollar in gold is a dollar not earning the Treasury coupon, and that coupon just got bigger.
- Real yields: what matters is the nominal yield minus inflation expectations. Gold struggles when real yields climb, but there is a catch worth understanding. If inflation expectations rise faster than nominal yields, real yields can stay low and gold can hold firm even as the headline number climbs.
- The dollar channel: higher yields tend to support a stronger dollar, and because gold is priced in dollars, dollar strength raises the metal’s effective price abroad and softens international demand.
If you track only the dollar or the geopolitical headlines, you can miss this channel entirely. It is the cleanest explanation for why gold can drift sideways or lower even while the world feels genuinely unsettled.
The bull case: why gold has not broken down despite the headwinds
The geopolitical driver: Iran, oil, and safe-haven flows
Now weigh the other side, because it is doing real work. The AP News report on the Fed’s 29 July 2026 meeting referenced “persistently high inflation and a spike in energy prices caused by the Iran war.” That is not a generic geopolitical placeholder. It is an active conflict pushing energy prices up and feeding inflation fears.
FXStreet’s analysis independently notes that Middle East tensions and oil supply disruption risk are generating inflationary concerns and lifting safe-haven demand, which puts a floor beneath gold.
The historical caveat matters, though. Past episodes, from the Gulf War to other Middle East flare-ups, show gold can spike hard on the headlines and then fade once the risk premium is priced in. High real rates have repeatedly capped how far safe-haven buying can carry the metal.
The inflation-hedge and rate-cycle argument
There is a second, more forward-looking pillar to the bull case. If markets come to believe the Fed is nearing the end of its tightening cycle, or risks falling behind the curve on future inflation, the expectation of lower real rates down the road can support gold even while yields are high today.
The Fed funds target range has held at 3.50%-3.75% since January 2026. A 25 basis point hike, if delivered, pushes it to 3.75%-4.00%. That is close to a point where markets start asking how much further the Fed really wants to go.
Here is how the two camps line up:
- Headwinds case: rising real yields raise the opportunity cost of holding gold; a stronger dollar softens overseas demand; a “higher for longer” stance keeps bond carry attractive.
- Floor case: an active Iran conflict and energy price spike sustain safe-haven flows; persistent inflation supports gold as a hedge; an approaching end to the rate cycle builds an upside case on falling future real rates.
The fact that gold has held above $4,250 through a 17 basis point yield spike tells you the floor is real for now. The warning is that this floor can shift quickly once a geopolitical risk premium starts to deflate.
Three signals to watch when the Fed speaks
The headline rate decision is already priced in. The real information arrives in the details that follow, and there are three worth watching in real time. Fed Chair Kevin Warsh will lead the announcement.
- The dot plot: this is the Fed’s rate roadmap. If the median dot shifts higher, markets reprice yields and the dollar upward almost instantly, which typically drives a quick drop in gold. A lower or unchanged path reads the other way.
- Warsh’s press conference tone: even with the statement unchanged, the Chair’s language is a live sentiment signal. A strong August jobs report and the August CPI have already tilted expectations hawkish, so any dovish deviation in Warsh’s tone would carry outsized weight.
- The gold-as-insurance read: watch how the market prices gold’s “premium” against the signals above.
The gap between dot plot vs market pricing has widened to a level where acting on either signal without a framework produces conflicting trade setups; the June 2026 dot plot’s near-even 9-to-8 split on further hikes versus no change made the median projection a signal of committee uncertainty rather than conviction, a context that directly shapes how much weight the September dots should carry.
Federal Reserve Governor Waller’s September outlook, delivered just two weeks before this meeting, signalled that incoming data on inflation and employment would be the deciding factor in whether the Board supported further tightening, adding weight to the interpretation that Warsh’s press conference tone carries as much information as the decision itself.
Think of gold as an insurance policy. The premium rises when the Fed signals inflation risk or uncertainty and falls when it signals a clear path higher for rates. A “higher for longer” message reduces the perceived need for that insurance and pushes the price down.
The context that raises the stakes: the 29 July 2026 FOMC vote was 9-3 to hold. Three members were already pushing for a different path, which means Warsh’s tone this time carries more weight than usual in signalling which faction is gaining ground.
Most retail investors react to the number. The number is old news the moment it lands. The signal you actually want sits in the dots and the Chair’s choice of words.
What this meeting changes, and what it does not
Pull the threads together and the picture is coherent, if unresolved. Gold is not broken; it is holding above its 100-day SMA with a short-term bid building. It is also not in a confirmed uptrend, sitting nearly $200 below its 200-day SMA. The range between $4,253.78 and $4,540.24 is the decision zone for the next several weeks.
The near-term trade is a Fed interpretation exercise. The structural setup depends on a slower question: whether inflation expectations or real yields win the tug-of-war. Neither outcome is settled.
The real yield divergence that emerged through mid-2026, gold advancing while real yields hit multi-month highs, directly contradicts every institutional macro model built on the classic inverse correlation, a structural break that traces to central bank accumulation running at roughly 1,000 tonnes per year and growing mistrust in US fiscal and monetary credibility.
| Fed signal | Likely gold direction | Levels to watch |
|---|---|---|
| Hawkish (upward dot shift, confident Warsh tone) | Pressure toward lower support | $4,253.78 downside test |
| Neutral-to-dovish (unchanged dots, cautious tone) | Path opens toward the 200-day SMA | $4,540.24, then $4,697.48 |
For gold to sustain a move through the 200-day SMA toward $4,697.48, something structural has to give: a material softening of real yields, a genuine dollar reversal, or an escalation of the Iran conflict large enough to overwhelm the opportunity-cost drag. A close above $4,540 would be a shift worth respecting. A close below $4,253 tells you the yield headwind has won the near-term argument.
This article is for informational purposes only and should not be considered financial advice. Investors should conduct their own research and consult with financial professionals before making investment decisions. Past performance does not guarantee future results. Financial projections are subject to market conditions and various risk factors, and forward-looking scenarios are speculative and subject to change based on market developments.