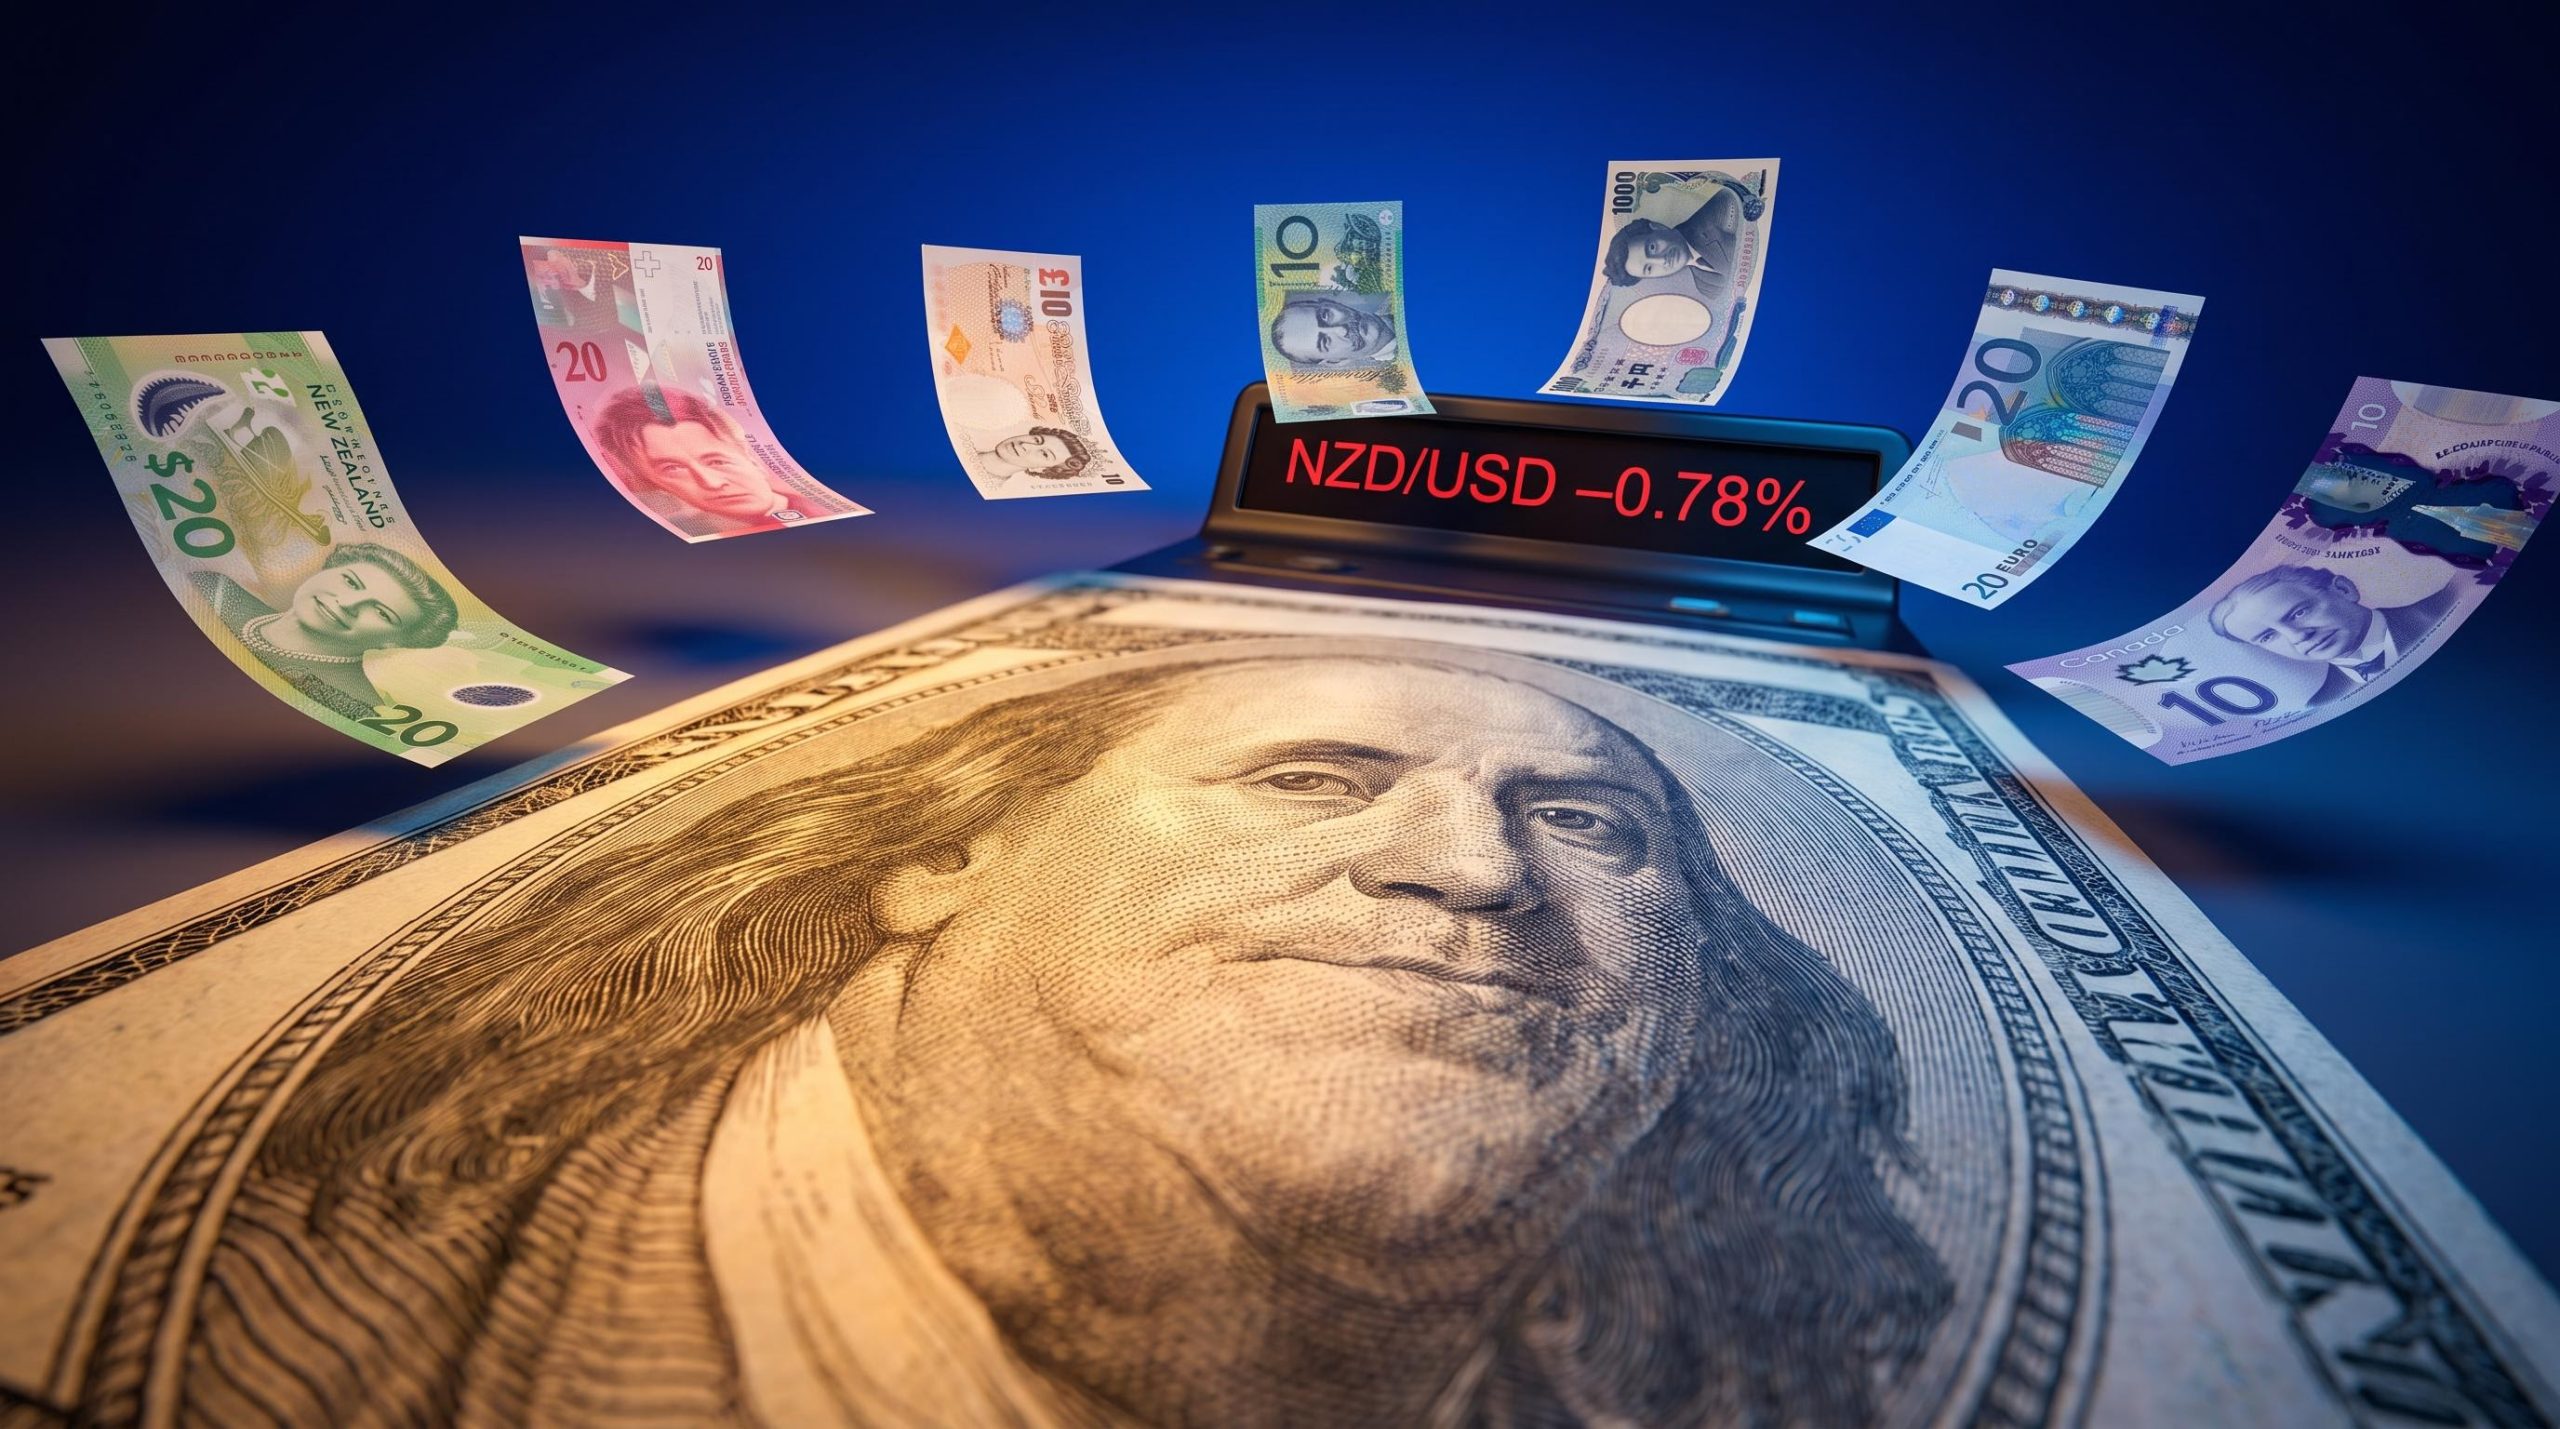
On 16 September 2026, the Federal Reserve raised rates to 3.75-4.00%, and every major currency on the planet moved against the dollar. Not some. Every one.
A Fed rate hike is never just a domestic event. The US dollar is the world’s reserve currency and the denominator against which global risk is priced.
When the Fed tightens, capital flows shift, carry trades reprice, and assets from the British Pound to Bitcoin absorb the shockwaves. Today’s unanimous 12-0 decision, paired with Chair Kevin Warsh’s signal of at least one more hike before year-end, is a live demonstration of that chain reaction.
This piece maps every link in that chain: which currencies fell furthest and why, what mechanics are doing the driving, how crypto markets read Fed signals, and what a sustained dollar rally has historically meant for the rest of the world. If you want to understand why one central bank’s decision in Washington reshapes portfolios from Wellington to Warsaw, you are in the right place.
Every major currency just lost ground to the dollar, and the margins tell a story
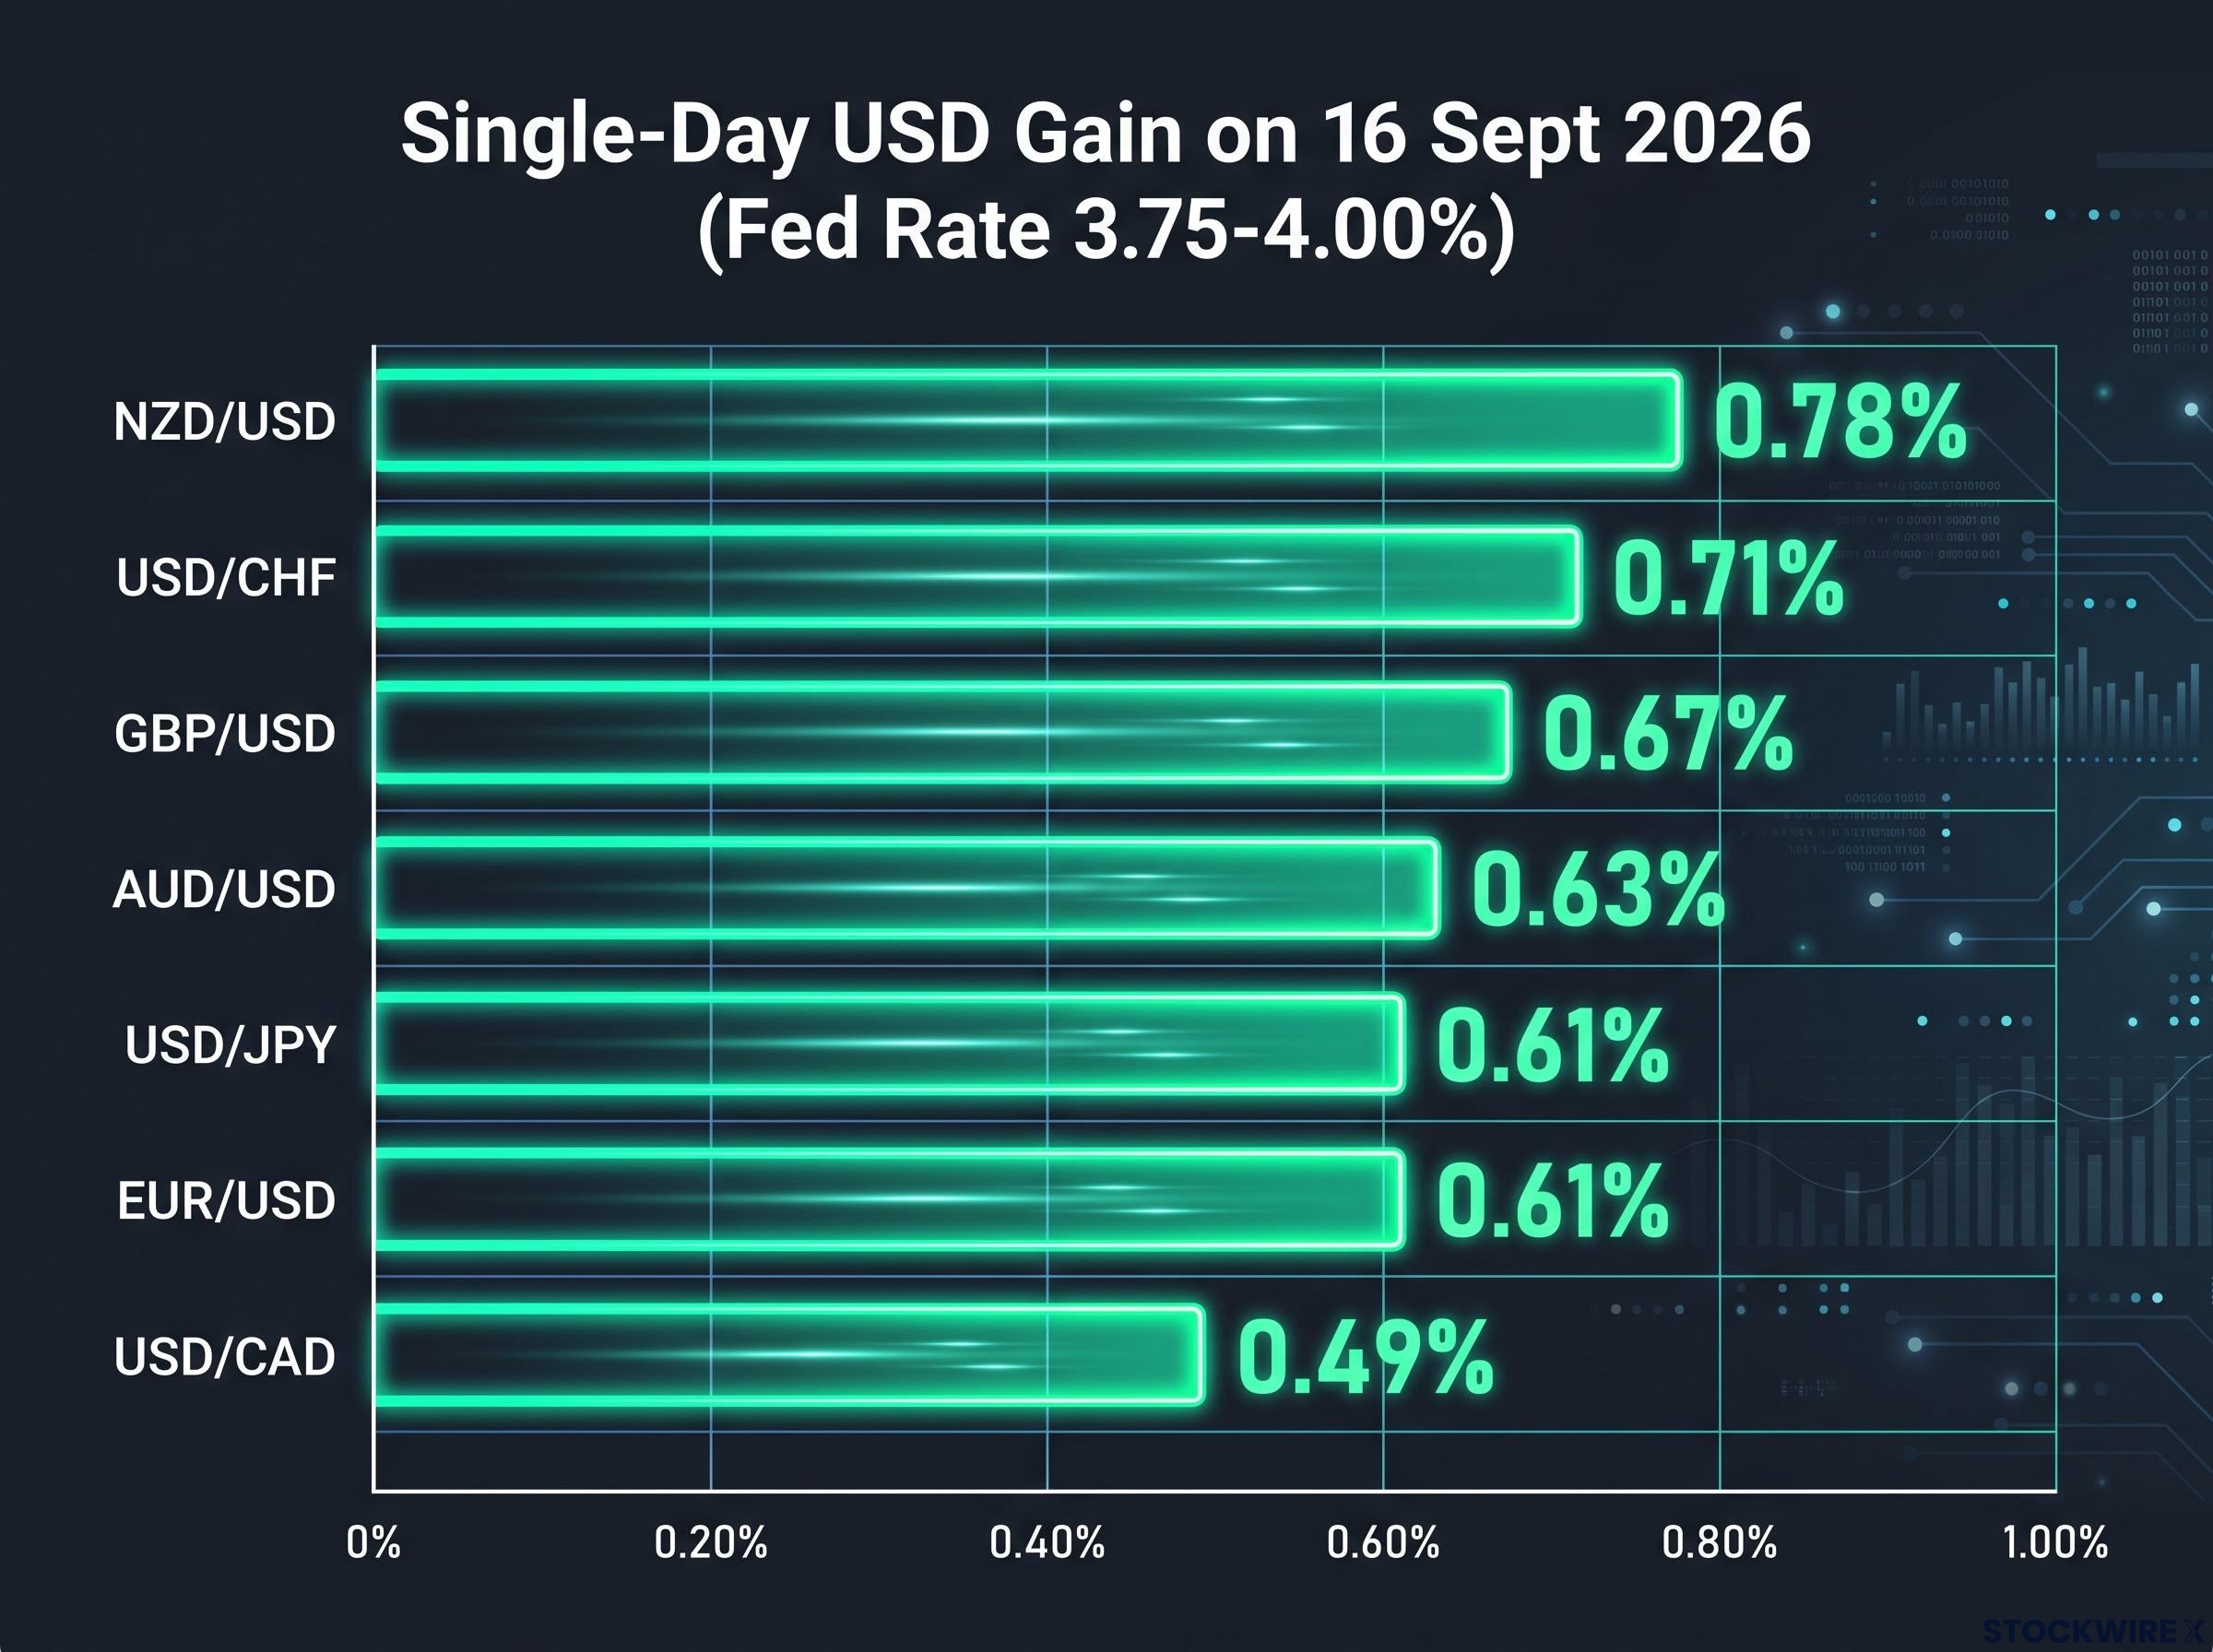
The breadth is the first thing worth noticing. The dollar did not simply beat a weak currency or two. It posted single-day gains against all seven tracked major pairs on the day of the announcement.
But the size of each move is where the real signal sits. Ranked from largest to smallest, the spread tells you which currencies are most structurally exposed to interest rate differentials right now.
| Currency Pair | Single-Day USD Gain | Notable Context |
|---|---|---|
| NZD/USD | 0.78% | Largest single-day USD advance; high-beta commodity currency |
| USD/CHF | 0.71% | Swiss Franc gave up ground despite safe-haven status |
| GBP/USD | 0.67% | Fed policy rate now exceeds the Bank of England’s |
| AUD/USD | 0.63% | Pair pushed toward fresh monthly lows beneath 0.7100 |
| USD/JPY | 0.61% | Climbed to fresh weekly highs near 156.00 |
| EUR/USD | 0.61% | Euro pulled lower after the announcement |
| USD/CAD | 0.49% | Canadian Dollar at its weakest in roughly six weeks |
Look at the top of the list and the bottom, and a pattern emerges that has nothing to do with which economy is weakest. Sterling is a useful example. The Pound fell because the Fed’s policy rate has now surpassed the Bank of England’s prevailing rate, inverting a dynamic that had recently worked in sterling’s favour.
After the Fed held rates on 29 July 2026, sterling had risen about 0.4% to around $1.3342 as markets questioned the Fed’s resolve. Today it dropped 0.67%. That reversal is the policy rate crossover playing out in real time.
The commodity currencies at the top of the ranking follow their own logic. The New Zealand and Australian Dollars fell hardest not because those economies stumbled, but because higher US yields pull capital away from resource-heavy economies regardless of their own growth conditions.
The Canadian Dollar, sliding to a roughly six-week low, sits in the same camp.
What this gives you is not just a snapshot. It is a sensitivity map. The order from NZD down to CAD tells you where capital flows fastest when the Fed tightens, and reading that order is more useful than watching any single pair in isolation.
When big ASX news breaks, our subscribers know first
How a Fed rate decision moves currencies halfway around the world
From a trader’s desk, a rate differential is simply a signal about where money earns more for less effort. When the Fed lifts rates above those of the European Central Bank, the Bank of Japan, or the Reserve Bank of Australia, holding dollar assets suddenly pays better. Today’s hike widened that gap mechanically.
The dollar’s reserve currency status, grounded in the fact that it appears on one side of 89.2% of all global FX trades against a US share of world trade of roughly 10%, is precisely what transforms a domestic Fed decision into a simultaneous shock across every major currency pair.
That is the engine beneath the currency moves in the previous section, and it has a name: the carry trade.
The carry trade rests on three moving parts:
- The borrow leg: an investor borrows money in a low-interest-rate currency, such as the Japanese Yen, where funding is cheap.
- The invest leg: that borrowed capital is parked in higher-yielding dollar assets, capturing the superior US rate.
- The rate differential: the gap between the two rates is the profit, and it just widened with the Fed’s move.
This is why the currency rankings are not random market noise. They are a predictable response to where the yield advantage now sits.
The US-Japan divergence as a live case study
No pair illustrates this more sharply than USD/JPY. The numbers explain why it is the most watched carry trade on the planet.
US 10-year Treasury yields sit around 4.54% against Japan’s roughly 1.56%, a spread of about 2.98 percentage points. On the policy side, BoJ rates linger near 0.5% while the Fed’s target now stands at 3.75-4.00%.
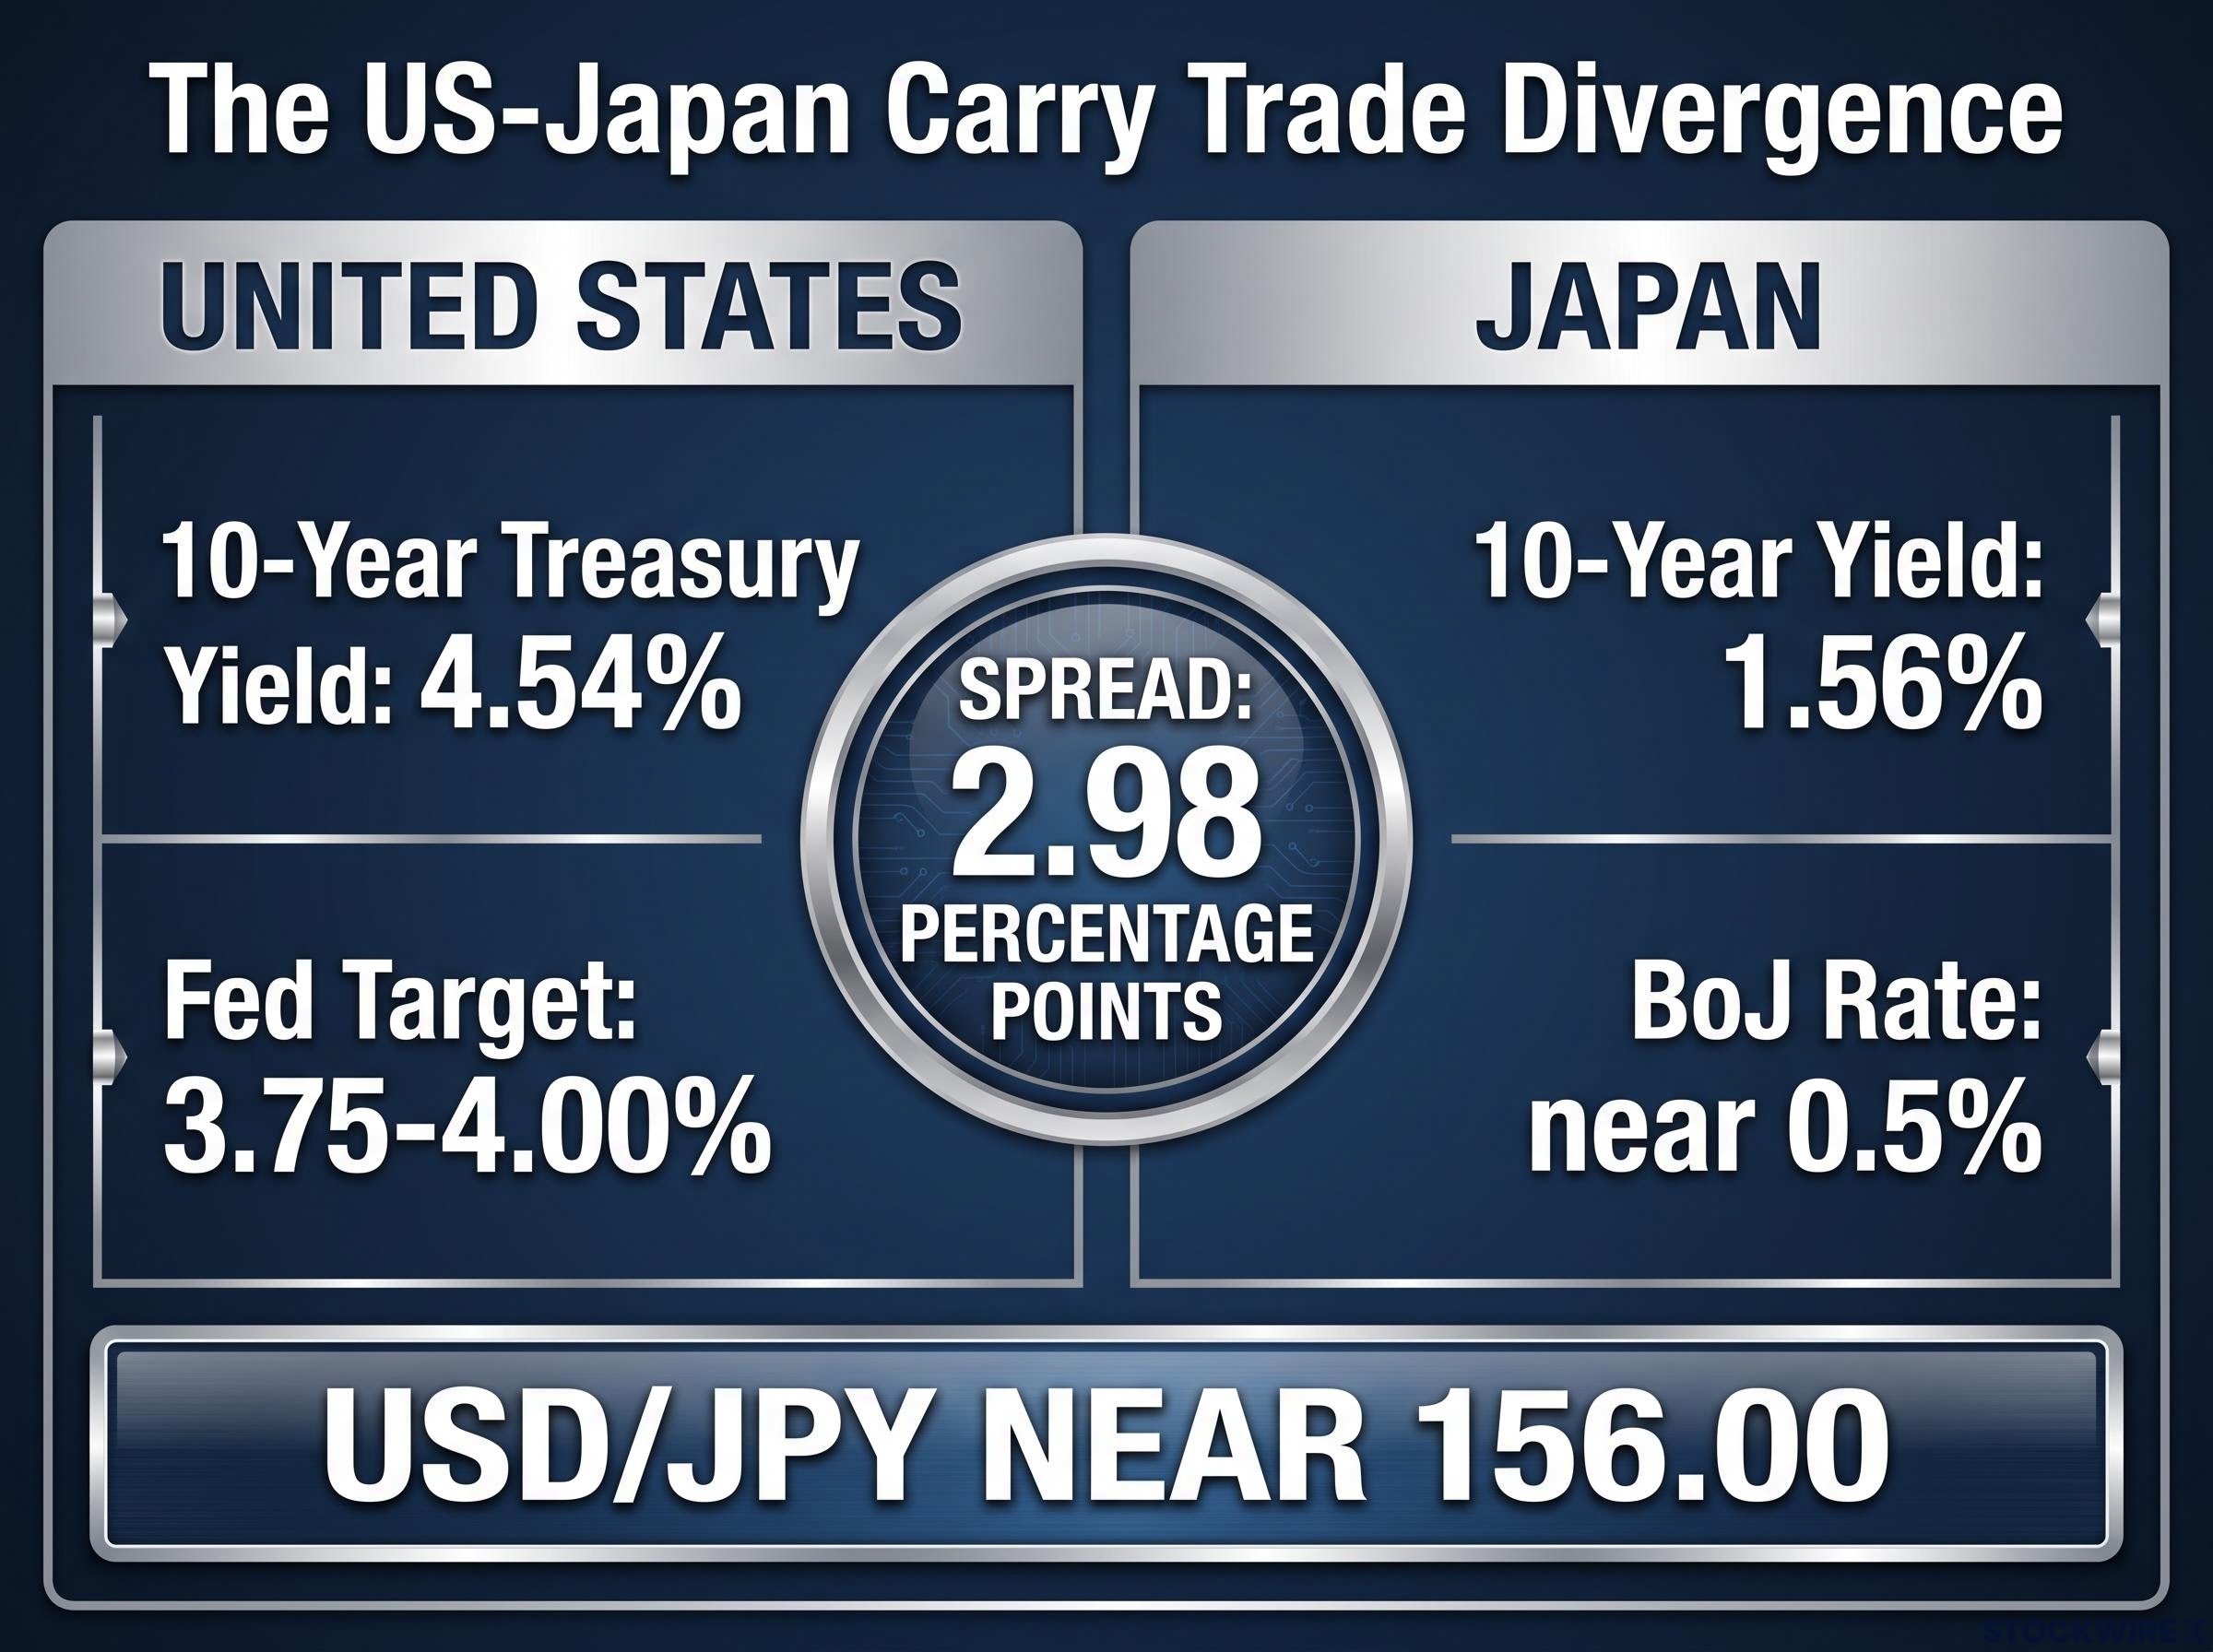
That is an enormous, persistent gap. It is why USD/JPY climbed to fresh weekly highs near 156.00 immediately after Chair Warsh’s press conference.
Here is the part carry traders never forget. Academic research on carry returns warns that high interest differentials carry negative skewness, meaning the positions tend to unwind in sudden, sharp losses rather than gentle declines.
If the BoJ signals a pivot toward tightening, or the Fed softens its guidance, Yen funding positions can reverse fast. The strategy earns steadily and loses violently.
Yen carry unwind risk is real but historically episodic rather than systemic: Japan’s 2026 currency intervention exceeded $70 billion and still failed to reverse yen weakness, which is exactly why USD/JPY climbed to fresh weekly highs near 156.00 despite markets being fully aware of the intervention threat.
So the BoJ divergence is not just a Japan story. It is the clearest visible signal of how global capital is being redirected toward dollar assets right now. If you hold positions in any carry-sensitive currency, the snap-back risk built into that redirection is the thing to respect.
Why Bitcoin and Ethereum treated today’s hike as a threat
Crypto did not stumble on a single bad day. It has been flinching at Fed signals across the entire 2026 cycle, and today’s headwinds are the latest reaction in a documented, repeating pattern.
Tracing the sequence chronologically makes the point clearly:
- March 2026 volatility: On 18 March 2026, Bitcoin slid 4.5% to roughly $71,004 after the Fed expressed uncertainty about how surging oil prices would feed inflation.
- Jackson Hole selloff: Following Chair Warsh’s hawkish speech on 28 August 2026, Bitcoin fell 3.1-3.23% to between $77,812 and $77,901, Ethereum dropped 2.7-3.1% to around $2,420-$2,444, and XRP lost 4.89-5% to roughly $1.36-$1.39.
- Pre-hike September jitters: On 8 September 2026, Bitcoin fell about 0.9% to $78,533.70 as rate-hike expectations climbed.
- Today’s headwinds: The rate decision itself added fresh selling pressure across the major tokens.
The direction runs both ways, which is the tell. Earlier in the cycle, when expectations of further hikes faded, Bitcoin rallied toward $81,000. The asset tracks rate odds continuously, up and down.
Why is higher-for-longer structurally negative for crypto? Because the opportunity cost of holding a non-yielding, speculative asset rises as risk-free dollar returns climb. When cash and Treasuries pay more, the relative appeal of Bitcoin and Ethereum, which pay nothing, falls.
Cross-asset repricing from rising Treasury yields works through a single unified mechanism: higher risk-free rates simultaneously force down growth equity valuations, compress gold’s real return advantage, and widen crypto’s opportunity cost relative to dollar-denominated cash, which is why Bitcoin and semiconductor ETFs moved in the same direction after Kevin Warsh’s Jackson Hole address.
The 2022 precedent shows how severe this dynamic can become.
During the 2022-2023 tightening cycle, the Fed lifted rates from near zero to roughly 4.5%, pushing the dollar index (DXY) above 110. Over the same stretch, Bitcoin fell roughly 70% from its November 2021 peak.
What this pattern tells you is that crypto markets are not reacting to today’s hike in isolation. They are pricing the direction of Fed policy on a rolling basis. That means the next FOMC signal matters as much as today’s rate decision, and your crypto exposure now sits firmly inside the same macro-sensitive risk bucket as equities and bonds.
What a sustained dollar rally does to the rest of the world
The most acute risk from a rising dollar does not land on US investors. It lands on emerging markets, where the transmission is direct and painful.
A stronger dollar raises the domestic-currency cost of servicing dollar-denominated debt. That increases sovereign default risk and forces governments into pro-cyclical fiscal tightening, cutting spending exactly when their economies can least afford it.
The scale is measurable. According to research on strong-dollar episodes, a 10% dollar appreciation can reduce emerging market output by roughly 1.9% after one year.
The damage travels through three main channels:
- EM debt costs: dollar-denominated borrowing becomes more expensive to service in local currency terms.
- Commodity import prices: a stronger dollar raises the local-currency cost of dollar-priced commodities, particularly oil, squeezing importers already under energy pressure.
- Capital flow reversal: money exits risk assets in developing economies and flows back toward higher-yielding dollar safety.
Whether this pressure lasts for years or peaks soon is genuinely contested, and the answer shapes how you position across every asset class in this article.
| Dimension | Structural view | Cyclical view |
|---|---|---|
| Inflation diagnosis | Persistent, diverging inflation dynamics | Exogenous oil-price shock (Iran war spike) |
| Duration of USD strength | Higher for longer; carry premium persists | Late-cycle peak; pressure reverses soon |
| Key supporting evidence | Diverging global inflation trends | Internal Fed dissent (July 9-3 vote) |
| Representative view | Brown Brothers Harriman, Goldman Sachs | PIMCO, The Conference Board |
The structural camp, led by Brown Brothers Harriman and Goldman Sachs, argues the Fed can hold rates elevated for an extended stretch, sustaining a long-term dollar carry premium. The cyclical camp at PIMCO and The Conference Board reads the tightening as a temporary response to an oil shock, pointing to the divided July vote as evidence the Fed’s resolve may not last.
PIMCO’s 2026 global outlook positions the cyclical camp’s argument around the view that the current tightening is a temporary response to an exogenous oil shock rather than a signal of entrenched, structural inflation, with the firm expecting dollar dominance to persist but the rate premium to fade as the shock dissipates.
Why history says this rally could reverse faster than markets expect
History offers a genuine caution against assuming Fed hikes always mean a stronger dollar. Research from T. Rowe Price and StoneX points out that the relationship is not linear.
In the 1994 and 2004-2006 cycles, the dollar materially weakened despite short-term US yield increases. Growth differentials and global sentiment ultimately capped and reversed those rallies.
The 2013 experience shows how quickly guidance alone can destabilise markets. Between May and September 2013, US 10-year yields rose roughly 135-137 basis points on taper signals, and major emerging market currencies fell by an average of 6%.
Treat this as a calibration point. Global growth differentials and BoJ forward guidance are the leading indicators worth monitoring for signs that today’s rally is running out of road.
Positioning for what comes next in a hawkish dollar environment
Pull the threads together and the three pressure zones covered here, currency carry sensitivity, crypto’s macro exposure, and stress on emerging markets and commodity importers, are not three separate stories. They are one interconnected system, all responding to the same widening rate differential.
The proximate pressure point is Chair Warsh’s guidance that at least one more hike is likely before year-end, on top of today’s move to 3.75-4.00%. A second hike would widen the carry advantage further, deepen crypto’s opportunity-cost headwind, and add fresh strain to dollar-indebted economies.
In July, the Fed split 9-3 on holding rates. Today, it moved 12-0. That shift tells you the internal debate has closed for now, removing a source of uncertainty that had previously capped both dollar strength and crypto volatility.
FOMC forward guidance signals carry different reliability depending on the cycle: the June 2026 dot plot median of 3.8% masked a near-even 9/8/1 split among committee members on hikes versus no change versus a cut, which is the context that makes Chair Warsh’s 12-0 September decision a qualitatively different type of signal than any previous 2026 vote.
Three variables will determine whether this rally extends or reverses:
- The FOMC November meeting: the outcome and the tone of the guidance that comes with it.
- BoJ policy signals: any hint of tightening from a bank still near 0.5% could snap Yen carry trades violently.
- US CPI and oil prices: the inflation trajectory behind Warsh’s hawkishness is the thing that either justifies more hikes or removes the case for them.
Watch those three, and you will read the next FOMC decision as it develops rather than after the fact.
This article is for informational purposes only and should not be considered financial advice. Investors should conduct their own research and consult with financial professionals before making investment decisions. Past performance does not guarantee future results, and forward-looking statements are speculative and subject to change based on market developments.