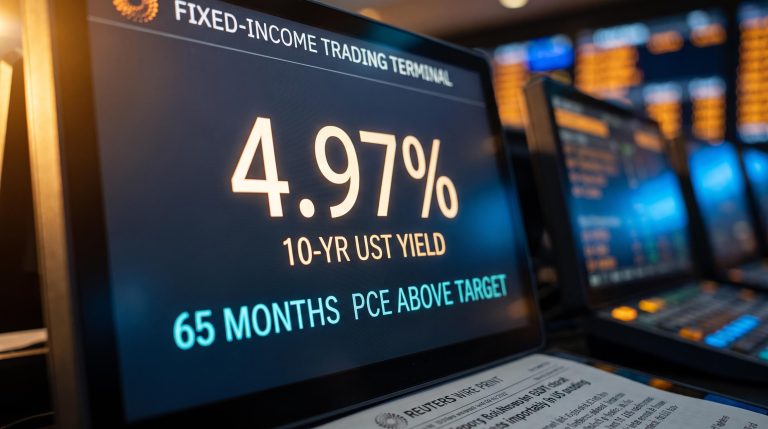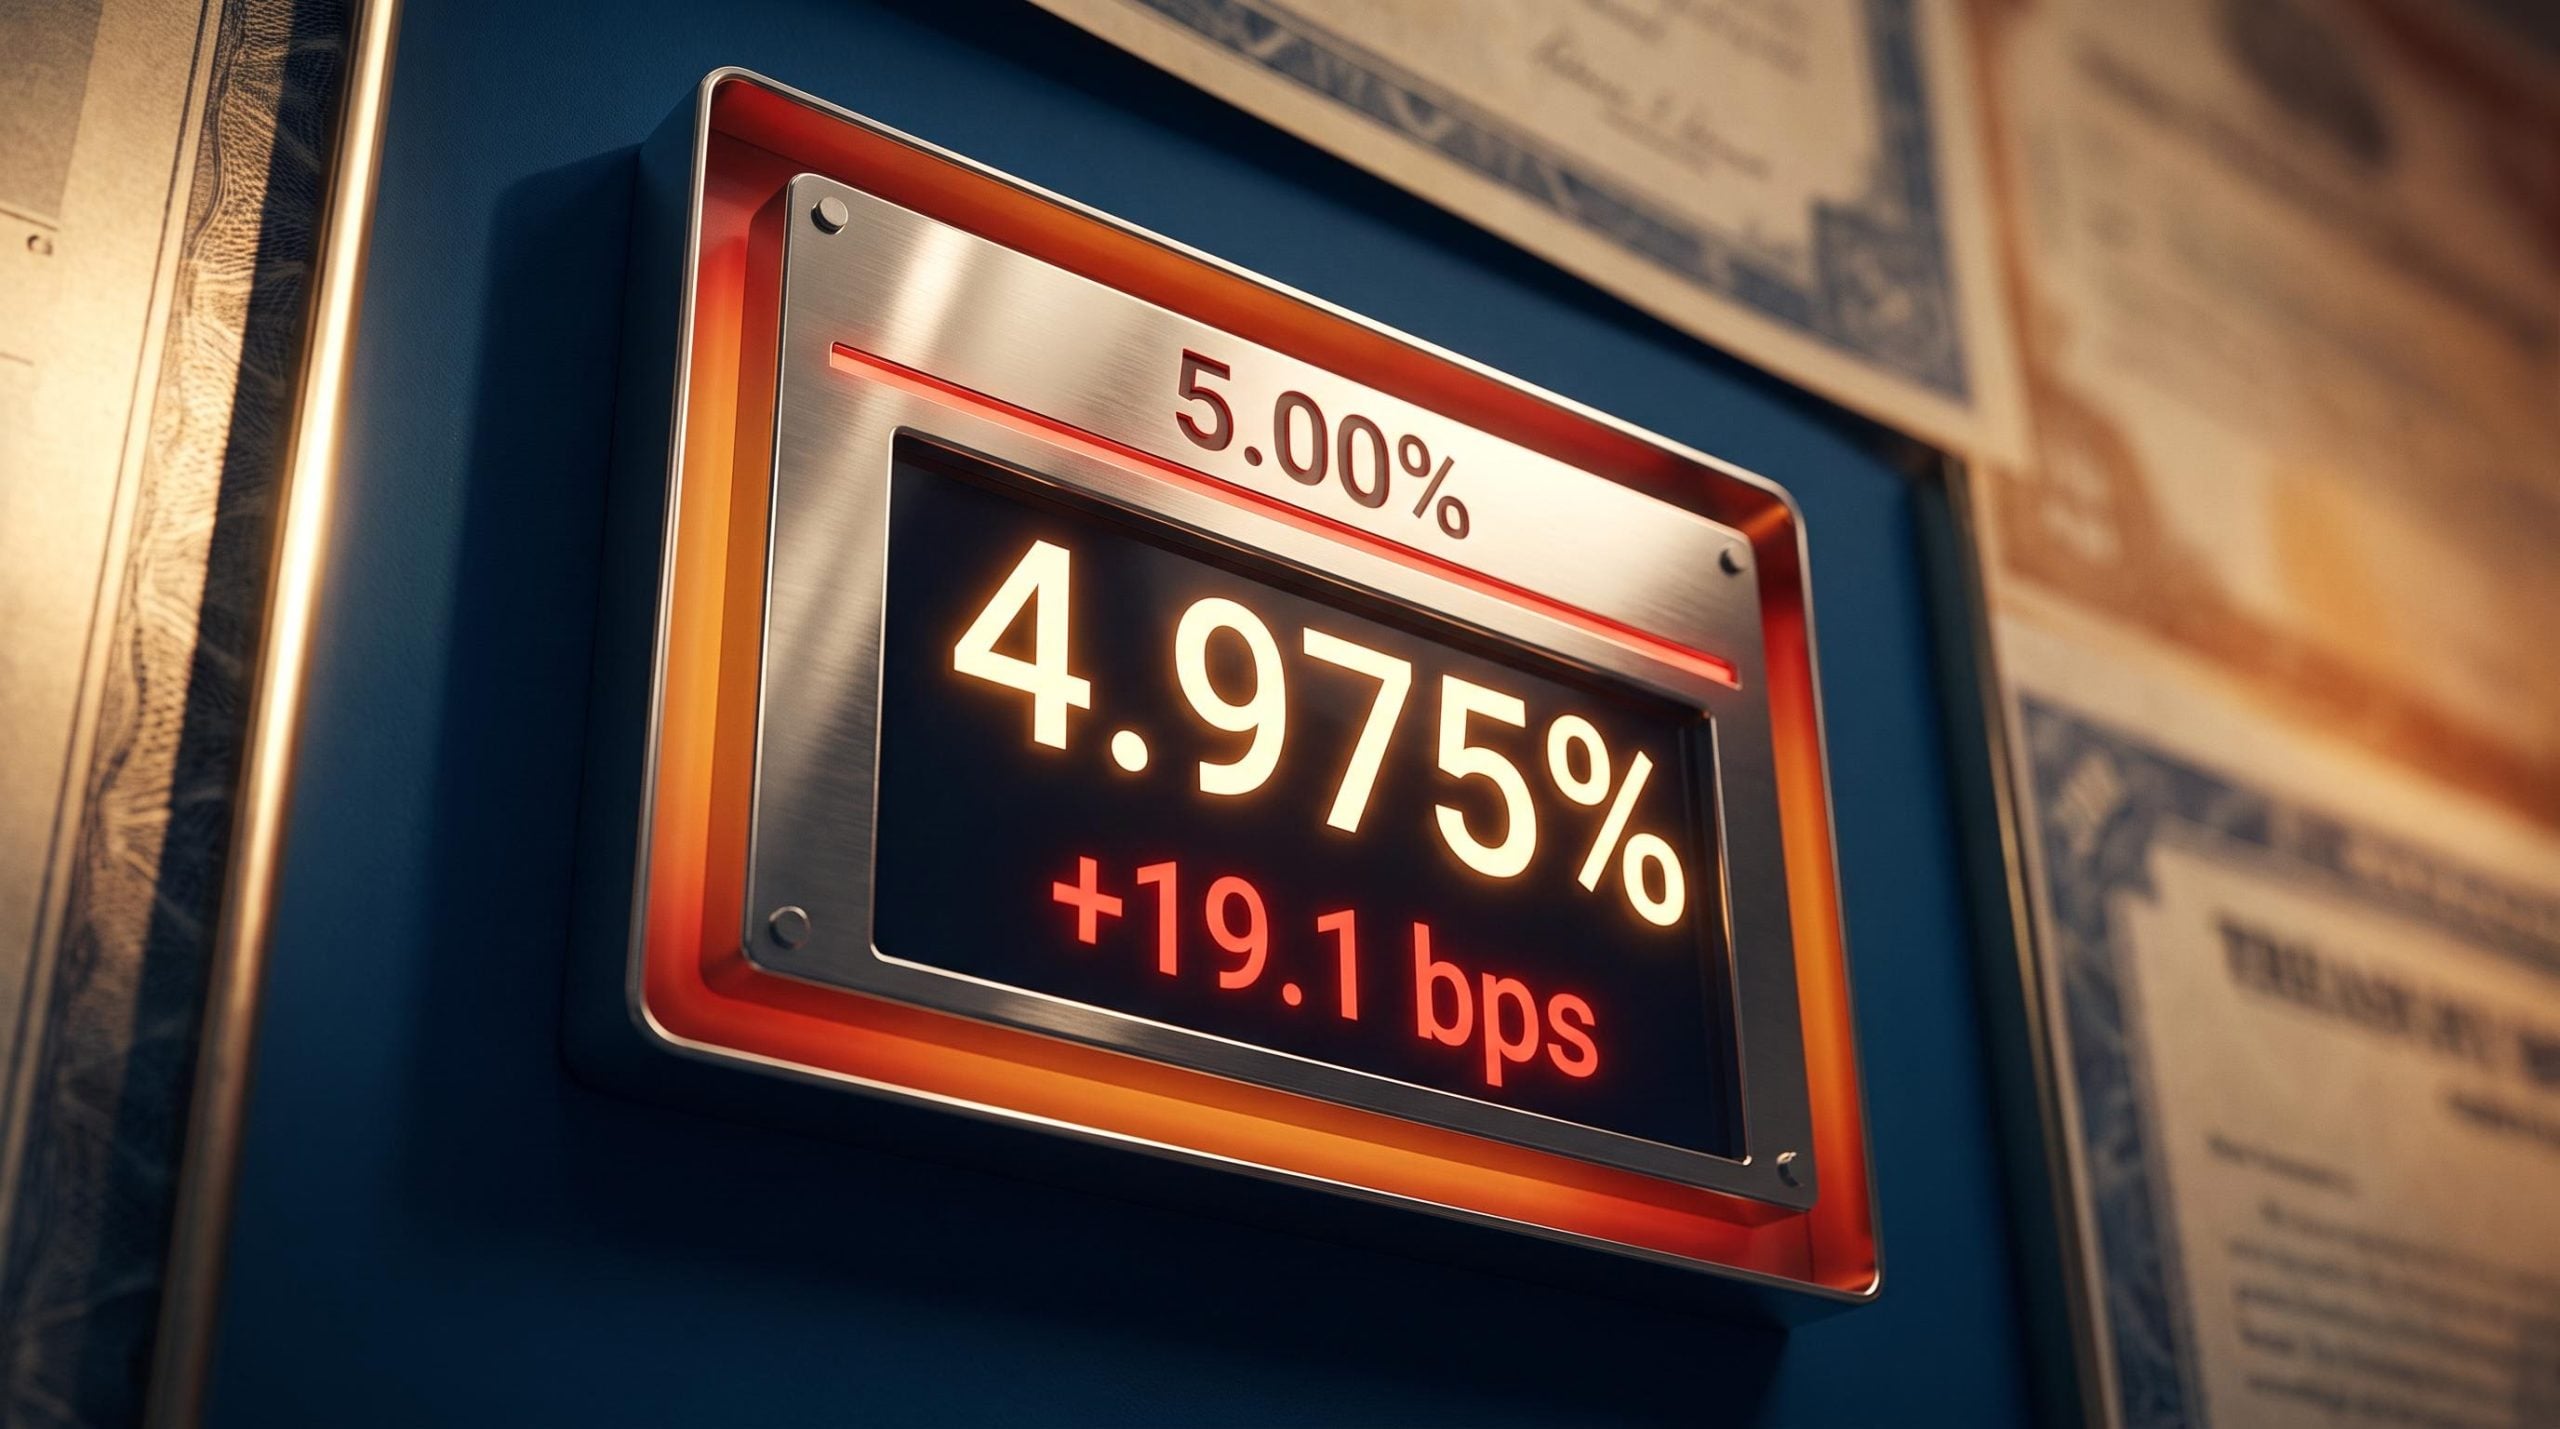
The 10-year US Treasury yield closed the week of 13 September 2026 at 4.975%, sitting at the exact upper boundary of what one prominent research firm considers the containment zone. That figure arrived after a rise of 19.1 basis points in a single week.
Five percent is more than a round number. It is the psychological line where borrowing cost calculations change for households, corporate treasurers, and equity portfolio managers all at once.
The sell-off pushing yields toward that line is not a single-cause event. It is a collision of hotter inflation data, deepening fiscal deficit anxiety, uncertainty over artificial intelligence (AI) infrastructure spending, and a Federal Reserve poised to hike. The Treasury Department has already intervened, and the bond market essentially shrugged.
Here is what the mechanics behind this sell-off actually reveal about where yields go next, and what to do with that view before the Fed meets on 16 September 2026.
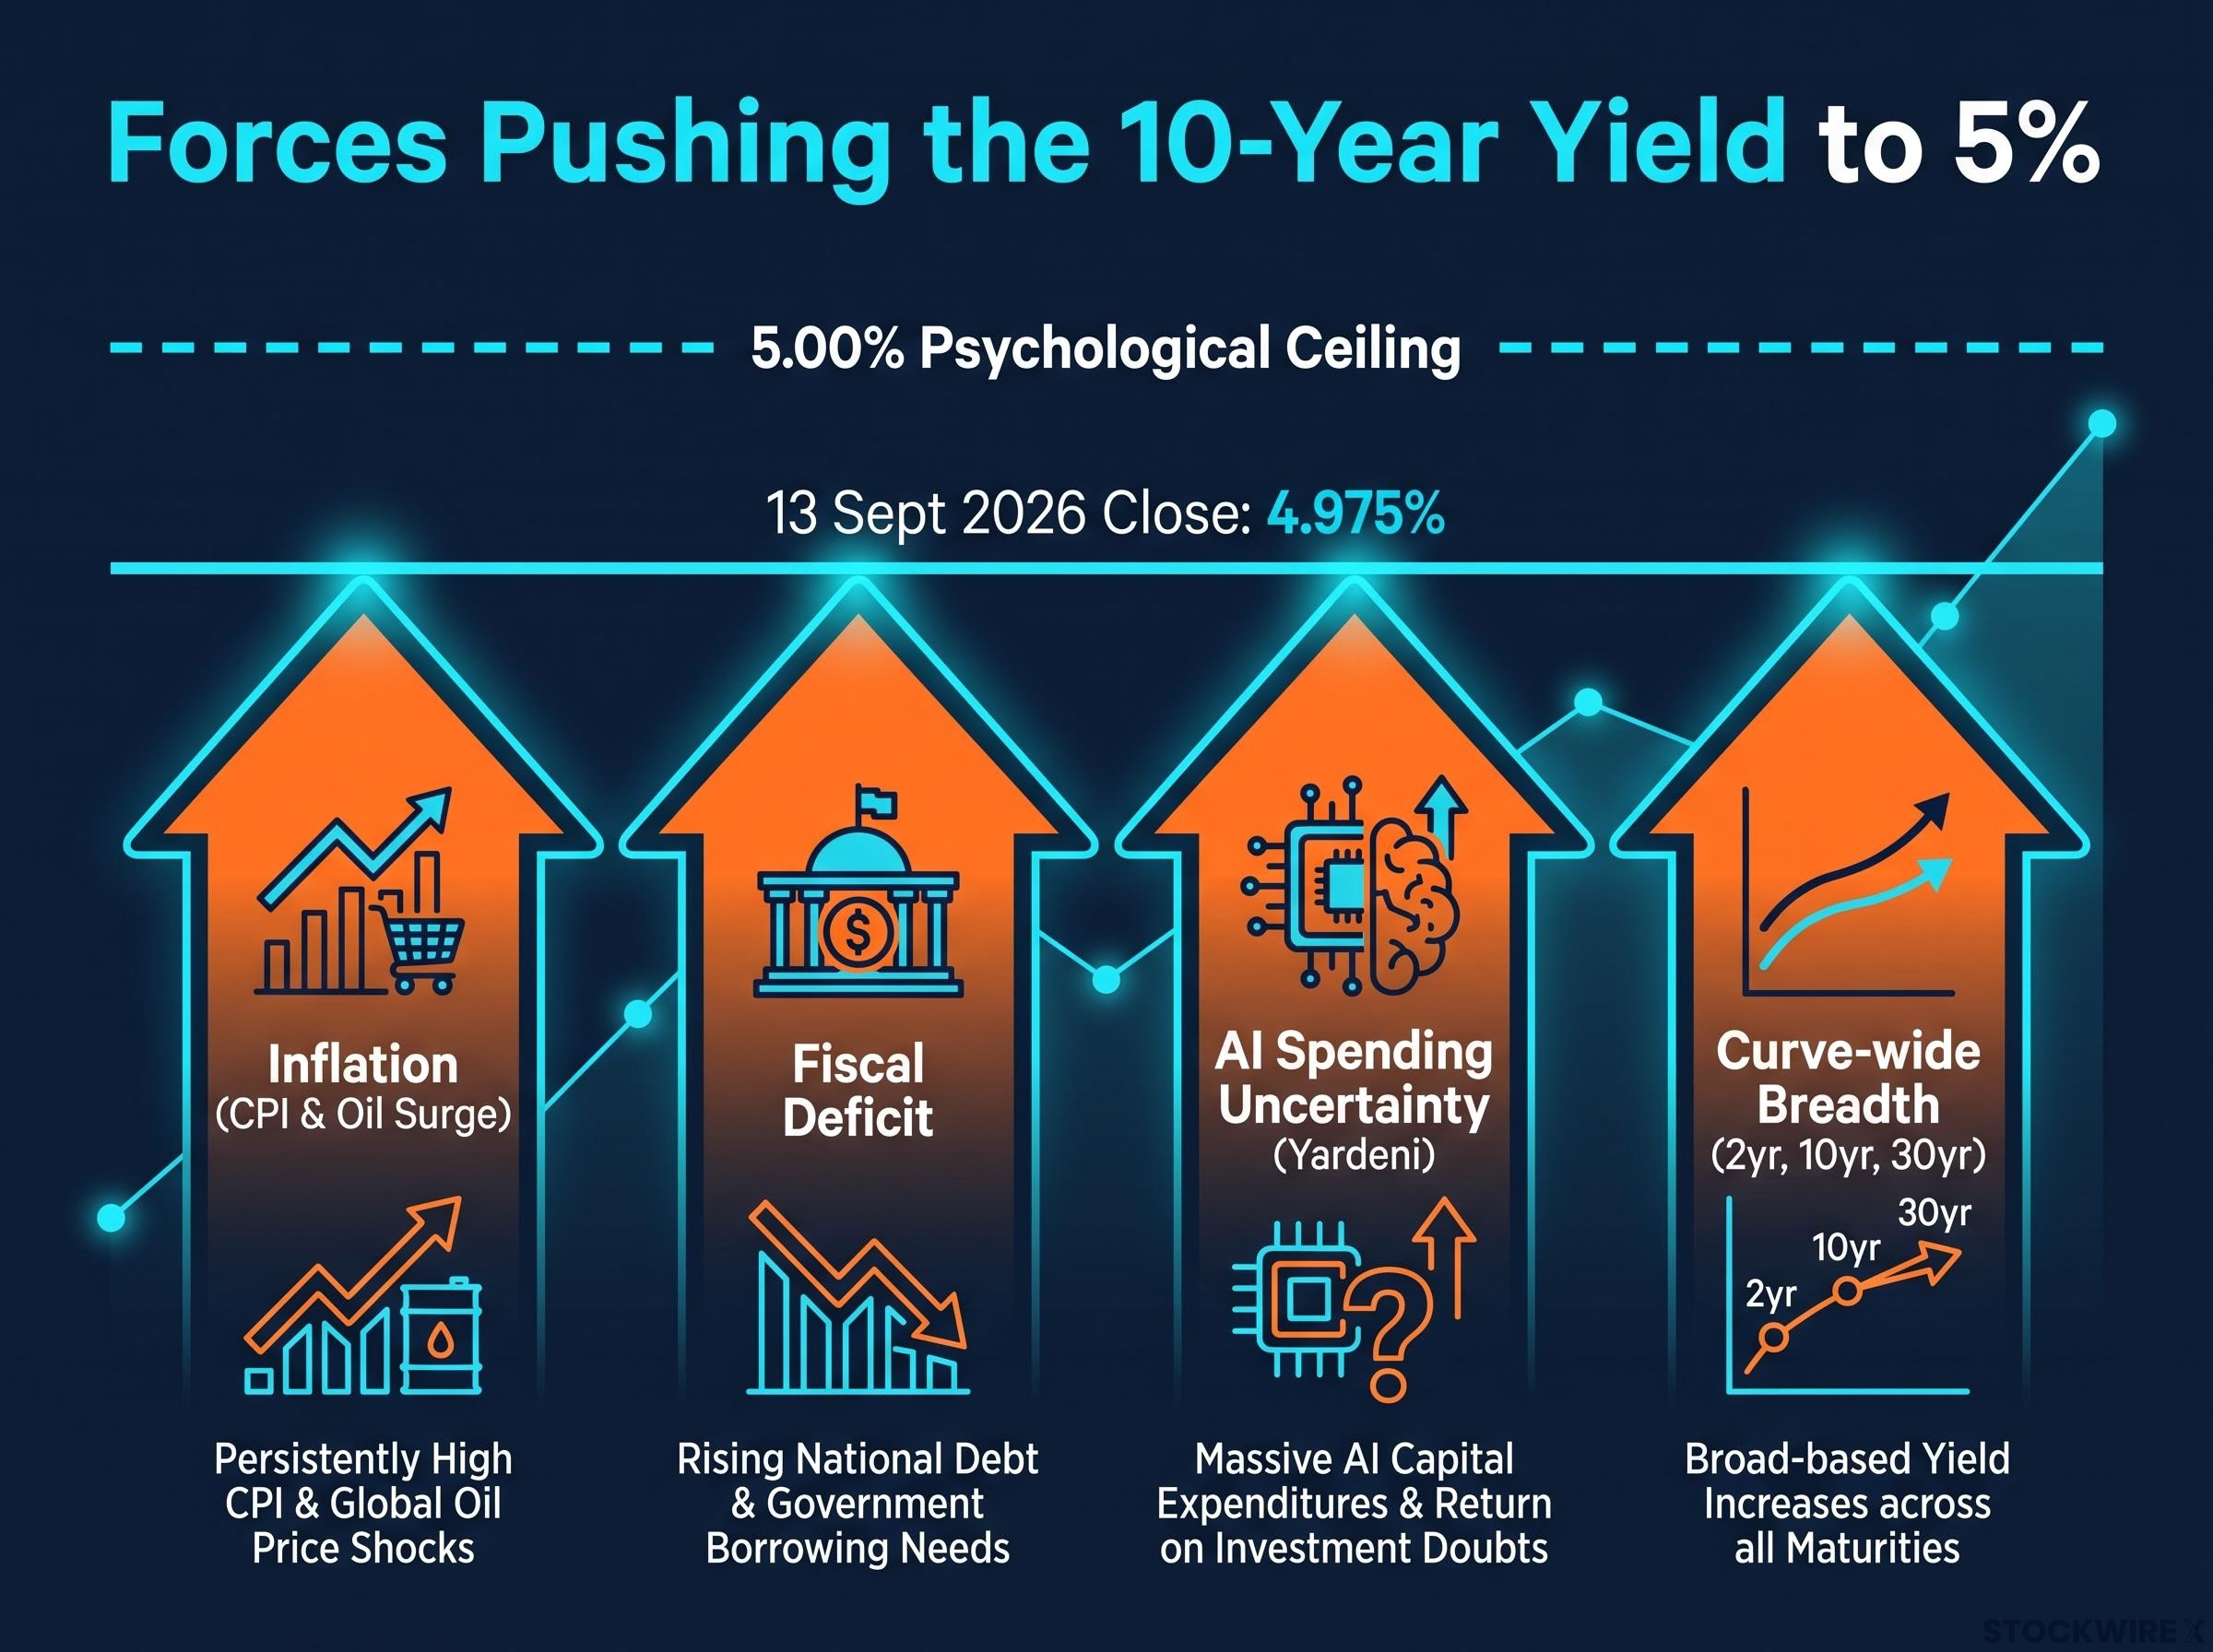
Four forces pushing the 10-year yield to the edge of 5%
No single villain drove yields to the edge of 5%. Each pressure loaded onto the same side of the scale, and that matters for how you read the situation.
The most immediate and quantifiable driver is inflation. According to TradingEconomics, a hotter-than-expected core Consumer Price Index (CPI) reading, the measure of how fast consumer prices are rising, combined with a surge in oil prices to push the 10-year above 4.9% in early September. CNBC’s 10 September 2026 coverage identified the oil price move as the proximate catalyst that lifted the yield to its highest level since 2023.
Underneath that cyclical catalyst sits a slower, structural pressure: the fiscal deficit. Reuters reported that investors remained “neither shocked nor awed” by Treasury intervention, with yields staying elevated because market participants view the government’s mounting debt burden as a persistent term-premium risk, not a passing fluctuation.
The Fed’s share of outstanding public debt has shrunk from roughly 26% in 2021 to approximately 14% in mid-2026, and that contraction in direct ownership is central to understanding bond market independence as the primary force now pricing long-duration money, not the FOMC’s target rate.
A week of relentless selling The 10-year yield rose 19.1 basis points in the week ending 13 September 2026, closing at 4.975%.
Yardeni Research adds a third driver that other sources did not independently cite: uncertainty around large-scale AI infrastructure spending. Treat this as Yardeni’s analytical framing rather than a consensus view, because the Perplexity-accessed sources did not surface it.
The fourth force is breadth. The sell-off ran across the curve, with the 30-year approaching levels not seen in roughly two decades and the 2-year climbing to multi-year highs.
The four pressures, at a glance:
- Inflation: A hotter core CPI print and an oil price surge lifted the 10-year above 4.9%.
- Fiscal deficit: Persistent worry over the debt burden keeps term premiums elevated.
- AI spending uncertainty: Yardeni’s framing of infrastructure spending as a contributor, not independently confirmed elsewhere.
- Curve-wide breadth: Selling hit the 2-year, 10-year, and 30-year together.
That convergence tells you something important. This is not a yield spike you can wait out as one factor normalises. Multiple forces are compressing at once, and which of them resolves first determines whether 5% becomes a ceiling or a floor.
When big ASX news breaks, our subscribers know first
Why the Treasury’s buyback program fell short of what the market wanted
The Treasury Department did not sit still. To understand why its intervention landed so quietly, follow the sequence.
In a press release dated 19 August 2026, the Treasury announced it would at least double the size of its liquidity-support buyback operations for longer-dated securities, raising the per-operation maximum from $2 billion to at least $4 billion. Reuters reported the moves would bring maximum repurchases to $83 billion for the quarter. On announcement day, the 10-year fell only about 6 basis points, a muted reaction.
Then came the operation itself. On 10 September 2026, the Treasury offered to buy as much as $6 billion of debt maturing in 10 to 20 years. It received roughly $10.489 billion in submitted offers and accepted approximately $5.187 billion.
Here is the problem. Market participants had anticipated a buyback of at least $10 billion. The $6 billion cap fell short, and yields on the 10-, 20-, and 30-year Treasuries rose after the operation rather than falling.
| Stage | Announced cap | Market expectation | Actual accepted |
|---|---|---|---|
| August 2026 policy announcement | $4 billion minimum | Larger scale sought | Not applicable |
| 10 September 2026 operation | $6 billion | At least $10 billion | ~$5.187 billion |
The arithmetic explains the market’s indifference.
Treasury buyback mechanics distinguish between a signalling effect and a scale effect: the August 2026 programme announcement moved yields more than the actual operations because the signal, not the dollar volume, is what dislodges positioning in a market trading above $1 trillion per day.
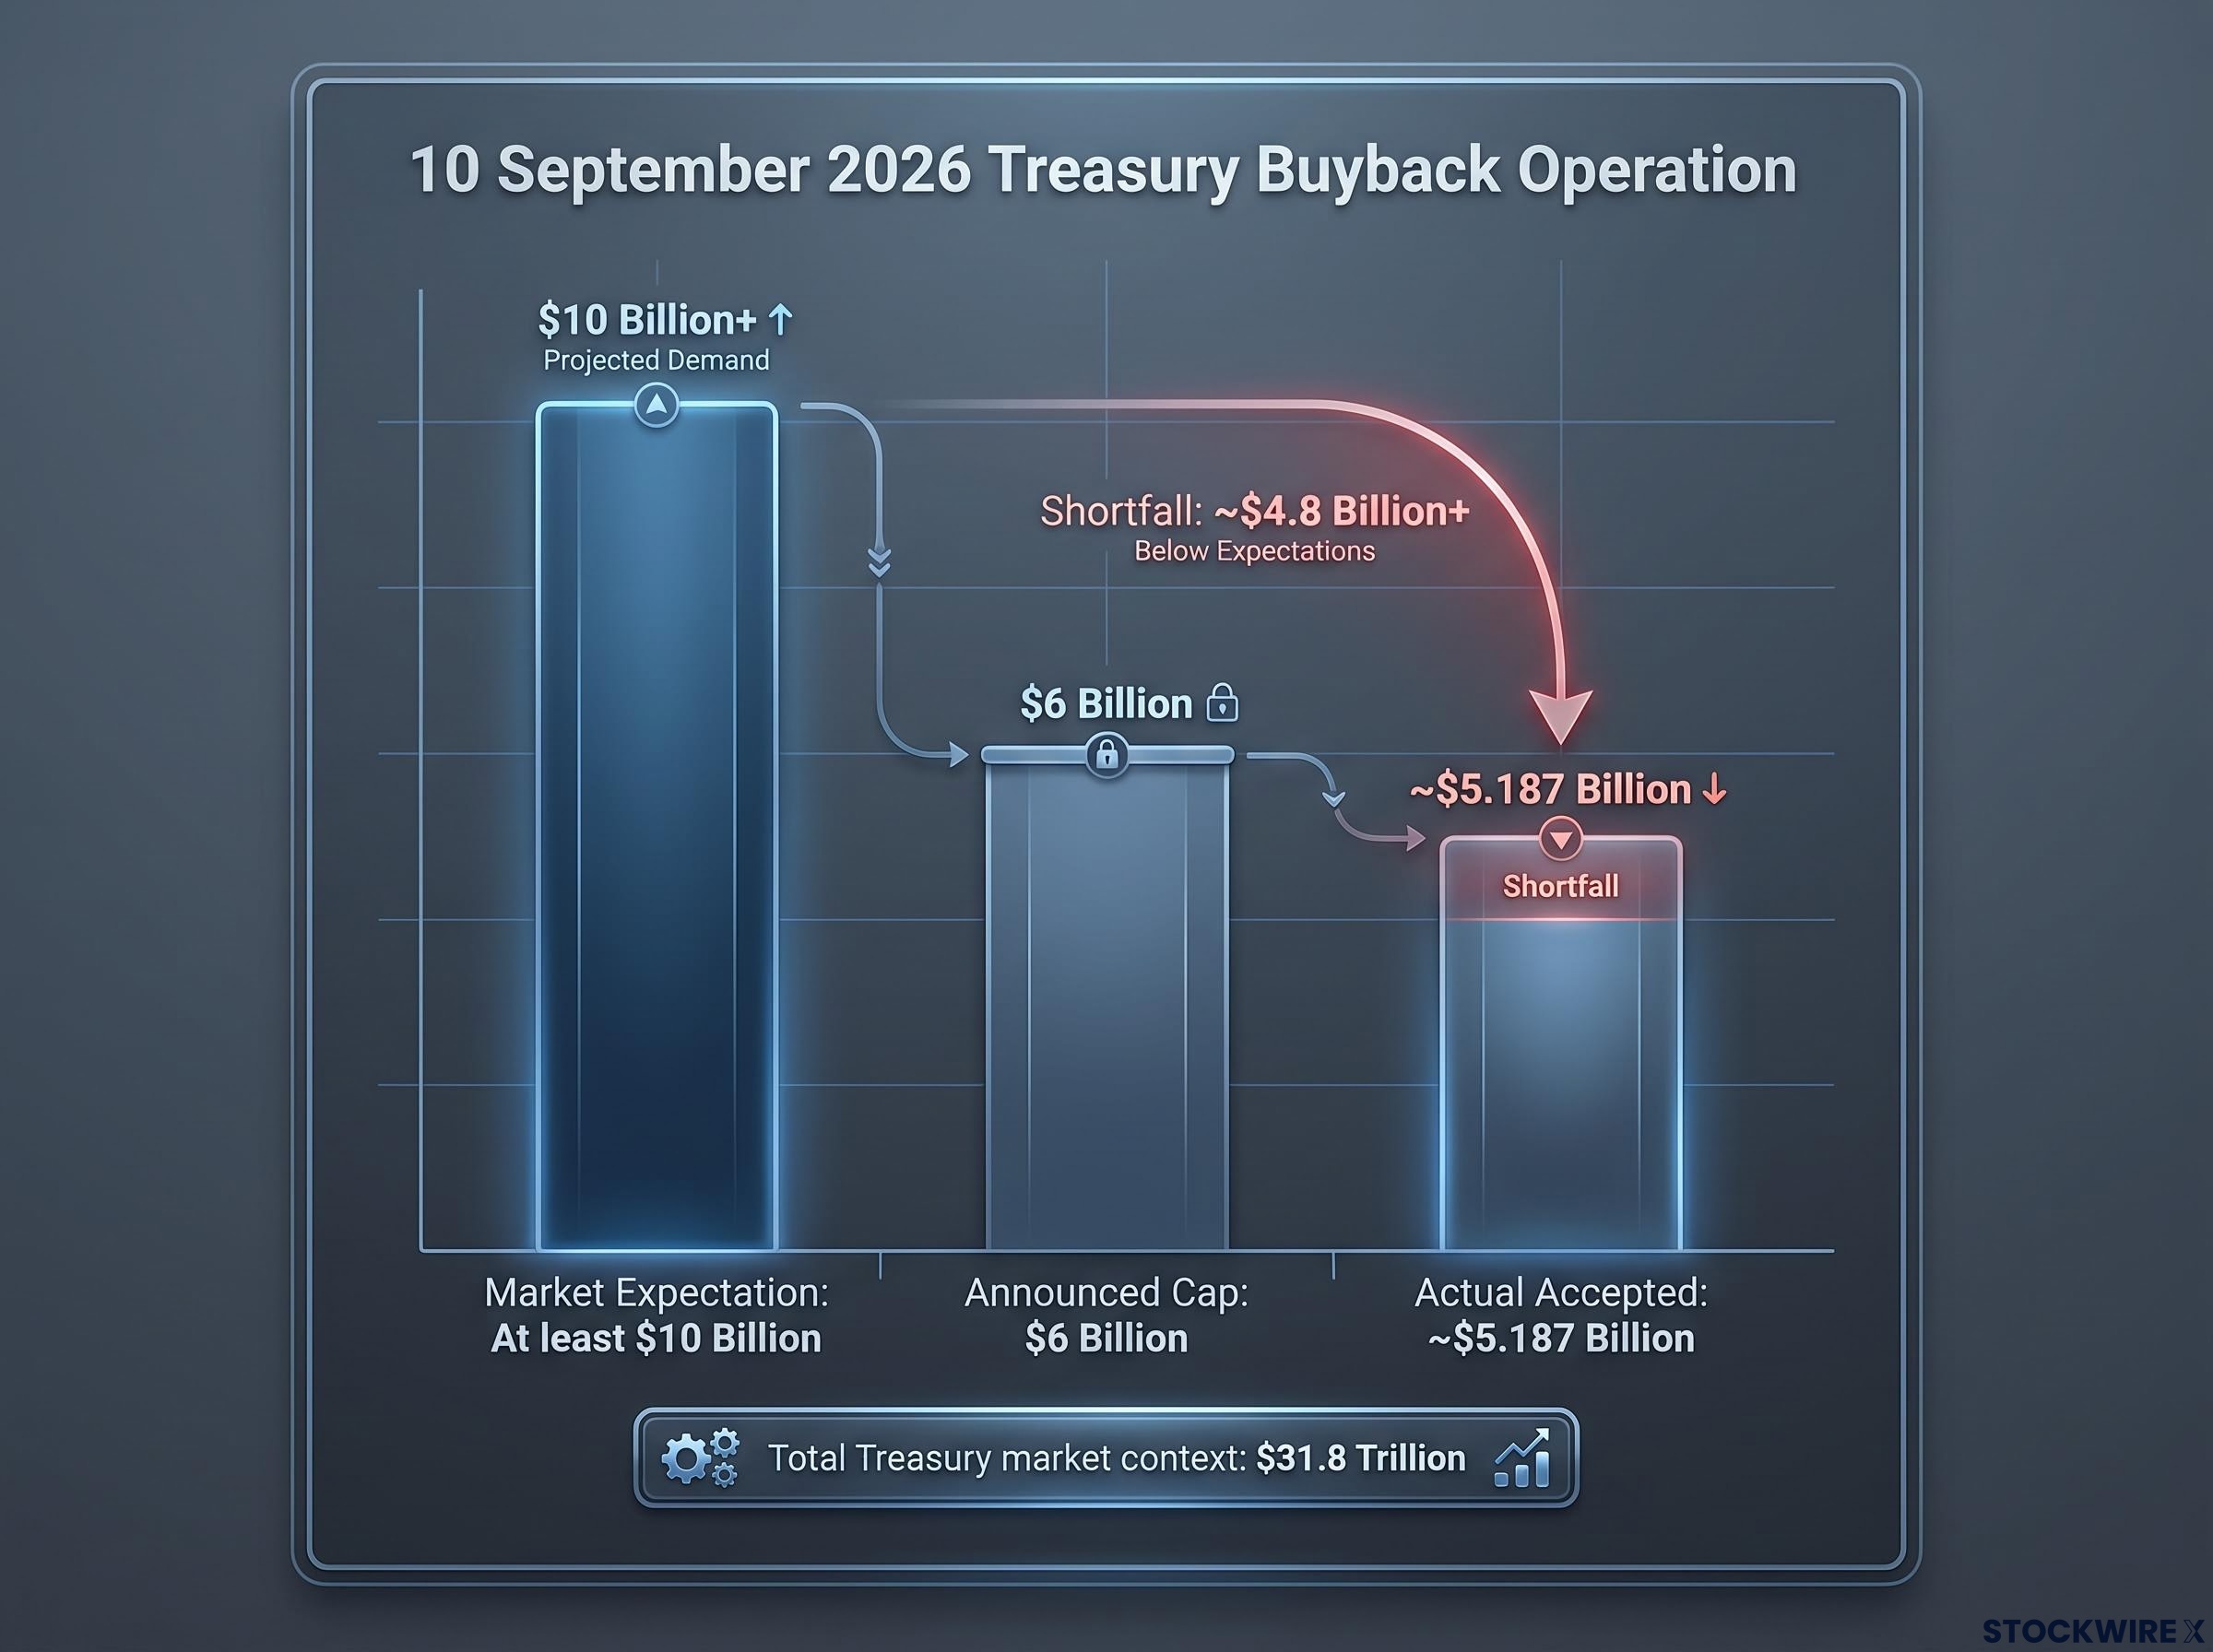
A rounding error against the market Yardeni Research characterised the $6 billion operation as a negligible proportion of the $31.8 trillion Treasury market, which includes roughly $5.5 trillion in long bonds.
Yardeni frames the escalation option as the “Bessent Twist,” named for Treasury Secretary Scott Bessent. It would fund substantially larger long-bond repurchases by issuing additional short-term Treasury bills, echoing the Federal Reserve’s historical Operation Twist but executed at the Treasury level.
The structural limitation is the point that matters for you. Buybacks improve trading liquidity and reduce fragmentation in specific issues, but they do not shrink the government’s aggregate borrowing needs or its long-term debt stock. Term premiums stay elevated regardless.
If you understood the scale mismatch before the operation, you would not have repositioned defensively on the strength of a Treasury press release. Knowing the mechanics is what prevents false reassurance from headline-level policy.
What a 5% yield actually means for mortgages, equities, and portfolio positioning
A yield reading is abstract until you map it onto a balance sheet. Near 5%, the 10-year stops being a bond market statistic and becomes a direct input into your household finances and your portfolio.
Start with consumer borrowing. CNBC explicitly identifies the 10-year yield as the benchmark that sets mortgage rates, auto loan pricing, and credit-card costs. A yield near 5% translates directly into tighter household financial conditions.
Mortgage rate transmission from a 10-year yield near 5% is not uniform: the spread between the benchmark and the 30-year fixed rate has normalised from its 2022–2023 peak of roughly 3 percentage points to approximately 2 points, meaning a yield at 4.975% maps to a mortgage rate near 6.975% rather than the 7.975% the wider spread once implied.
Corporate financing feels it next. Corporate bonds are priced as a spread over Treasuries, so a risk-free rate near 5% mechanically lifts the total cost of debt issuance for both investment-grade and high-yield borrowers.
The four transmission channels:
- Mortgages and consumer credit: Higher benchmark yields raise mortgage, auto, and credit-card rates.
- Corporate bond issuance costs: A higher risk-free rate lifts the total cost of borrowing across credit quality.
- Equity discount rates: A higher discount rate compresses price-earnings multiples.
- 60/40 rebalancing pressure: A near-5% risk-free yield competes directly with equities for allocation.
A 10-year yield at 4.975% is not just a bond story. It is an input into every asset-class valuation and every borrowing decision, which means your exposure to this development is almost certainly broader than you have accounted for.
The equity valuation squeeze
Equity valuations rest on a discount rate, which converts future earnings into a present value. As the risk-free rate rises, those future cash flows are worth less today.
Companies whose value sits in distant future earnings face the steepest re-rating. Long-duration growth sectors are the most exposed, because so little of their worth is anchored in near-term profits.
Rethinking the 60/40 portfolio at near-5% yields
For a decade, bonds offered little competition to equities. A near-5% nominal yield on a risk-free Treasury changes that. It is a level at which government bonds genuinely compete for allocation in a traditional 60/40 portfolio, the classic split of 60% stocks and 40% bonds.
There is a tension worth naming. Buying duration now locks in a near-5% yield, but it also exposes you to mark-to-market losses if the 10-year breaches 5% and keeps climbing.
This section is meant to give you diagnostic questions, not passive observation. Where does your household borrowing sit, and how much duration risk are you actually carrying?
The Fed meeting, the competing forecasts, and what the range between them tells you
The nearest binary event is the FOMC meeting on 16 September 2026, and informed analysts genuinely disagree on what a hike would do to long yields.
Prediction markets are close to a coin toss on the hike itself, based on 8 September 2026 data reported by Yahoo Finance:
The Federal Reserve news and events page provides direct access to FOMC minutes, press releases, and recent speeches by Governor Waller and Chairman Warsh, all of which carry direct weight on how markets are pricing the September hike probability.
- CME FedWatch: approximately 56% probability of a 25 basis point hike.
- Polymarket: approximately 49%.
- Kalshi: approximately 48%.
The disagreement sits in the direction of the effect, not the odds.
| View | Source | Implication for long-duration yields |
|---|---|---|
| Hike adds rate pressure | TradingEconomics framing | Rising hike odds have accompanied higher long yields, suggesting a hike lifts them further |
| Hike reinforces credibility, moderates long-end | Yardeni Research | Demonstrated policy resolve could reduce embedded inflation expectations and ease long-end pressure |
TradingEconomics observes that rising hike expectations have moved alongside higher long yields, with the 2-year and 10-year climbing together. Yardeni takes the opposite read, arguing a hike would reinforce Fed credibility and could moderate upward pressure on the long end.
A ceiling under test Yardeni Research projects a 10-year yield range of 4.00% to 5.00%. The yield closed the week at 4.975%, sitting at the very top of that band.
Yardeni also holds that the Fed should have hiked back in July 2026, which implies the September action is arriving late and its credibility-restoring effect may already be partly discounted.
That divergence is not analytical confusion. It reflects genuine structural ambiguity in how the curve responds to tightening at this stage of the cycle. If you understand both arguments, you are better placed to adjust as the evidence resolves. The fact that a well-regarded firm’s containment ceiling and the live market yield are essentially the same number tells you the forecast is being tested in real time.
Whether 5% holds as a ceiling or becomes the new floor
The contest ahead is straightforward to frame. On one side sit the four structural pressures and the sheer supply of bonds. On the other sit policy credibility, the Treasury’s buyback firepower of up to $83 billion for the quarter, and demand from buyers attracted by near-5% yields.
Treasury buyer composition has shifted materially beneath the headline yield numbers: foreign holders have plateaued near 33% of outstanding debt while domestic commercial banks have stepped in as the primary marginal buyer, reaching a record $4.8 trillion in holdings, a structural rotation that keeps term premiums elevated regardless of any single policy intervention.
Yardeni’s 4.00% to 5.00% range is the organising framework, and the potential Bessent Twist is the next-level intervention if the current buyback scale proves insufficient.
Rather than wait and see, watch these variables in priority order over the next four to six weeks:
- The FOMC decision and statement language on 16 September 2026, the nearest binary event.
- The size and market reception of subsequent Treasury buyback operations.
- Signals of escalation toward the full Bessent Twist mechanism.
- Incoming CPI and energy price data that could reignite or ease the inflation catalyst.
There is an asymmetry embedded in the current position that deserves attention.
The tail risk near the threshold A decisive breach of 5% could accelerate selling from rules-based and risk-parity strategies positioned on the assumption that the range holds.
Your primary decision here is not whether to watch the bond market. It is how much duration risk you currently hold, and whether that exposure is deliberate.
This article is for informational purposes only and should not be considered financial advice. Investors should conduct their own research and consult with financial professionals before making investment decisions. Past performance does not guarantee future results, and financial projections are subject to market conditions and various risk factors. Forward-looking views cited here are speculative and subject to change based on market and policy developments.