In volatile markets, the natural instinct is to trade less, sit tight, and wait for clarity. Experienced options traders often do the opposite. They layer multiple contract legs into a single position, building structures like butterfly spreads and calendar spreads that are designed to profit from the very uncertainty that keeps most people on the sidelines.
Right now, that mindset has a fitting backdrop. The Nasdaq-100 is sitting near record highs while the Cboe Nasdaq Volatility Index (VXN) tracks in the low 20s, about 22.05 as of mid-September 2026. That combination makes short-dated multi-leg strategies relatively affordable to enter and acutely sensitive to a single day’s move. It is no fringe corner of the market, either: zero-days-to-expiration (0DTE) index options now account for roughly 65% of total S&P 500 (SPX) options volume.
What follows below is a mechanics-first breakdown of how butterfly spreads and call calendar spreads actually work, using real Nasdaq-100 (NDX) and single-stock trade examples. By the time you finish, you will be able to recognise these structures when they appear and judge whether they belong in your own toolkit.
Why short-dated options have taken over the market
The scale here is easy to underestimate. According to Cboe data from May 2026, SPX 0DTE contracts averaged 3.1 million per day, roughly 65% of all SPX options volume. Across Cboe’s platforms, overall 0DTE volume was up 46.2% year-to-date as of July 2026, exceeding 20 million contracts per day. The wider U.S. options market cleared a record 15.2 billion contracts in 2025.
The 0DTE gamma dynamics that drive this volume are not passive: dealer delta hedging converts open interest into real index flows, with gamma running 2 to 5 times higher than equivalent weekly contracts and up to 10 times higher near the session close, which is exactly why a butterfly positioned at the wrong strike can swing violently in the final hour.
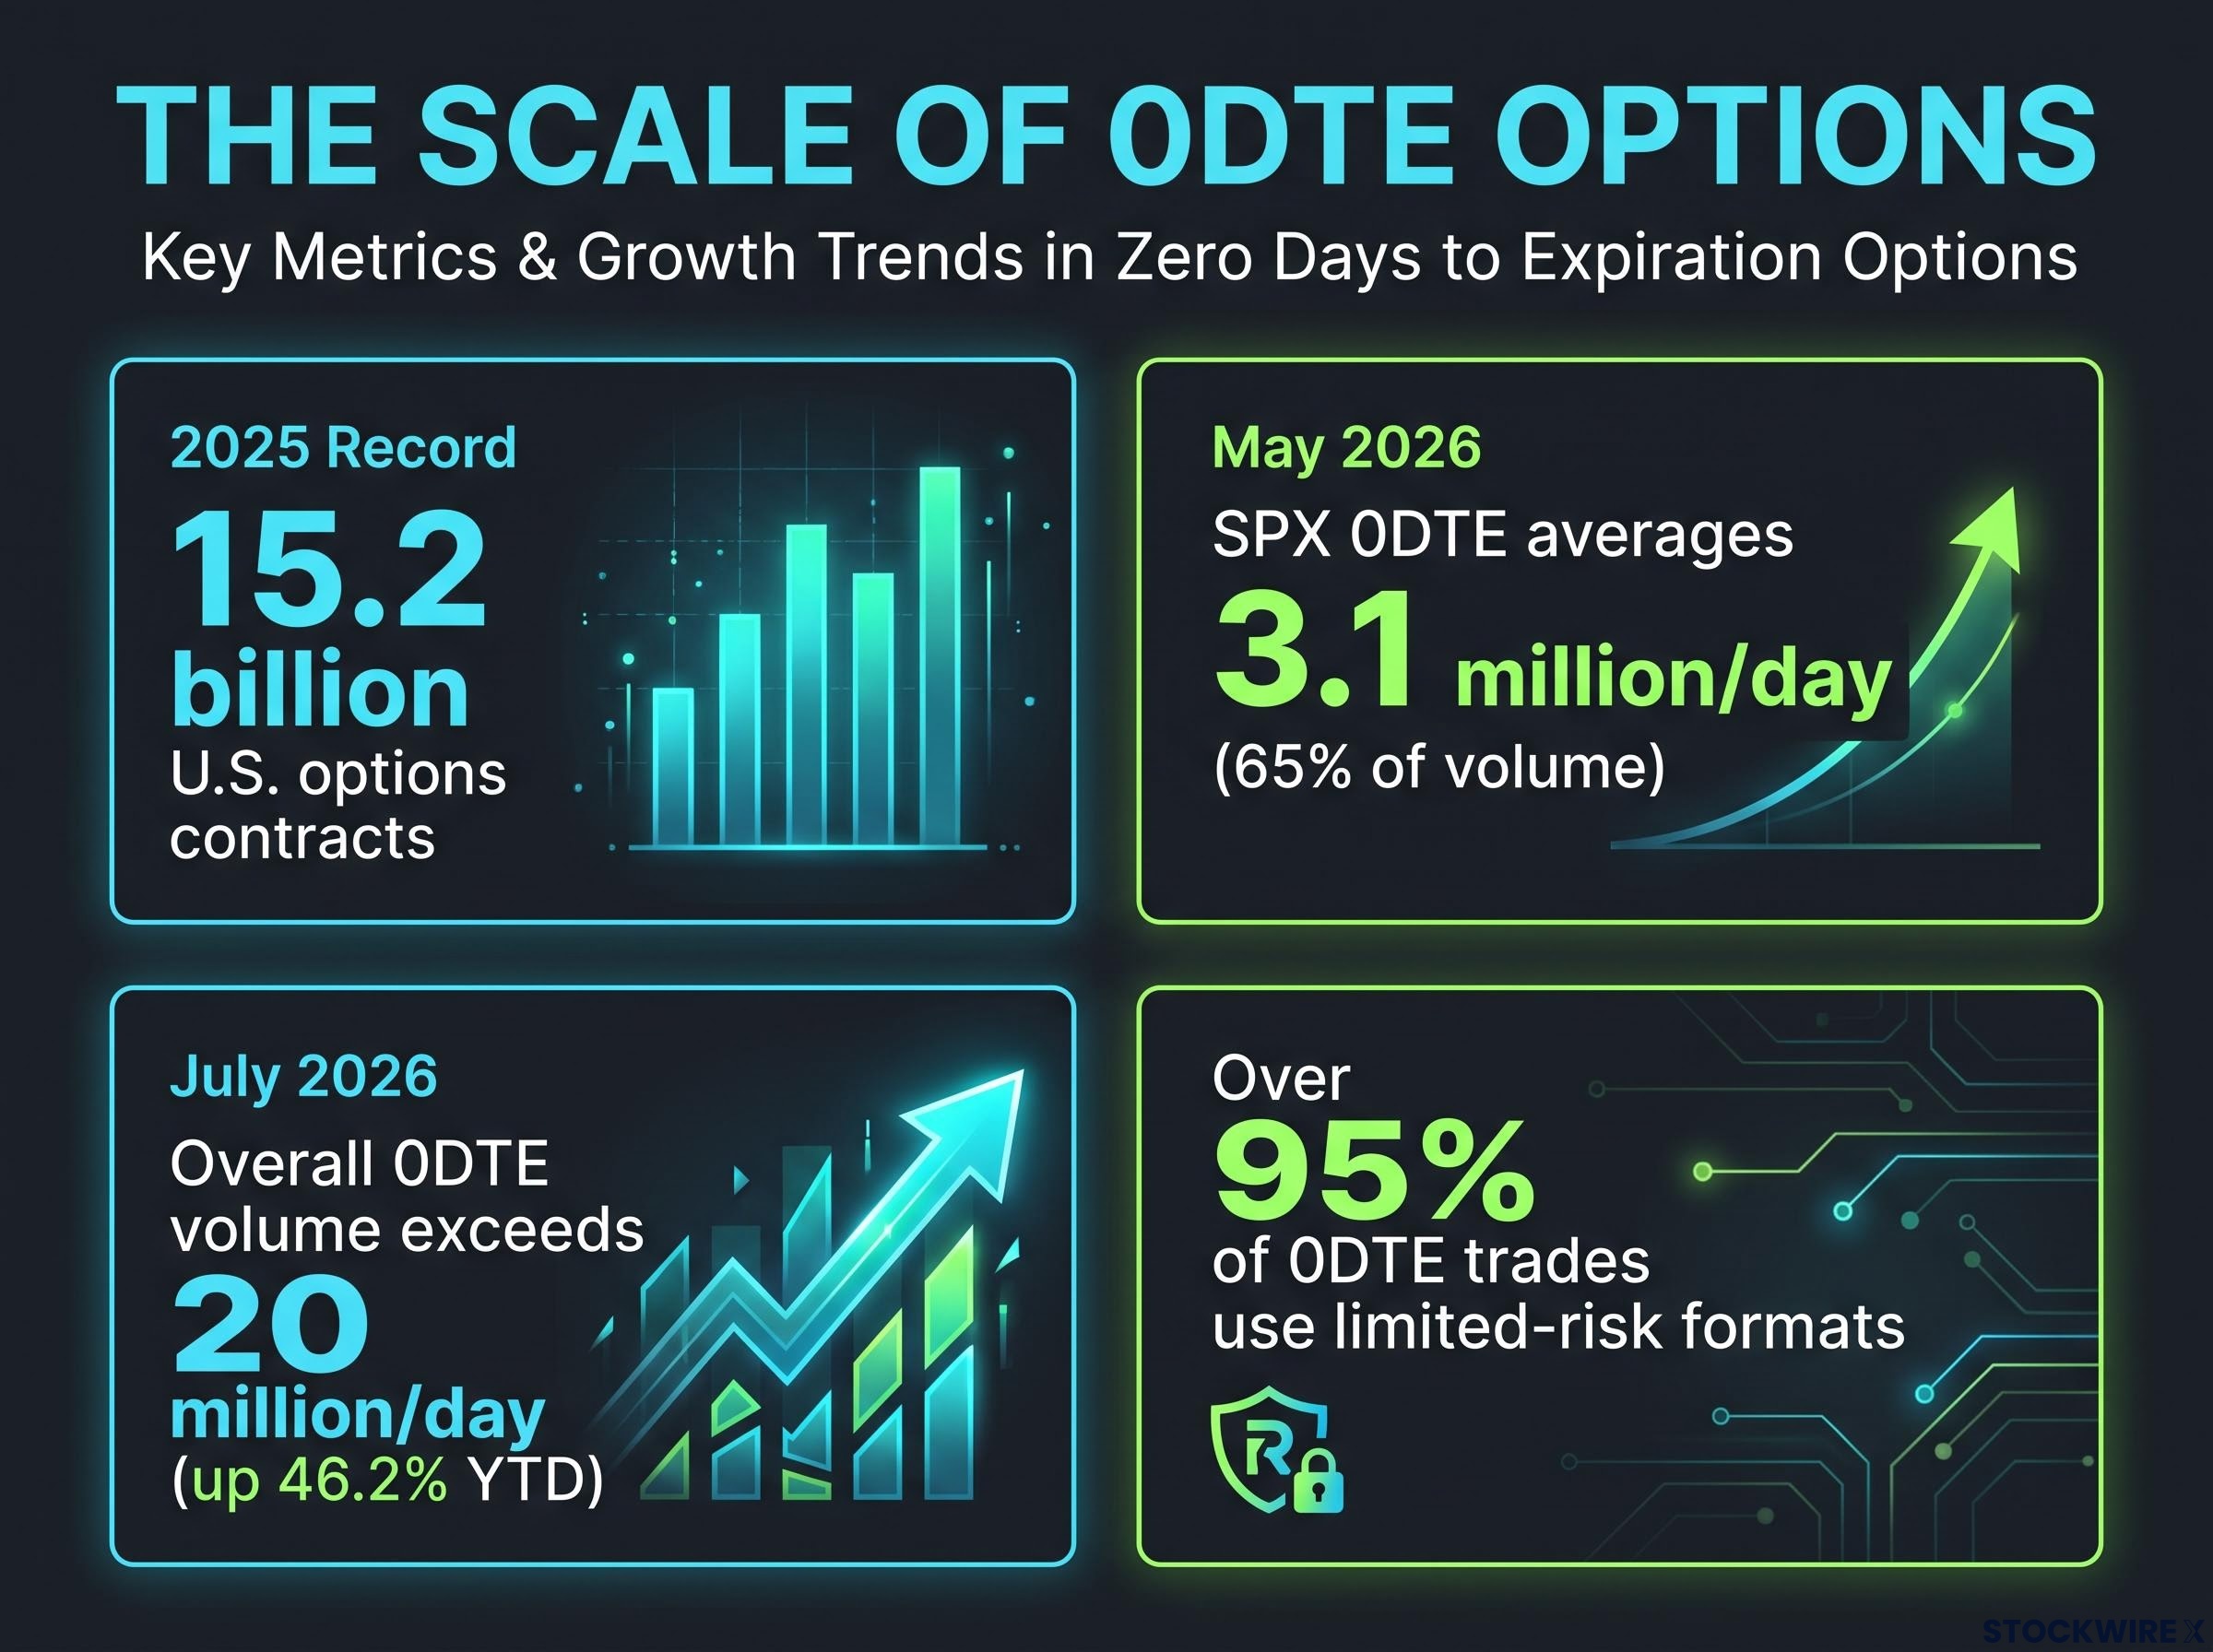
The 0DTE reality Around 65% of all SPX options volume now trades with zero days left to expiration. When you see a 0DTE butterfly discussed, you are looking at the dominant form of index options activity in the United States, not an edge-case tactic.
So why have traders piled into contracts that live and die inside a single session? Three structural features drive the appeal:
- Defined maximum loss. With spread structures, the most you can lose is the net cost paid to open the position.
- No overnight gap risk. The trade closes by the end of the session, so you never carry exposure across nights or weekends when bad news can strike.
- Session-range alignment. These contracts let you exploit a single day’s expected move without paying for time you do not need.
What “cash-settled” means for index options
Both the NDX and SPX are cash-settled instruments. That means when the contract expires, no shares change hands. The position simply settles in cash based on where the index closes.
This matters for the butterfly structures ahead. Because there is no physical delivery, you never risk waking up with an unexpected stock position, which is exactly what can happen with physically settled ETF options like those on QQQ or SPY. That cleaner settlement is a big reason NDX index options have become a common venue for the multi-leg trades described next.
The volatility backdrop reinforces the point. The VXN spiked to 30.84 on 29 July 2026 before settling back into the low 20s, and moderate implied volatility keeps these butterflies relatively cheap to build while leaving them highly reactive to intraday swings.
Implied volatility is the single input that sets every premium level across the chain, so even a one-point shift in the VXN can meaningfully change the cost of entering a butterfly or the richness of the short leg in a calendar spread.
When big ASX news breaks, our subscribers know first
How a butterfly spread works, and what the NDX trade structure shows you
Start with a real signal. Traders recently ran a 0DTE put butterfly on the NDX using the 28,700 / 28,500 / 28,350 strikes. Read that structure and you can decode the whole strategy.
A butterfly spread has three strike prices and four contracts. You buy the outer strikes, called the wings, and sell two contracts at the middle strike, called the body. The wings cap your risk in both directions; the body is where your profit concentrates.
Here is the payoff logic in three steps:
- You pay a net debit to open the position. That debit is your maximum possible loss, full stop.
- Maximum profit sits at the body strike. If the index closes right at the short strikes at expiration, the position pays out its most.
- The wings provide protection. If the index misses the body entirely, your loss stops at the debit you already paid.
With the put butterfly centred at 28,500, the trader needed a same-session decline to push the NDX down into that profit zone. If the index stayed flat, the position was built to expire worthless.
Now flip the structure. The same traders bought an upside call butterfly at the 29,350 / 29,400 / 29,450 strikes for $2.90 per spread, on a $5,000-wide structure. With the NDX near 28,945, that position needed a rally to pay off, and it acted as a hedge against the bearish put butterfly.
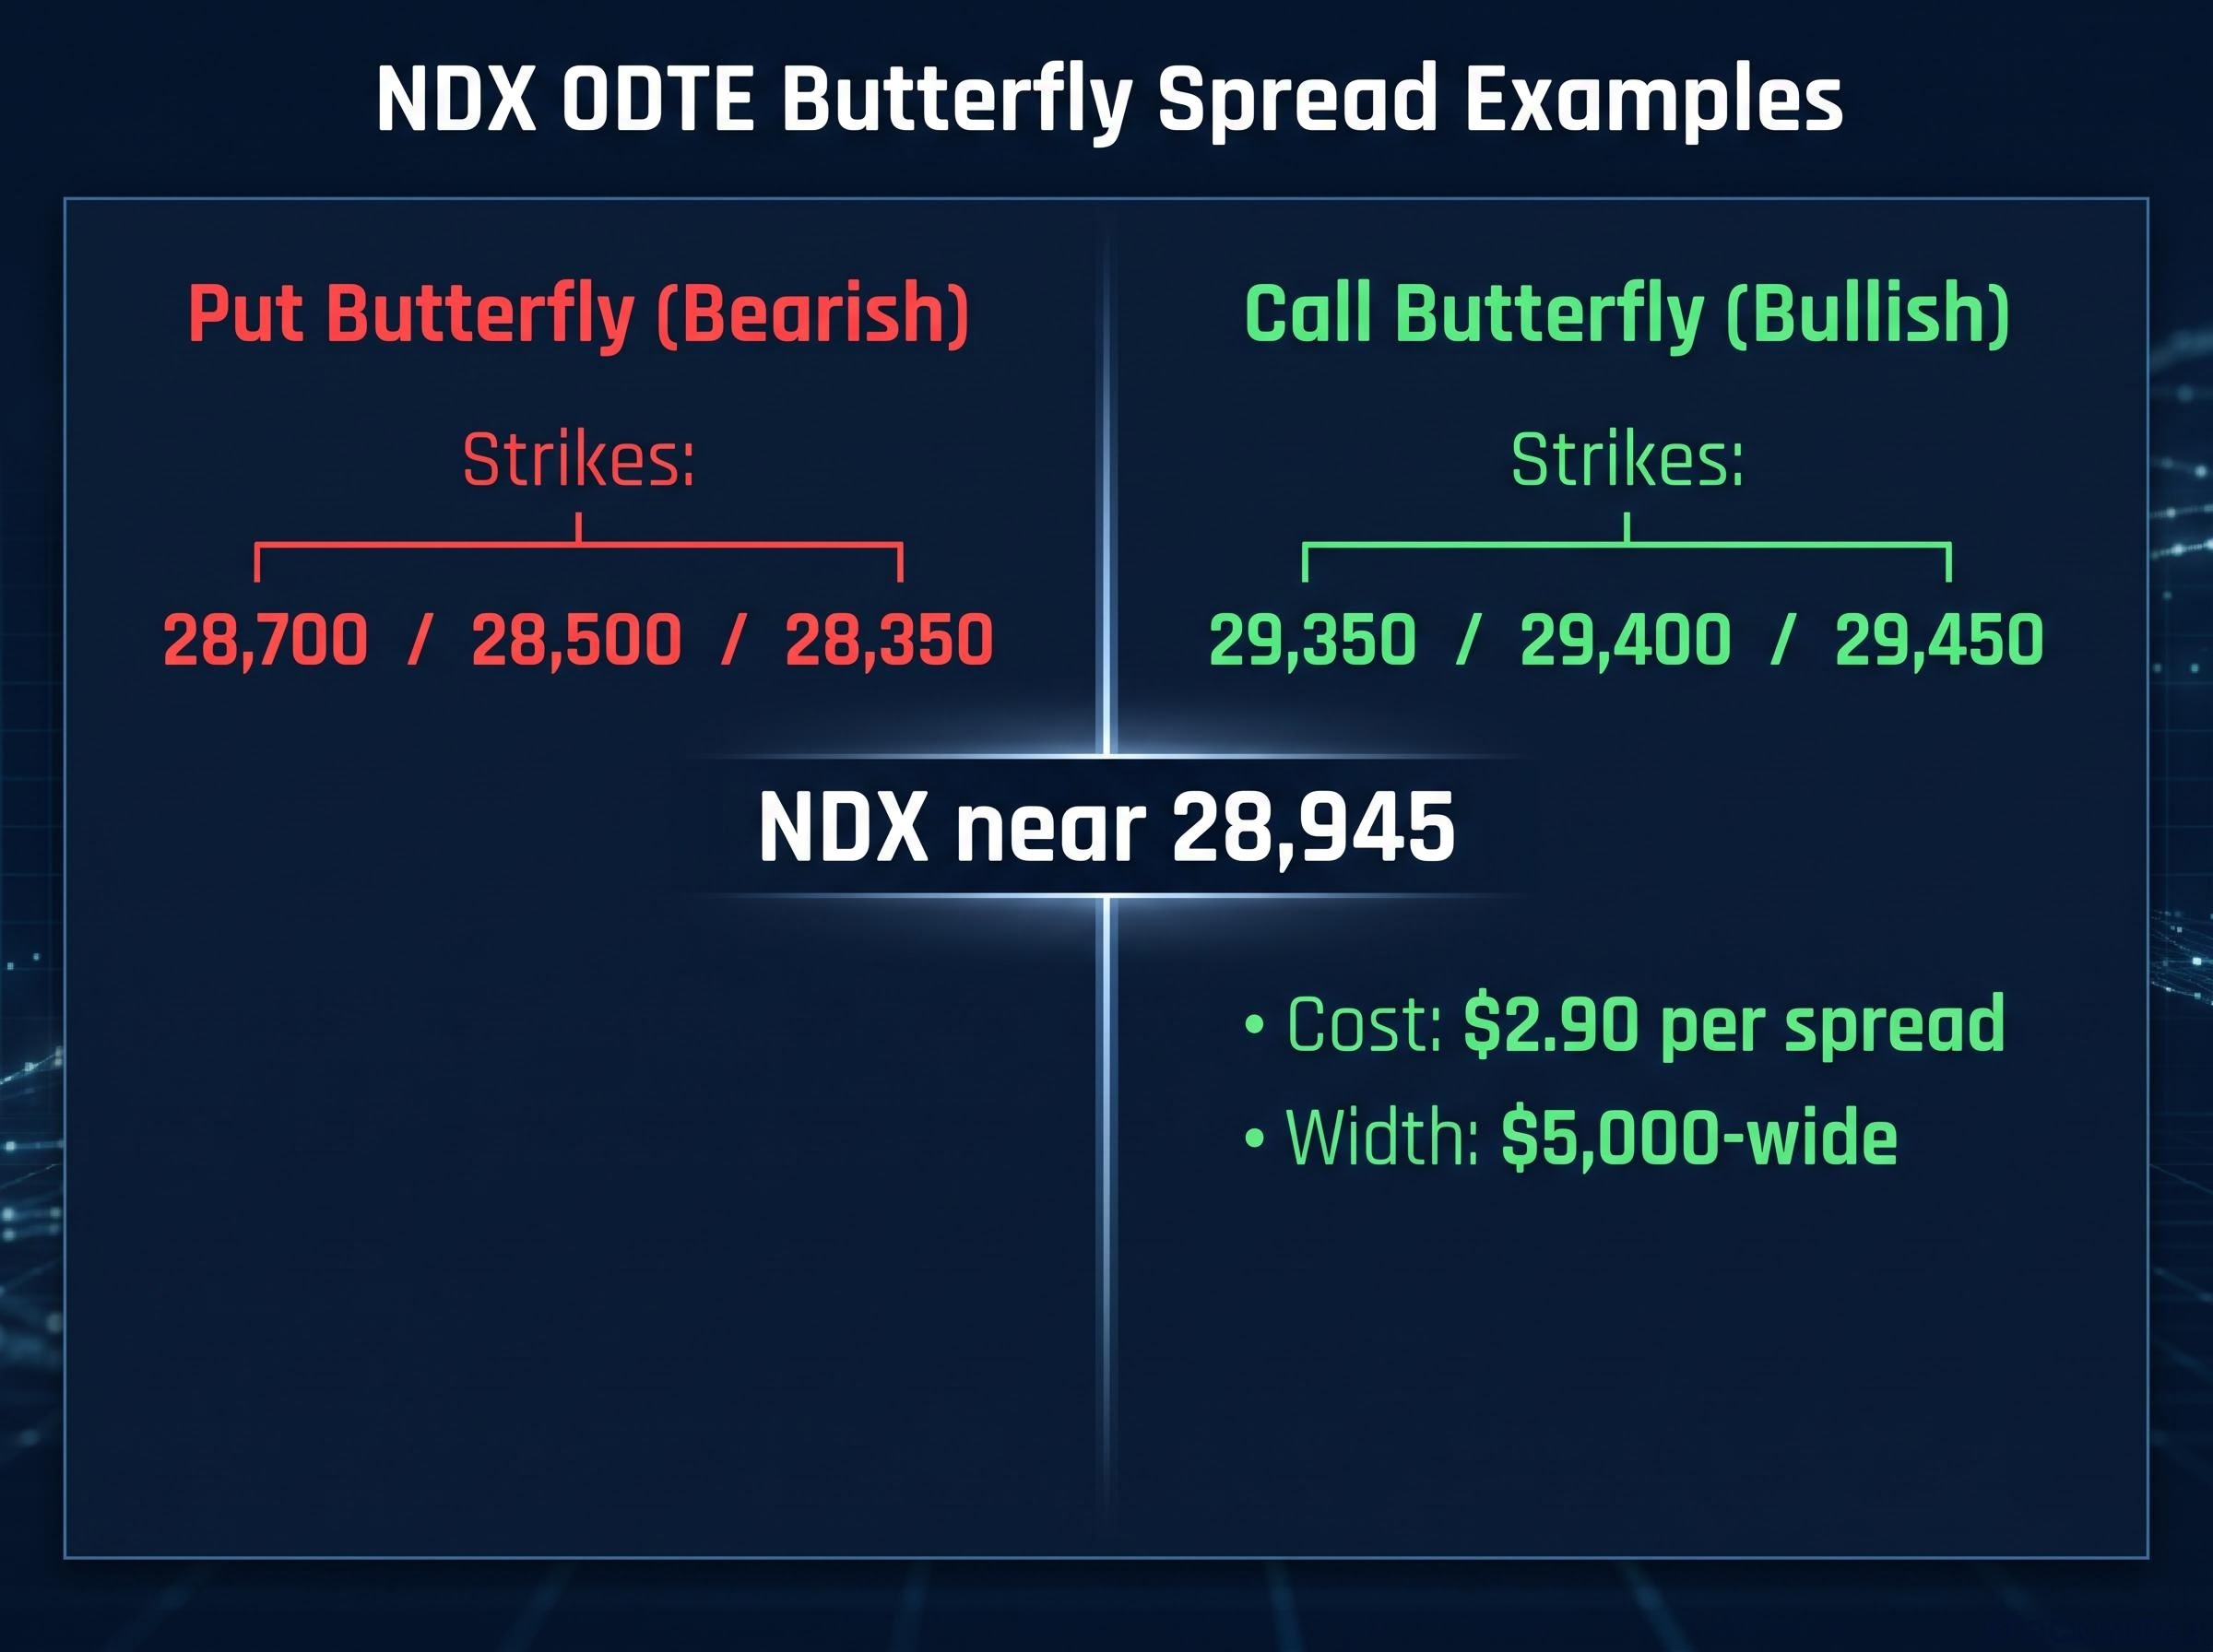
| Structure | Strikes (NDX) | Type | Directional bias | Max profit condition |
|---|---|---|---|---|
| Put butterfly | 28,700 / 28,500 / 28,350 | Puts | Bearish (needs a decline) | Index closes near 28,500 |
| Call butterfly | 29,350 / 29,400 / 29,450 | Calls ($2.90 debit) | Bullish (needs a rally) | Index closes near 29,400 |
That $2.90 cost on a $5,000-wide spread is the tell. It is a low-probability, high-convexity bet, not a primary directional wager. The cost-to-width ratio is how you read any butterfly: a cheap butterfly far from the current price is essentially a lottery ticket on a big move, while an expensive one near the money is a higher-probability play on the market staying put.
Layering butterfly strategies to hedge both directions simultaneously
You have now seen two butterflies pointing in opposite directions. Pair them, and something more interesting emerges. This is where the strategy stops being a single bet and becomes a scenario framework.
The logic is straightforward once you break it down. The 0DTE put butterfly profits from a same-session decline. The next-session upside call butterfly profits from a subsequent rally. Run both, and you have covered a selloff followed by a recovery, a common two-day sequence in choppy markets.
Consider the three ways the next couple of sessions can unfold:
- The market declines as expected. The put butterfly moves toward its profit zone and pays off, while the call butterfly costs only its small debit.
- The market rallies next session. The call butterfly gains, offsetting the put butterfly that expired worthless.
- The market goes nowhere. Both positions expire worthless, and your total loss is capped at the combined debit paid across both.
That third scenario is the reassuring part. Even when the thesis is completely wrong and nothing moves, the damage is limited to what you spent to open both trades.
Running several butterflies at once
Experienced traders rarely stop at two. In the same activity, additional index butterfly orders were working in the market, one targeting the current session and one targeting Friday, both positioned for upside. Running multiple butterflies across different expiration dates lets a trader express a view on where the market lands over several distinct windows rather than a single close.
Here is the insight worth holding onto. Layering two defined-risk butterflies does not double your risk. The combined debit is the total capital at stake across every possible outcome.
That reframes hedging entirely. For most retail investors, hedging means buying protection against one bad outcome, usually a single put. This approach treats hedging as a scenario tree instead. The question shifts from “what if I am wrong?” to “across which sequence of outcomes does at least one of my positions win?”
Call calendar spreads: what they are and how traders layer them onto stock positions after a decline
Butterflies are built for a specific close. Calendar spreads are built for time. And the clearest way to understand them is to see where traders actually deployed them: on long positions in UnitedHealth Group (UNH), JPMorgan Chase (JPM), and Goldman Sachs (GS), each layered on after a meaningful price decline.
The structure is two legs. You buy a longer-dated call and sell a shorter-dated call at the same strike, paying a net debit. Your goal is to collect the rapid time decay on the short-dated call you sold while keeping upside exposure through the longer-dated call you still hold. Your maximum loss up to the front-month expiration is capped at the debit paid.
The timing edge comes from implied volatility, the market’s estimate of how much a stock will move. After a sharp decline, near-term implied volatility often spikes higher than longer-dated implied volatility, a pattern called IV skew.
The front-to-back IV inversion that makes post-decline calendar spreads on single stocks attractive is the same structural differential that makes earnings-period calendars a precision instrument: near-term implied volatility running 1.5x to 3x above the back month creates the premium asymmetry the short leg is designed to harvest.
The core edge When near-term implied volatility is elevated after a selloff, the short-dated call you sell is richly priced relative to the longer-dated call you buy. That skew is the mechanical advantage of the post-decline calendar setup.
Layering a call calendar onto a stock you already own does two useful things after it has fallen. You sell the expensive short-dated call to harvest that inflated premium, and by repeatedly rolling the short leg as it decays, you lower your effective cost basis on the position. The longer-dated call keeps you positioned for an eventual recovery.
| Scenario | What happens | Outcome for the calendar |
|---|---|---|
| Stock stagnates | Front-month call decays fast, back-month holds value | Best case: theta is harvested cleanly |
| Stock rallies too fast | Short call moves into the money, capping gains | Near-term upside is limited |
| Stock continues lower | Both the stock and the long call lose value | Position and holding both suffer |
The uncomfortable truth is the useful one. The best moment to layer a calendar onto a stock is often right after a painful sell-off, exactly when it feels worst to add exposure, because that is precisely when the short leg is most richly priced and the structural edge is highest. For an intermediate investor already holding a losing position, this offers a way to manage the drawdown actively rather than just sitting through it or cutting the position entirely.
Where these strategies fail, and what the research says about retail performance
None of this comes without teeth. These structures fail in specific, predictable ways, and the empirical data on retail performance is sobering.
Butterflies break down for three main reasons:
- Path-dependence. The market must reach the body zone and stay there by expiration. Miss it, and you typically lose the entire debit.
- Gaps beyond the wing. If the index jumps past your long wing, maximum loss is realised fast, with no time to recover.
- Execution cost. Wide bid-ask spreads on four-leg structures create slippage, and adjusting a losing position mid-session can be expensive.
Calendar spreads have their own failure modes:
- Volatility collapse. If implied volatility normalises across the whole curve after a panic, the long-dated call loses value even if the stock price stabilises.
- A rally that is too fast. A sharp move up caps your near-term upside at the short strike.
- Roll execution risk. Poor fills when rolling the short leg can quietly erode the edge you set out to capture.
Volatility collapse risk is the calendar spread failure mode that hits hardest after a panic selloff: if implied volatility normalises quickly across the full term structure, the long-dated call loses value even as the stock price stabilises, erasing the spread’s theoretical edge before the short leg has time to decay.
The performance data adds weight. Academic research finds that retail traders systematically lose money in 0DTE options, and while multi-leg structures generally fare better than naked directional bets, they still demand strict discipline and sizing. Retail accounts make up just 2-4% of total SPX options volume but over 6% of 0DTE volume, and more than 75% of retail trades in S&P 500 index options are 0DTE contracts. Encouragingly, Cboe found that over 95% of 0DTE trades use limited-risk formats, suggesting structured spreads dominate over reckless naked positions.
The convexity that draws people in cuts both ways. A Cboe case study of a 0.94% intraday SPX decline showed an at-the-money 0DTE put gaining 404% and an out-of-the-money put gaining 617%. Hold both readings at once: those numbers show the upside that makes these instruments magnetic, and they reveal exactly why the same mechanics destroy capital when the move never arrives.
A regulatory signal, not a footnote FINRA Regulatory Notice 22-08 (March 2022) remains the most significant recent statement on complex options supervision, stressing suitability and risk comprehension. That these strategies carry real supervisory scrutiny tells you the failure modes above are taken seriously by professionals, not just by cautious commentators.
This article is for informational purposes only and should not be considered financial advice. Investors should conduct their own research and consult with financial professionals before making investment decisions. Past performance does not guarantee future results.
Building with defined risk, not hoping for unlimited upside
One thread runs through everything covered here. Butterfly spreads and calendar spreads are not lottery tickets. They are precision instruments built around a defined maximum loss, a specific market scenario, and a clear time horizon.
Look back at the NDX butterflies and the single-stock calendars on UNH, JPM, and GS. In every case, the trader knew exactly how much capital was at risk before a single tick moved. That is the discipline these structures enforce, and it is what separates them from open-ended speculation.
The point is not to predict the market perfectly. It is to define your loss before you enter, then let the structure do the work across a scenario you have thought through in advance.
The practical next step is simple. Before you trade any multi-leg structure, paper-trade the payoff diagram and watch how the position gains and loses value as price and implied volatility move. Theoretical understanding and live profit-and-loss feel very different when gamma is extreme, and the safest place to learn that difference is with no money on the line.