Why AI Is Splitting Semiconductor Stocks From the Rest of Tech
3 hrs ago

In April 2026, Commonwealth Bank of Australia shares rose 3.6% and outperformed the ASX 200 by more than a full percentage point. The bank made no announcements. It released no results. It disclosed nothing material to the market. That quiet outperformance, set against a month in which NAB fell 3.8% after flagging a $706 million credit impairment charge and Westpac dropped 2.5% following a profit warning tied to its RAMS portfolio sale, captures a tension that has become one of the defining questions in Australian equities: why does CBA keep trading at a price that brokers, including UBS with a Sell rating and a $130 target, say implies roughly 25% downside?
The gap between what analysts say CBA is worth and what investors keep paying for it is not new. But it is widening. What follows unpacks the structural, behavioural, and fundamental forces sustaining CBA’s premium, presents the specific risks the bear case raises for retail investors, and explains what the tension between price-to-value discipline and market sentiment means in practice.
The simplest way to see CBA’s valuation paradox is to look at what happened to Australian bank stocks in April 2026, and then notice what didn’t happen to CBA.
NAB released an operational update on 20 April that disclosed a $706 million credit impairment charge, driven in part by geopolitical uncertainty linked to the Middle East conflict. Its shares fell 3.8% for the month, closing at $39.88. Westpac published a trading update on 14 April that flagged a $75 million reduction in net profit after tax from costs associated with the sale of its RAMS portfolio. It finished the month down 2.5%, closing at $38.50. ANZ, which made no announcements, rose 1.9% to close at $36.65.
CBA made no price-sensitive disclosures during the entire month. It rose 3.6% to close at $173.66 on 30 April 2026, comfortably ahead of the ASX 200’s 2.2% gain.
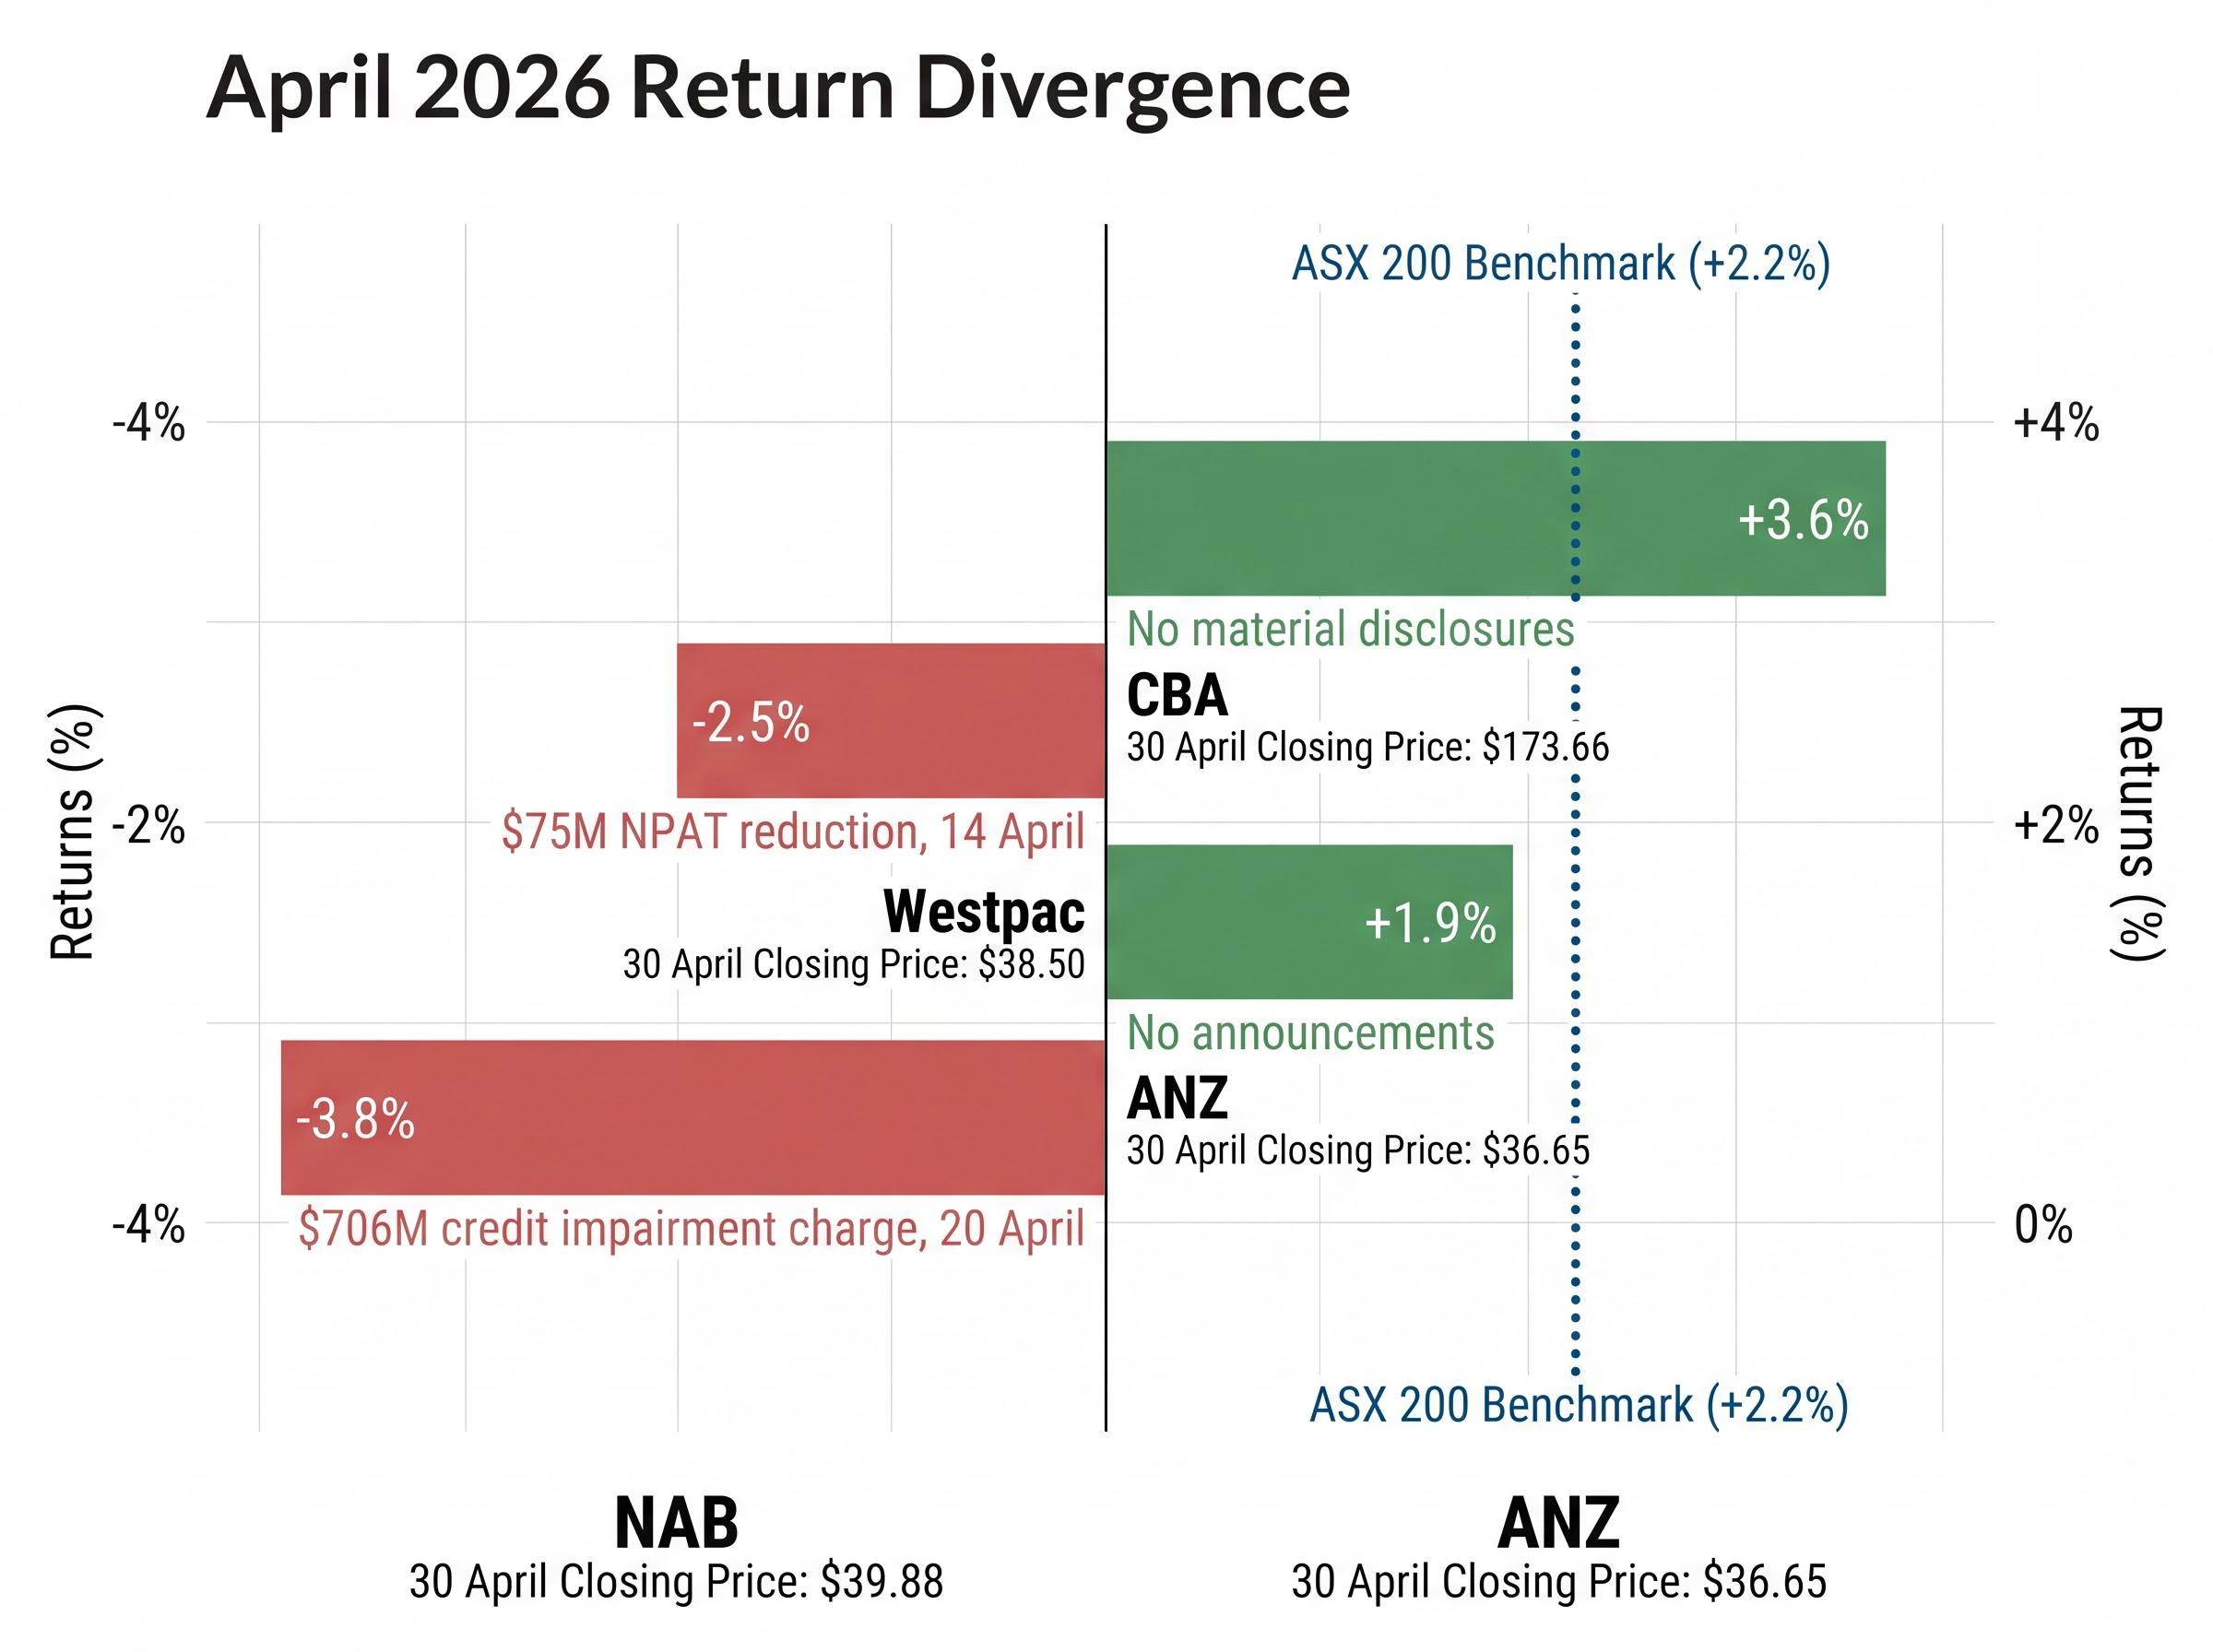
CBA delivered no announcements, no results, and no material disclosures during April 2026. Its shares rose 3.6%, outperforming the ASX 200 and every peer except silence itself.
| Bank | April 2026 return | Closing price (30 April) | Key event |
|---|---|---|---|
| CBA | +3.6% | $173.66 | No material disclosures |
| NAB | -3.8% | $39.88 | $706M credit impairment charge (20 April) |
| Westpac | -2.5% | $38.50 | $75M NPAT reduction, RAMS sale costs (14 April) |
| ANZ | +1.9% | $36.65 | No announcements |
This is not a one-month curiosity. It is the most recent data point in a pattern where CBA’s share price appears partially decoupled from the news cycle that moves other bank stocks.
ASX bank sector performance in 2026 has been heavily concentrated, with gains skewed toward CBA while the spread between the best and worst performing major bank reached more than 10 percentage points in a single month, a divergence that raises questions about whether sector-level allocation or stock-specific selection is the more consequential decision for investors with Big Four exposure.
To assess whether CBA is expensive, the starting point is a metric called the price-to-earnings ratio, or P/E ratio. This measures how much investors are paying for each dollar of a company’s annual profit. A P/E of 20x means the market values the company at 20 times its most recent yearly earnings. The higher the ratio, the more investors are paying per dollar of profit, and the more future earnings growth they need to see to justify the price.
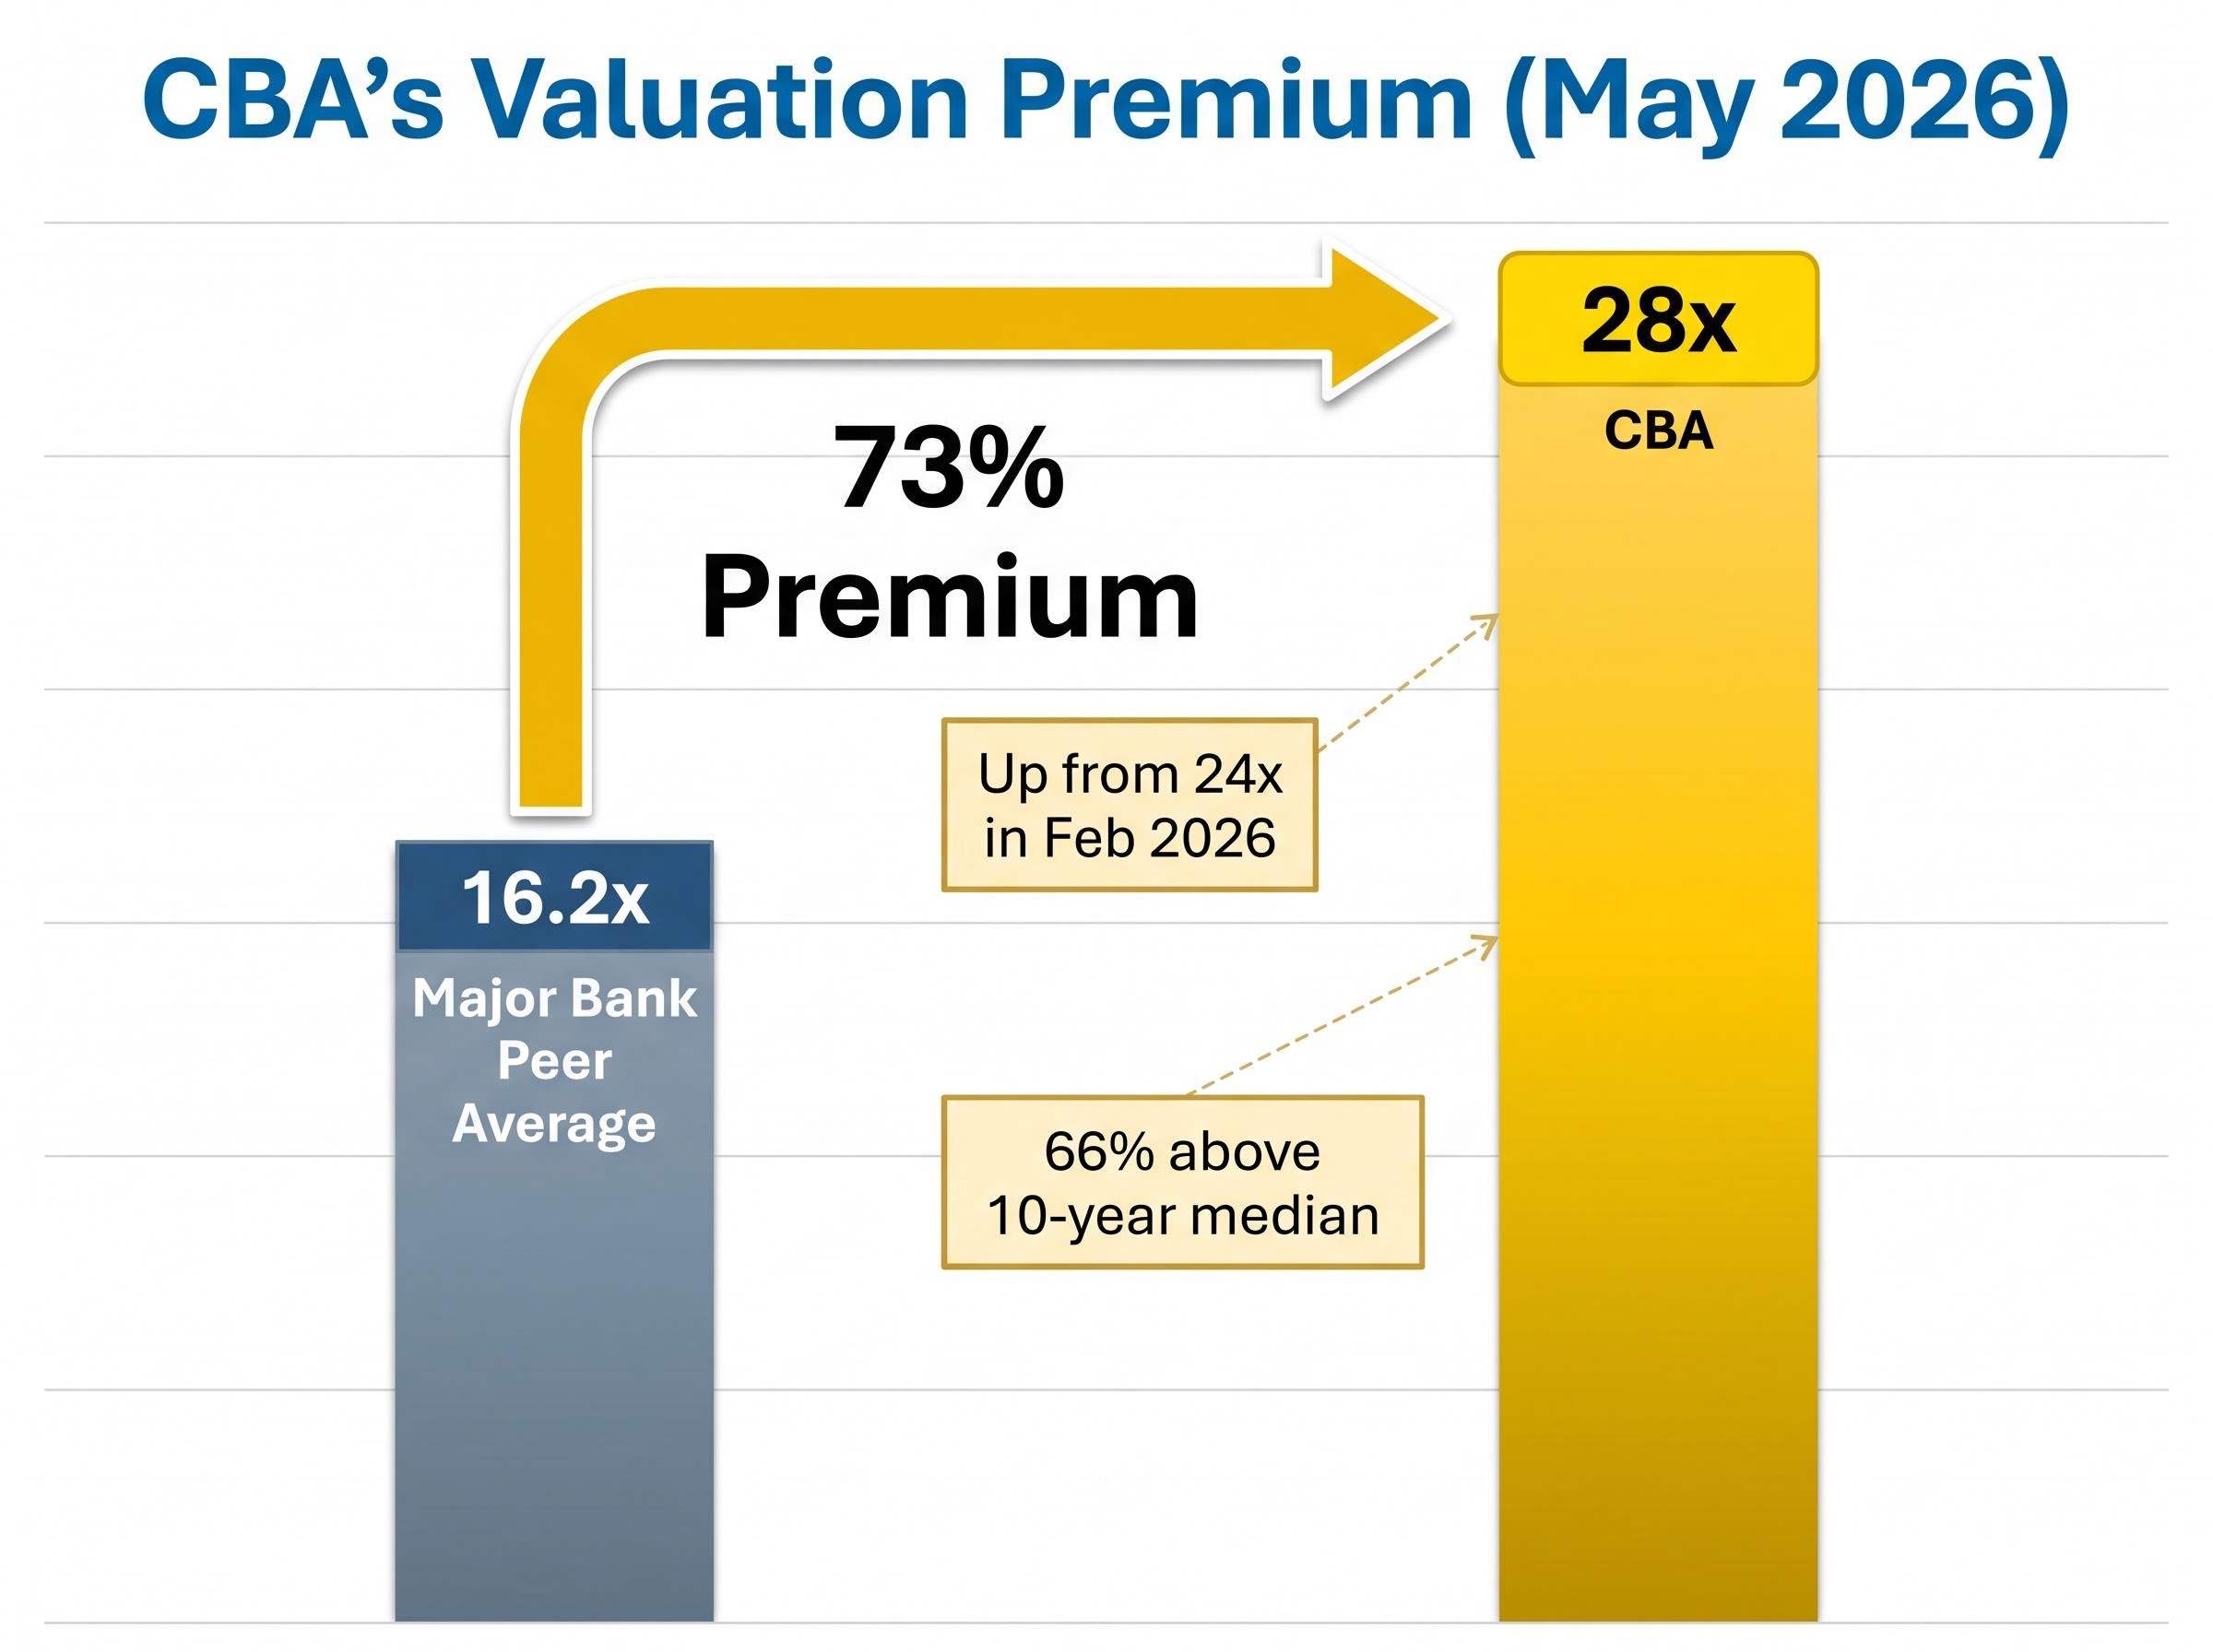
CBA’s trailing twelve-month P/E ratio stood at approximately 28x as of early May 2026. That figure is roughly 66% above its 10-year median and has risen from approximately 24x in February 2026, when the bank reported its half-year results. The premium has widened even as the share price sits below its all-time high of approximately $192, reached in June 2025.
Fund manager Roger Montgomery has described CBA as “priced for perfection,” noting that the stock leaves no margin for operational disappointment at these multiples.
The Australian major bank peer group trades at an average P/E of approximately 16.2x. CBA’s 28x multiple represents a premium of roughly 73% above that average. UBS formalised this gap in February 2026 with a Sell rating and a $130 price target, implying approximately 25% downside from April levels near $174.
The question this data raises is direct: what rate of earnings growth would need to materialise to justify paying 28 times earnings for a bank whose peers trade at 16 times? The answer shapes every argument that follows.
The bull case for CBA at current prices is not irrational. It rests on a coherent logic that combines operational quality, defensive appeal, and structural market forces.
CBA’s H1 FY2026 results (for the half-year ending 31 December 2025) demonstrated consistent execution:
APRA’s capital requirements for domestic systemically important banks set minimum Total Capital thresholds that constrain how the major banks deploy retained earnings, and CBA’s CET1 ratio of 12.3% sits comfortably above those floors, reinforcing the conservative balance sheet position that underpins its defensive appeal to income-focused investors.
These are not the numbers of a bank in difficulty. Earnings are growing, the dividend is rising, and the balance sheet is conservative.
Beyond the fundamentals, CBA benefits from its position as Australia’s largest bank by market capitalisation. Its weighting in the ASX 200 means passive exchange-traded funds (ETFs) and index funds are mechanically compelled to buy CBA with every inflow, creating a baseline of price support. In April 2026, when geopolitical uncertainty weighed on banking sentiment and peers absorbed negative disclosures, CBA attracted relative inflows precisely because it is perceived as the most reliable of the four major banks.
The question is not whether CBA’s operational quality is real. It is whether the degree of premium being applied to that quality is proportionate to the earnings growth that underpins it.
UBS maintains a Sell rating on CBA with a $130 price target (as of February 2026), implying approximately 25% downside, or roughly $44 per share, from the April 2026 trading price near $174.
That is the bear case expressed in dollar terms. For a retail investor holding 500 shares, a reversion to the UBS target would represent a paper loss of approximately $22,000 before any dividend offset.
The bear argument does not require a crisis. Roger Montgomery has pointed out that core profit growth of approximately 5% and revenue growth of approximately 4.5% do not support a 28x multiple. The stock is priced for sustained earnings acceleration that has not yet appeared in the numbers.
Rising credit provisions across the Big Four are one of the structural headwinds that make the bear case for CBA more than a valuation argument in isolation, with total sector provisions forecast to roughly double from approximately $2.4 billion in FY25 to $5.5 billion by FY27 as housing price softness and Stage 3 loan stress accumulate.
At 28x trailing earnings, CBA has no margin for operational disappointment. A modest earnings miss, a dividend growth pause, or a shift in sentiment could trigger a rapid contraction in the multiple the market is willing to assign. The formal term for this is “de-rating,” but the arithmetic is straightforward.
A P/E ratio compresses when the price falls but earnings remain stable, or when the market simply decides to pay less per dollar of profit. If CBA’s earnings stay flat and the market re-rates the stock from 28x to the peer group average of approximately 16x, the share price would decline substantially, even without any deterioration in the underlying business.
This is the risk that sits beneath the bear case. It does not require a blow-up. It requires only that the market stops applying an exceptional premium to an otherwise well-run bank.
These statements are speculative and subject to change based on market developments and company performance.
CBA’s premium has persisted for long enough that valuation alone is an insufficient explanation for why it has not corrected. Three structural forces operate outside the traditional earnings-justified framework:
April 2026 demonstrated all three forces in real time. When the news cycle was negative for the banking sector, with NAB disclosing a major impairment charge and Westpac flagging a profit reduction, CBA’s structural support held. No announcement was required. The price rose anyway.
This does not mean the premium is permanent. It does mean that investors evaluating CBA need to distinguish between a stock that is expensive because the market has mispriced it and a stock that is expensive partly because of how the Australian market is constructed.
The core decision for investors considering CBA at current prices is whether the structural premium for quality and defensive characteristics is proportionate to their own investment horizon and risk tolerance.
Two scenarios frame the forward view:
For long-term SMSF and superannuation investors focused on franked dividend income, the premium may be more defensible than for growth-oriented investors seeking capital appreciation relative to the entry price. Neither position is wrong. The question is which investor each reader is.
CBA’s dividend sustainability is a materially different question from CBA’s valuation, and for income-focused investors the two need to be held separately: a stock can be stretched on a price-to-earnings basis while still offering a defensible income stream, particularly when franking credits lift the effective gross yield for SMSF holders in pension phase.
This article is for informational purposes only and should not be considered financial advice. Investors should conduct their own research and consult with financial professionals before making investment decisions.
CBA’s valuation premium is simultaneously rational, supported by structural market forces, defensive appeal, and consistent operational execution, and arithmetically difficult to justify at 28x earnings against a peer group trading at 16x.
April 2026 was the most recent reminder that market forces consistently override analyst caution on this stock. No announcements were needed. No catalysts emerged. The premium simply held and expanded while peers absorbed bad news.
The forward implication is that this premium is likely to persist until either earnings growth accelerates enough to close the valuation gap or a catalyst emerges that makes the gap visible enough to trigger a re-rating. Based on the current trajectory, neither appears imminent. For Australian retail investors, the CBA share price remains less a question of value and more a question of which forces they believe will prove more durable: the arithmetic, or the structure of the market itself.
Related coverage of ASX 200 bank sector performance and CBA’s half-year results analysis is available for further reading.
CBA trades at a significant premium to peers partly because of its dominant index weighting in the ASX 200, which forces passive ETFs and index funds to buy CBA with every inflow, and partly due to its reputation as the highest-quality and most defensive of the Big Four banks.
A price-to-earnings (P/E) ratio measures how much investors pay for each dollar of a company's annual profit. CBA's P/E of approximately 28x, compared to a peer group average of 16.2x, means investors are paying a substantial premium relative to earnings, which requires sustained earnings growth to justify.
UBS holds a Sell rating on CBA with a price target of $130, set in February 2026, implying approximately 25% downside from the April 2026 trading price of around $174 per share.
If CBA's P/E ratio compressed from 28x to the peer group average of approximately 16x with earnings remaining stable, the share price would fall substantially even without any deterioration in the underlying business, a risk analysts call multiple compression.
For income-focused SMSF investors, CBA's fully franked interim dividend of $2.35 per share offers a defensible income stream, and franking credits can lift the effective gross yield significantly for those in pension phase, even if the stock appears stretched on a price-to-earnings basis.