KOSPI Drops 10% as Crowded AI Trade Unwinds Across Global Markets
5 hrs ago

In 1938, a Harvard doctoral student named John Burr Williams made a claim that Wall Street found uncomfortable: a stock is worth nothing more than the sum of its future dividends, discounted back to the present. The argument arrived less than a decade after the 1929 crash, when speculation had destroyed more wealth than most investors could quantify. Nearly nine decades later, the dividend discount model remains one of the most intellectually coherent tools available to income-focused investors, and one of the most underused.
For Australian investors allocating capital to mature, dividend-paying ASX sectors (banks, infrastructure, consumer staples), the case for dividend-based valuation is stronger than the standard textbook criticisms suggest. This guide provides a working understanding of how to apply a simplified dividend discount model using analyst forecasts and historical dividend data, why the model’s most cited limitations are overstated for income investors, and how dividends deliver tangible value across the entire holding period, not only at exit.
John Burr Williams developed his theory of intrinsic value as a direct response to the speculative excess that preceded the Great Depression. His doctoral research at Harvard, published as The Theory of Investment Value, argued that stocks derive their worth from what they consistently yield to the holder, not from what a future buyer might be willing to pay. Williams compared stocks to productive assets: a dairy cow is valued by its milk, an orchard by its fruit. The same logic, he insisted, applies to equities.
Williams drew a deliberate line between investors, who are motivated by dividend income, and speculators, who pursue price gains. The distinction was not rhetorical. It was the foundation of his entire valuation framework.
Benjamin Graham reviewed Williams’ work approvingly, praising the dividend emphasis as a necessary corrective to Wall Street’s preoccupation with price momentum. Williams predated Graham’s The Intelligent Investor by roughly 11 years, making the dividend-centred framework one of the earliest formal arguments for what would later become value investing.
Understanding this lineage matters. Choosing to apply DDM is not a simplification; it is a philosophical stance about what investing actually is. The framework was built to separate productive ownership from speculative trading, and that distinction remains as relevant in 2026 as it was in 1938.
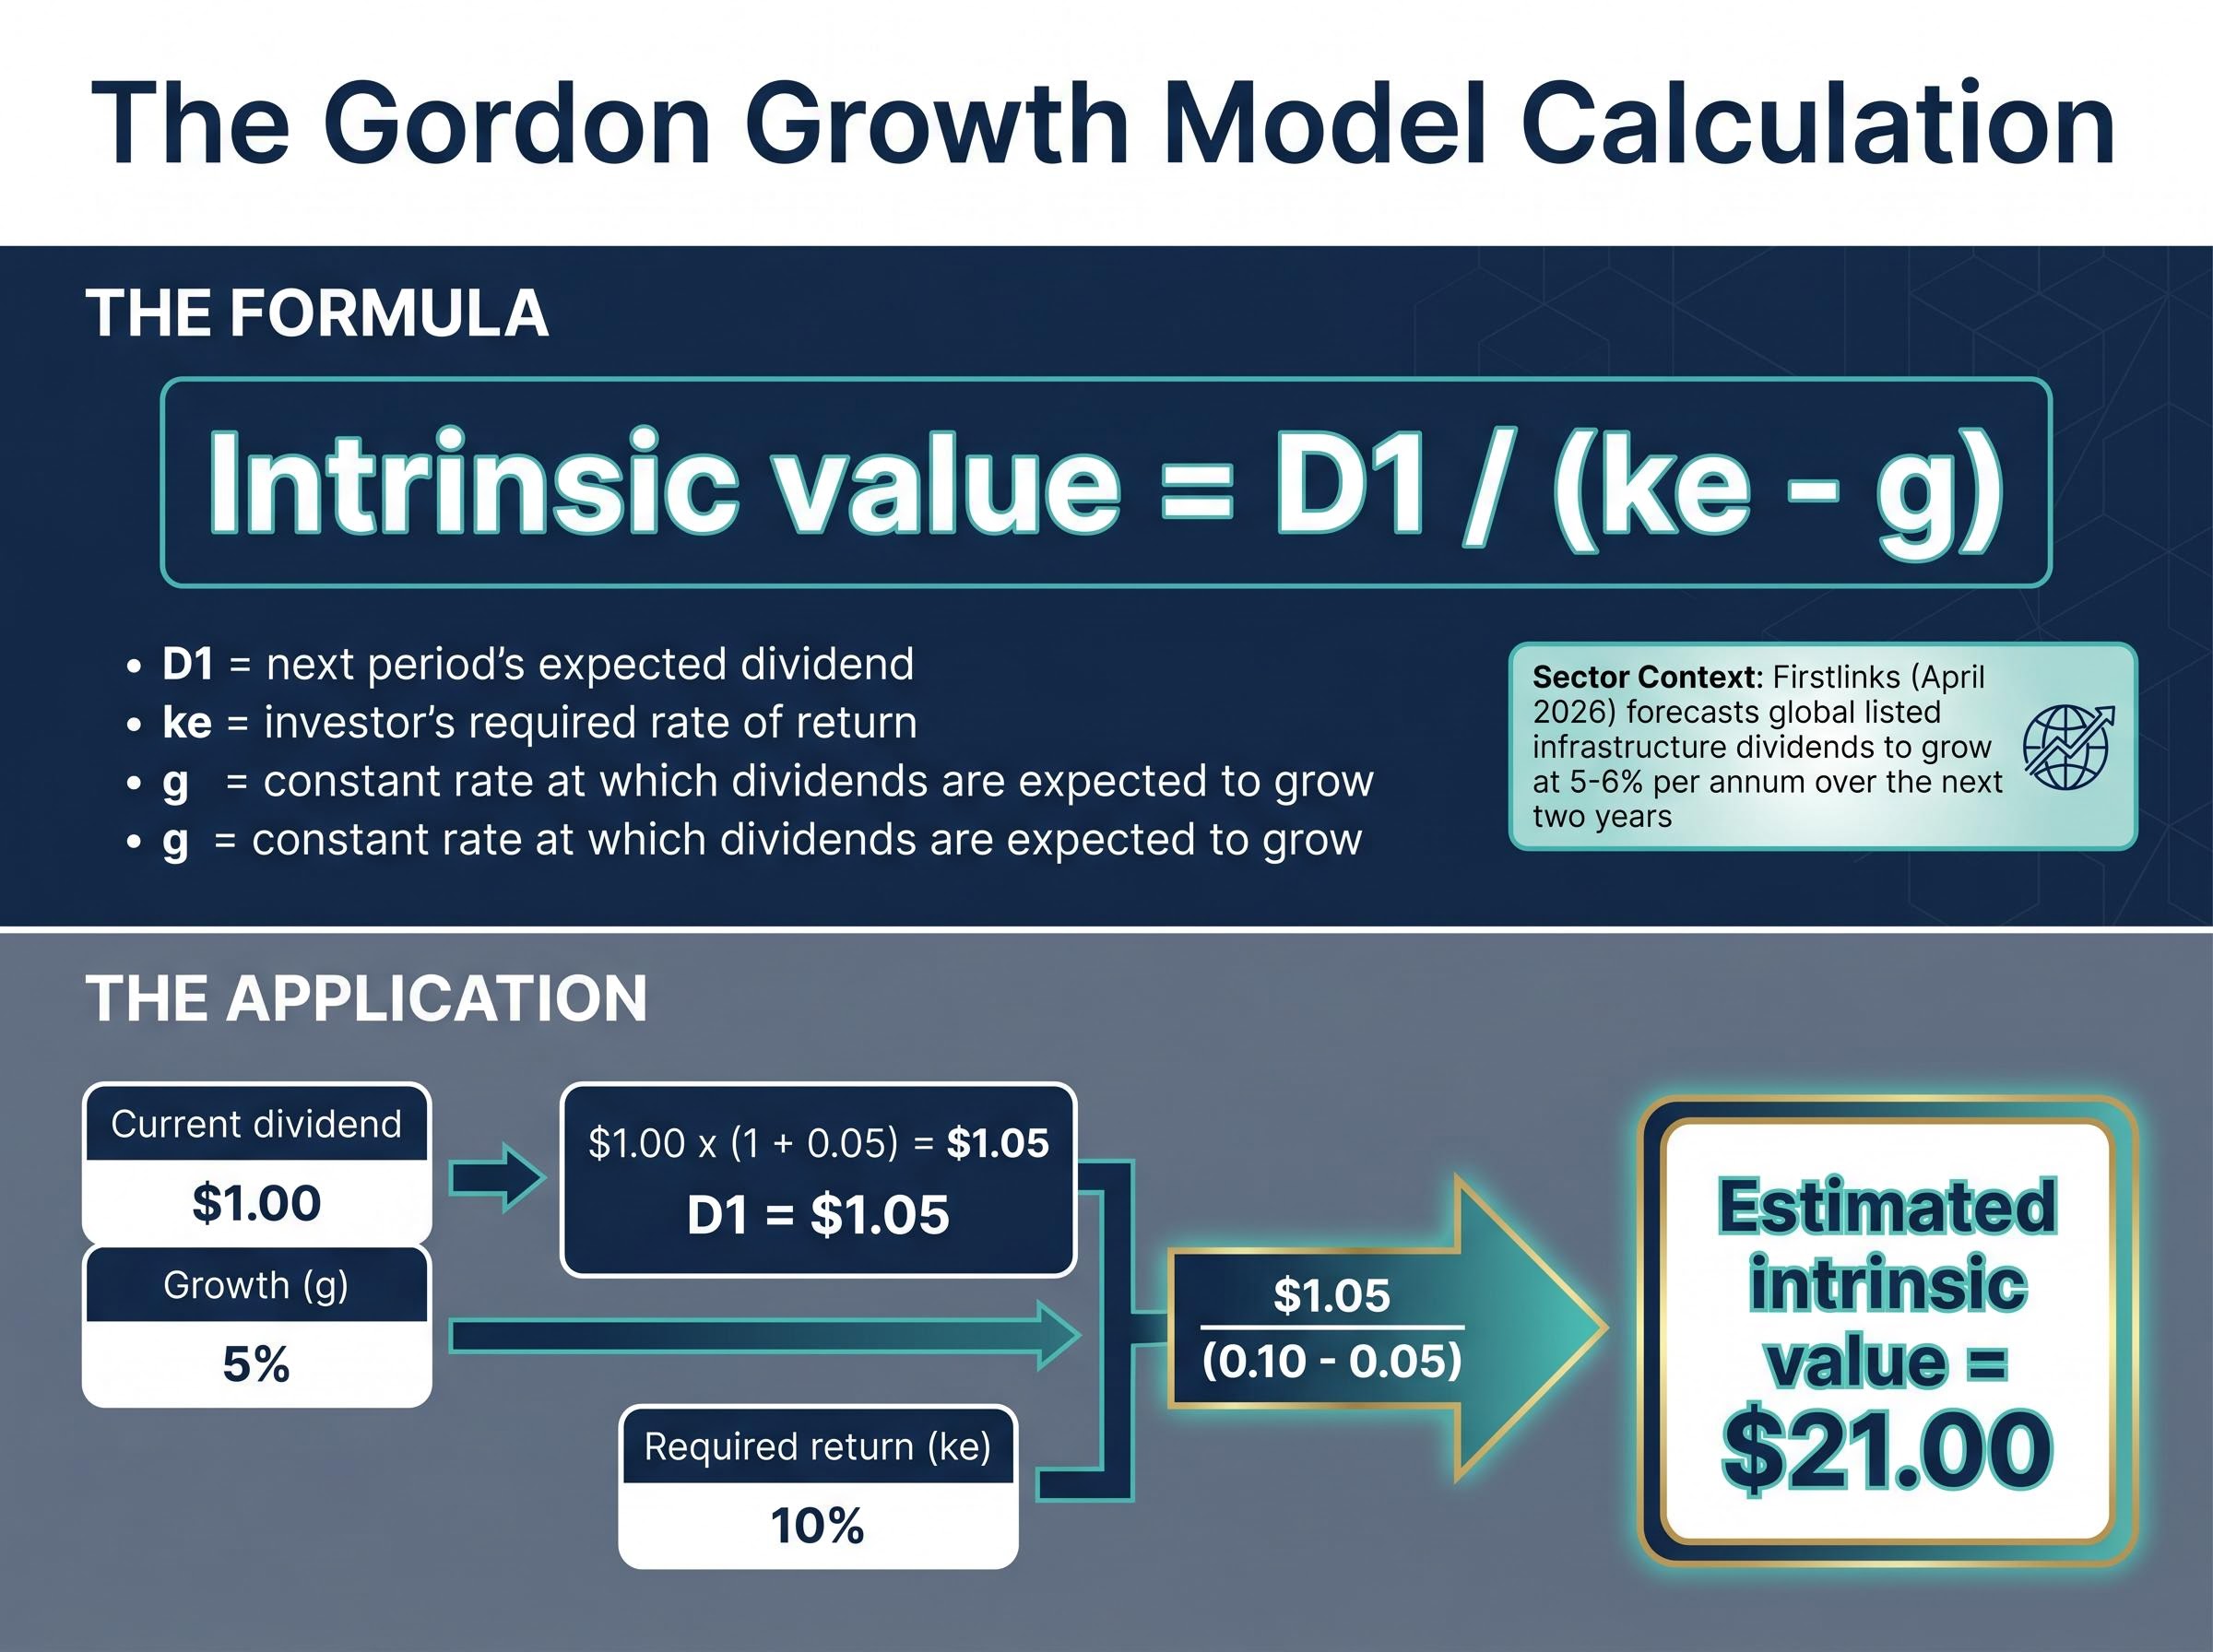
The Gordon Growth Model compresses a powerful idea into three inputs. Intrinsic value equals D1 divided by the difference between ke and g. D1 is next period’s expected dividend. ke is the investor’s required rate of return. g is the constant rate at which dividends are expected to grow.
The constraint that makes the formula work is straightforward: g must remain below ke. If a company’s dividends grew faster than the investor’s required return in perpetuity, the model would produce a nonsensical result, because no stable business can compound dividends faster than equity holders demand indefinitely.
According to Firstlinks (April 2026), global listed infrastructure dividends are forecast to grow at 5-6% per annum over the next two years, providing a concrete reference point for the g input when valuing ASX-listed infrastructure names.
That forecast illustrates how a sector-level growth rate can anchor the model’s most sensitive input. If an infrastructure company pays a current annual dividend of $1.00 per share and dividends are expected to grow at 5%, D1 becomes $1.05. Paired with a required return of 10%, the Gordon Growth Model estimates intrinsic value at $21.00.
The Gordon Growth version is the simplest, but two extensions exist for companies with more complex dividend trajectories.
| Model variation | Growth assumption | ASX company type |
|---|---|---|
| Gordon Growth (single-stage) | Constant perpetual growth | Mature banks, consumer staples |
| Two-stage DDM | Initial high growth, then stable | Companies transitioning to maturity |
| Multi-stage DDM | Multiple distinct growth phases | Complex dividend trajectories |
The formula itself is simple. What matters is the ability to interrogate each input, and that skill is the foundation for the practical application method covered next.
Most return calculations focus on exit: what price the investor receives when they sell. For income investors, this framing misses the point. The period between purchase and sale is not transitional. It is where much of the financial value is realised.
Dividends perform three specific functions during the holding period:
For Australian investors, the after-tax value of each dividend payment is also shaped by the ATO franking credit rules, which govern how corporate tax already paid on profits can be passed through to shareholders as a tax offset — a factor that materially affects the effective yield calculation underlying any DDM application on ASX stocks.
These are not abstract benefits. They reduce the investor’s dependence on market conditions at any single point in time. A holding that pays growing dividends is returning capital to its owner throughout the investment, not deferring all return to an uncertain exit.
The income investor’s long-term objective is typically a passive income stream that grows at a rate exceeding inflation. DDM is the valuation tool that helps ensure the entry price supports that outcome from the first dividend payment onward.
This is also why DDM’s restriction to dividend-paying companies is not a limitation for income investors. The model values precisely what the investor is buying: a stream of future cash payments. Entry discipline, ensuring the purchase price is justified by that stream, is what separates a productive holding from an overpaid one.
Three criticisms are regularly levelled at the dividend discount model. Each deserves scrutiny, but two of them apply to every discounted cash flow method, and the third actually strengthens DDM’s case for income investors.
The model’s reliability improves further when applied to established, non-cyclical companies with stable payout policies: ASX-listed banks, infrastructure operators, and consumer staples businesses. These are the sectors where dividend trajectories are most predictable and where analyst forecast coverage is deepest.
Dividend sustainability is the foundational input quality test that sits beneath every DDM calculation: a company paying out more cash than it earns in net investment income will not maintain the dividend trajectory that g assumes, and the model will return a value that is not grounded in reality.
The simplified approach described here bypasses detailed bottom-up financial modelling. Instead, it relies on two primary inputs: analyst consensus dividend forecasts and the company’s historical dividend growth record. The analytical work that drives accuracy sits underneath these inputs, in understanding the company’s business, its competitive position, and its industry trajectory, since these determine whether projected dividends are credible.
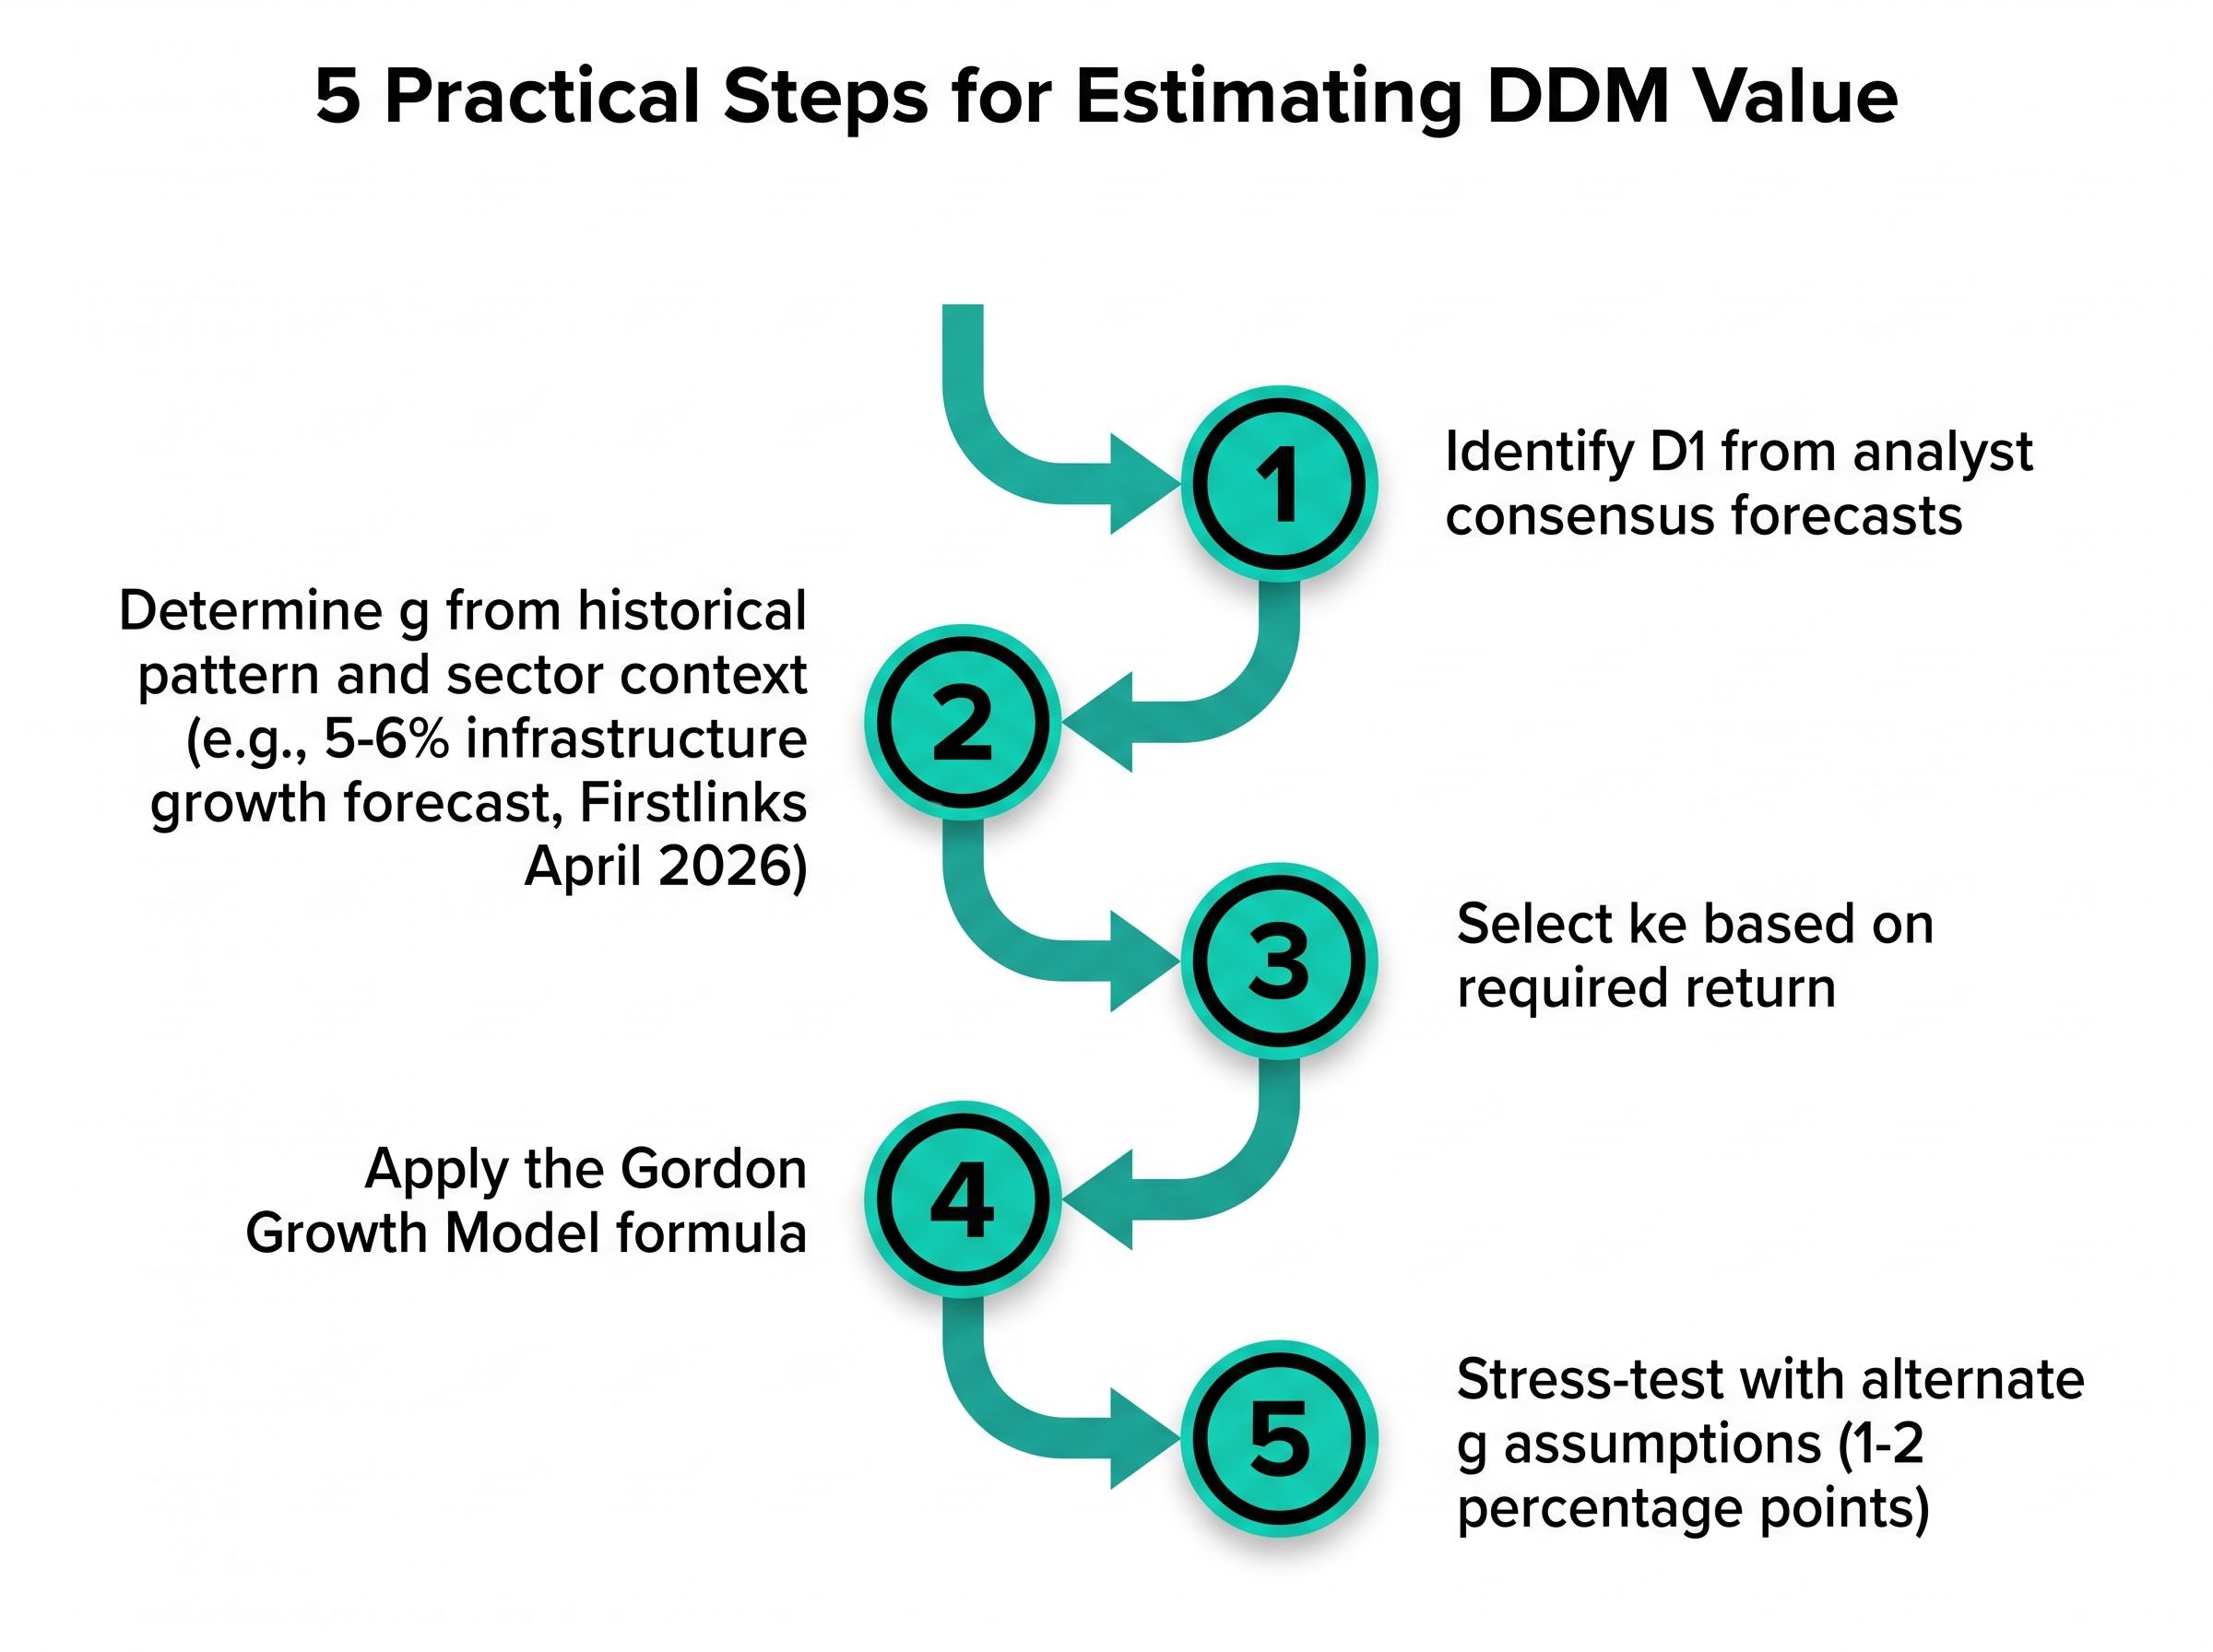
The process follows five steps:
The Westpac dividend forecast from FY25 through FY28 illustrates precisely how the D1 and g inputs are constructed in practice: a confirmed base-year payout of $1.53 per share, a projected trajectory to $1.70 over three years, and a set of identifiable risks that an income investor must weigh before treating that trajectory as the g input in a Gordon Growth calculation.
Using projected future dividends as the sole cash flow proxy is more conservative than a full DCF approach. All other cash flows, retained earnings, capital allocation decisions, potential special distributions, are treated as deferred inputs that ultimately flow through to future dividends. This is consistent with Graham’s framing: what the company does not pay today, it retains to grow what it pays tomorrow.
The required rate of return (ke) is the investor’s personal threshold: the minimum annual return that justifies holding the stock rather than an alternative investment. It reflects the risk-free rate environment, the company’s perceived risk, and the investor’s own income objectives.
Australian investors should consider the prevailing interest rate environment as a floor reference. If term deposits or government bonds offer a certain yield with minimal risk, ke for an equity investment should sit meaningfully above that level to compensate for the additional uncertainty. The exact figure is a judgment call, but it should be defensible relative to the alternatives available.
The dividend discount model’s value lies in the quality of judgment applied to its inputs, not the precision of its arithmetic. The simplified approach described in this guide, analyst forecasts plus historical data plus an understanding of the underlying business, is consistent with how experienced practitioners actually use it.
For Australian income investors focused on mature ASX sectors, the model’s assumptions are at their most defensible. Banks, infrastructure operators, and consumer staples companies tend to maintain stable payout policies, attract reliable analyst coverage of dividend trajectories, and operate business models with predictable cash generation. These are the conditions under which DDM performs best.
The big four bank shares illustrate both the appeal and the complexity of applying DDM to ASX financials: each bank offers a different combination of raw yield, franking level, and projected dividend growth, and those differences produce meaningfully divergent intrinsic value estimates when run through the Gordon Growth formula at the same ke.
The practical next step is straightforward: identify one ASX company from a mature, dividend-paying sector, gather its historical dividend data and available analyst forecasts, and run the Gordon Growth Model as a first valuation estimate. Refine the inputs. Stress-test the growth rate. The model improves not through formula complexity but through deeper understanding of the business it is valuing.
This article is for informational purposes only and should not be considered financial advice. Investors should conduct their own research and consult with financial professionals before making investment decisions. Past performance does not guarantee future results. Financial projections are subject to market conditions and various risk factors.
The dividend discount model (DDM) estimates a stock's intrinsic value as the sum of all its future dividend payments discounted back to the present. The most common version, the Gordon Growth Model, uses three inputs: the next expected dividend, the investor's required rate of return, and the assumed constant dividend growth rate.
The DDM cannot value non-dividend-paying companies, relies on forecast accuracy, and is sensitive to the discount rate selected. However, these limitations apply equally to all discounted cash flow methods, and for income investors who specifically target dividend-paying stocks, the model's constraints align with their own selection criteria.
Divide next year's expected dividend (D1) by the difference between your required rate of return (ke) and the assumed constant dividend growth rate (g). For example, a stock with a $1.05 projected dividend, a 10% required return, and 5% expected growth would have an estimated intrinsic value of $21.00.
Mature, non-cyclical ASX sectors such as major banks, listed infrastructure operators, and consumer staples businesses are best suited to DDM valuation because they tend to maintain stable payout policies, generate predictable cash flows, and attract strong analyst dividend forecast coverage.
Australian franking credits allow companies to pass through corporate tax already paid on profits as a tax offset to shareholders, which materially increases the effective after-tax yield on each dividend. This means the true yield input underpinning any DDM calculation on ASX stocks should account for the franking credit benefit, not just the raw cash dividend.