Why the US-Iran Deal Won’t Cut Oil Prices Overnight
1 hr ago

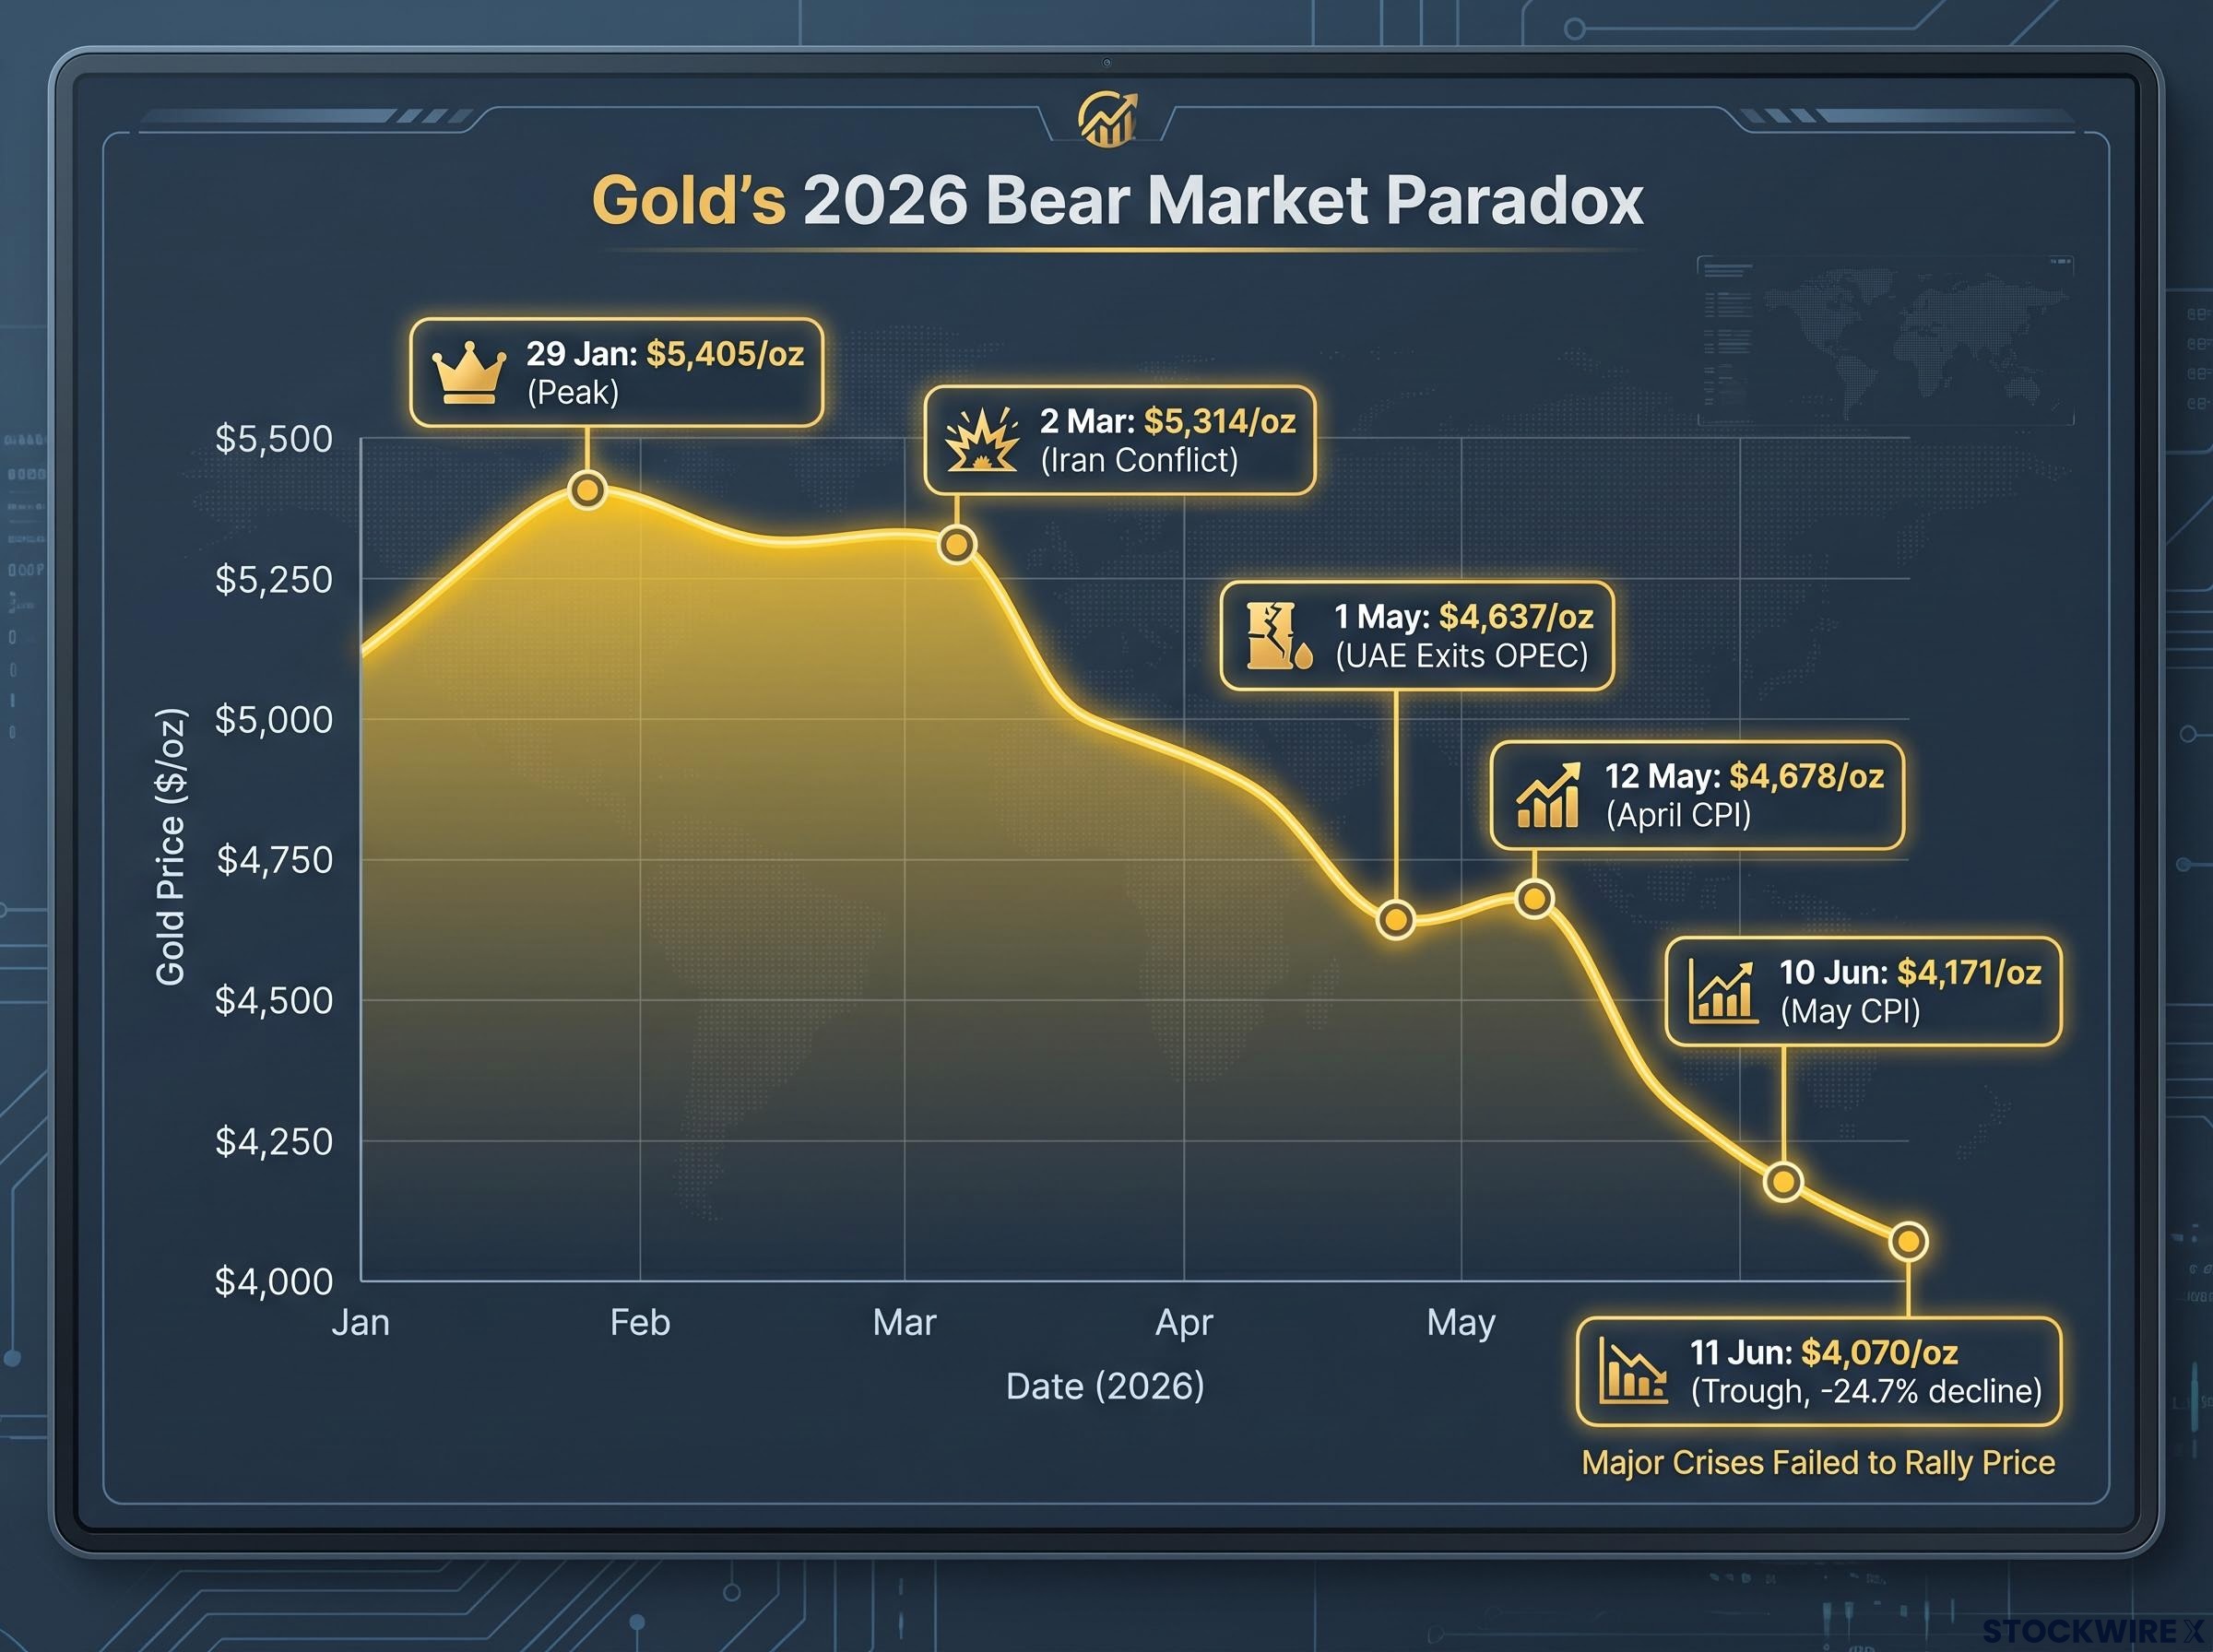
Gold hit an all-time high of $5,405 per troy ounce on 29 January 2026, capping a 2025 rally that delivered roughly 65% returns and more than 50 new records. By 11 June, spot gold had fallen to approximately $4,070 per troy ounce, a peak-to-trough decline of nearly 25%. That collapse occurred during a period that included active military conflict in the Middle East, the closure of the Strait of Hormuz, an OPEC fracture, and two consecutive US CPI prints showing renewed inflationary pressure.
This is not a story about gold behaving unusually. It is a story about how the conditions that are supposed to drive gold higher can, under specific circumstances, produce precisely the opposite result. The 2026 episode offers one of the clearest real-time stress tests of safe-haven theory in recent memory, and the results challenge assumptions that many investors still hold.
What follows explains exactly what happened, why it happened, and what it means for anyone who holds gold or is considering it as a portfolio hedge.
Gold entered 2026 on the back of an exceptional year. The 2025 rally produced returns of roughly 60-65%, more than 50 all-time highs, and a year-end close near $4,368 per troy ounce. Consensus projections pointed to $5,000 or higher. The metal reached $5,405 per troy ounce on 29 January 2026, per FactSet data.
Then the surprises began, and they ran in the wrong direction.
Air strikes on Iran commenced on 2 March, with the Strait of Hormuz officially closing on 4 March. Gold was near $5,314 per troy ounce at the onset of the conflict. It did not rally. It fell. The UAE exited OPEC on 1 May; gold was at approximately $4,637 per troy ounce and still declining. Both the April and May US CPI releases, on 12 May and 10 June respectively, showed inflationary pressures. Gold fell through both.
| Event | Date | Gold Price (approx.) | Move from Peak |
|---|---|---|---|
| All-time high | 29 Jan 2026 | $5,405/oz | — |
| Equity mini-correction begins | ~25 Feb 2026 | $5,192/oz | -3.9% |
| Iran conflict onset | 2 Mar 2026 | $5,314/oz | -1.7% |
| UAE exits OPEC | 1 May 2026 | $4,637/oz | -14.2% |
| April CPI release | 12 May 2026 | $4,678/oz | -13.4% |
| May CPI release | 10 Jun 2026 | $4,171/oz | -22.8% |
| Bear market trough | 11 Jun 2026 | $4,070/oz | -24.7% |
Gold’s peak-to-trough decline reached approximately 24.7%, crossing the conventional 20% bear market threshold in early June 2026. A partial recovery brought the price to approximately $4,355 per troy ounce by 15 June.
Every event on that timeline, the war, the oil disruption, the inflation data, would ordinarily be described as supportive for gold. Every one of them coincided with falling prices.
Gold pays no income. That single characteristic determines more about its price behaviour than any geopolitical headline.
Because gold generates no yield, holding it carries an opportunity cost that rises and falls with real interest rates, the return available on safe assets after adjusting for inflation. When real yields rise, the cost of holding a non-yielding asset increases. When the US dollar strengthens, gold becomes more expensive in every other currency, dampening demand globally. These two forces, real yields and the dollar, are the primary mechanical drivers of gold in the short to medium term.
Three variables matter most for gold over weeks and months:
Safe-haven demand is real, but it is not constant. It can and does move gold, though only when it is the dominant force acting on the price.
A crisis that triggers a flight away from fiat currency, a systemic or monetary panic, tends to support gold. A crisis that triggers a flight to cash and bonds, where liquidity needs are acute and rate expectations shift higher, tends to hurt it. The World Gold Council’s own research confirms that gold’s correlation with risk assets is time-varying. In 2026, rate expectations and the dollar won decisively.
The distinction matters because gold, government bonds, the Japanese yen, and the Swiss franc all underperformed simultaneously during this period, a pattern that is only coherent when the crisis is understood through supply shock dynamics rather than the financial-panic framework those assets were originally designed to hedge.
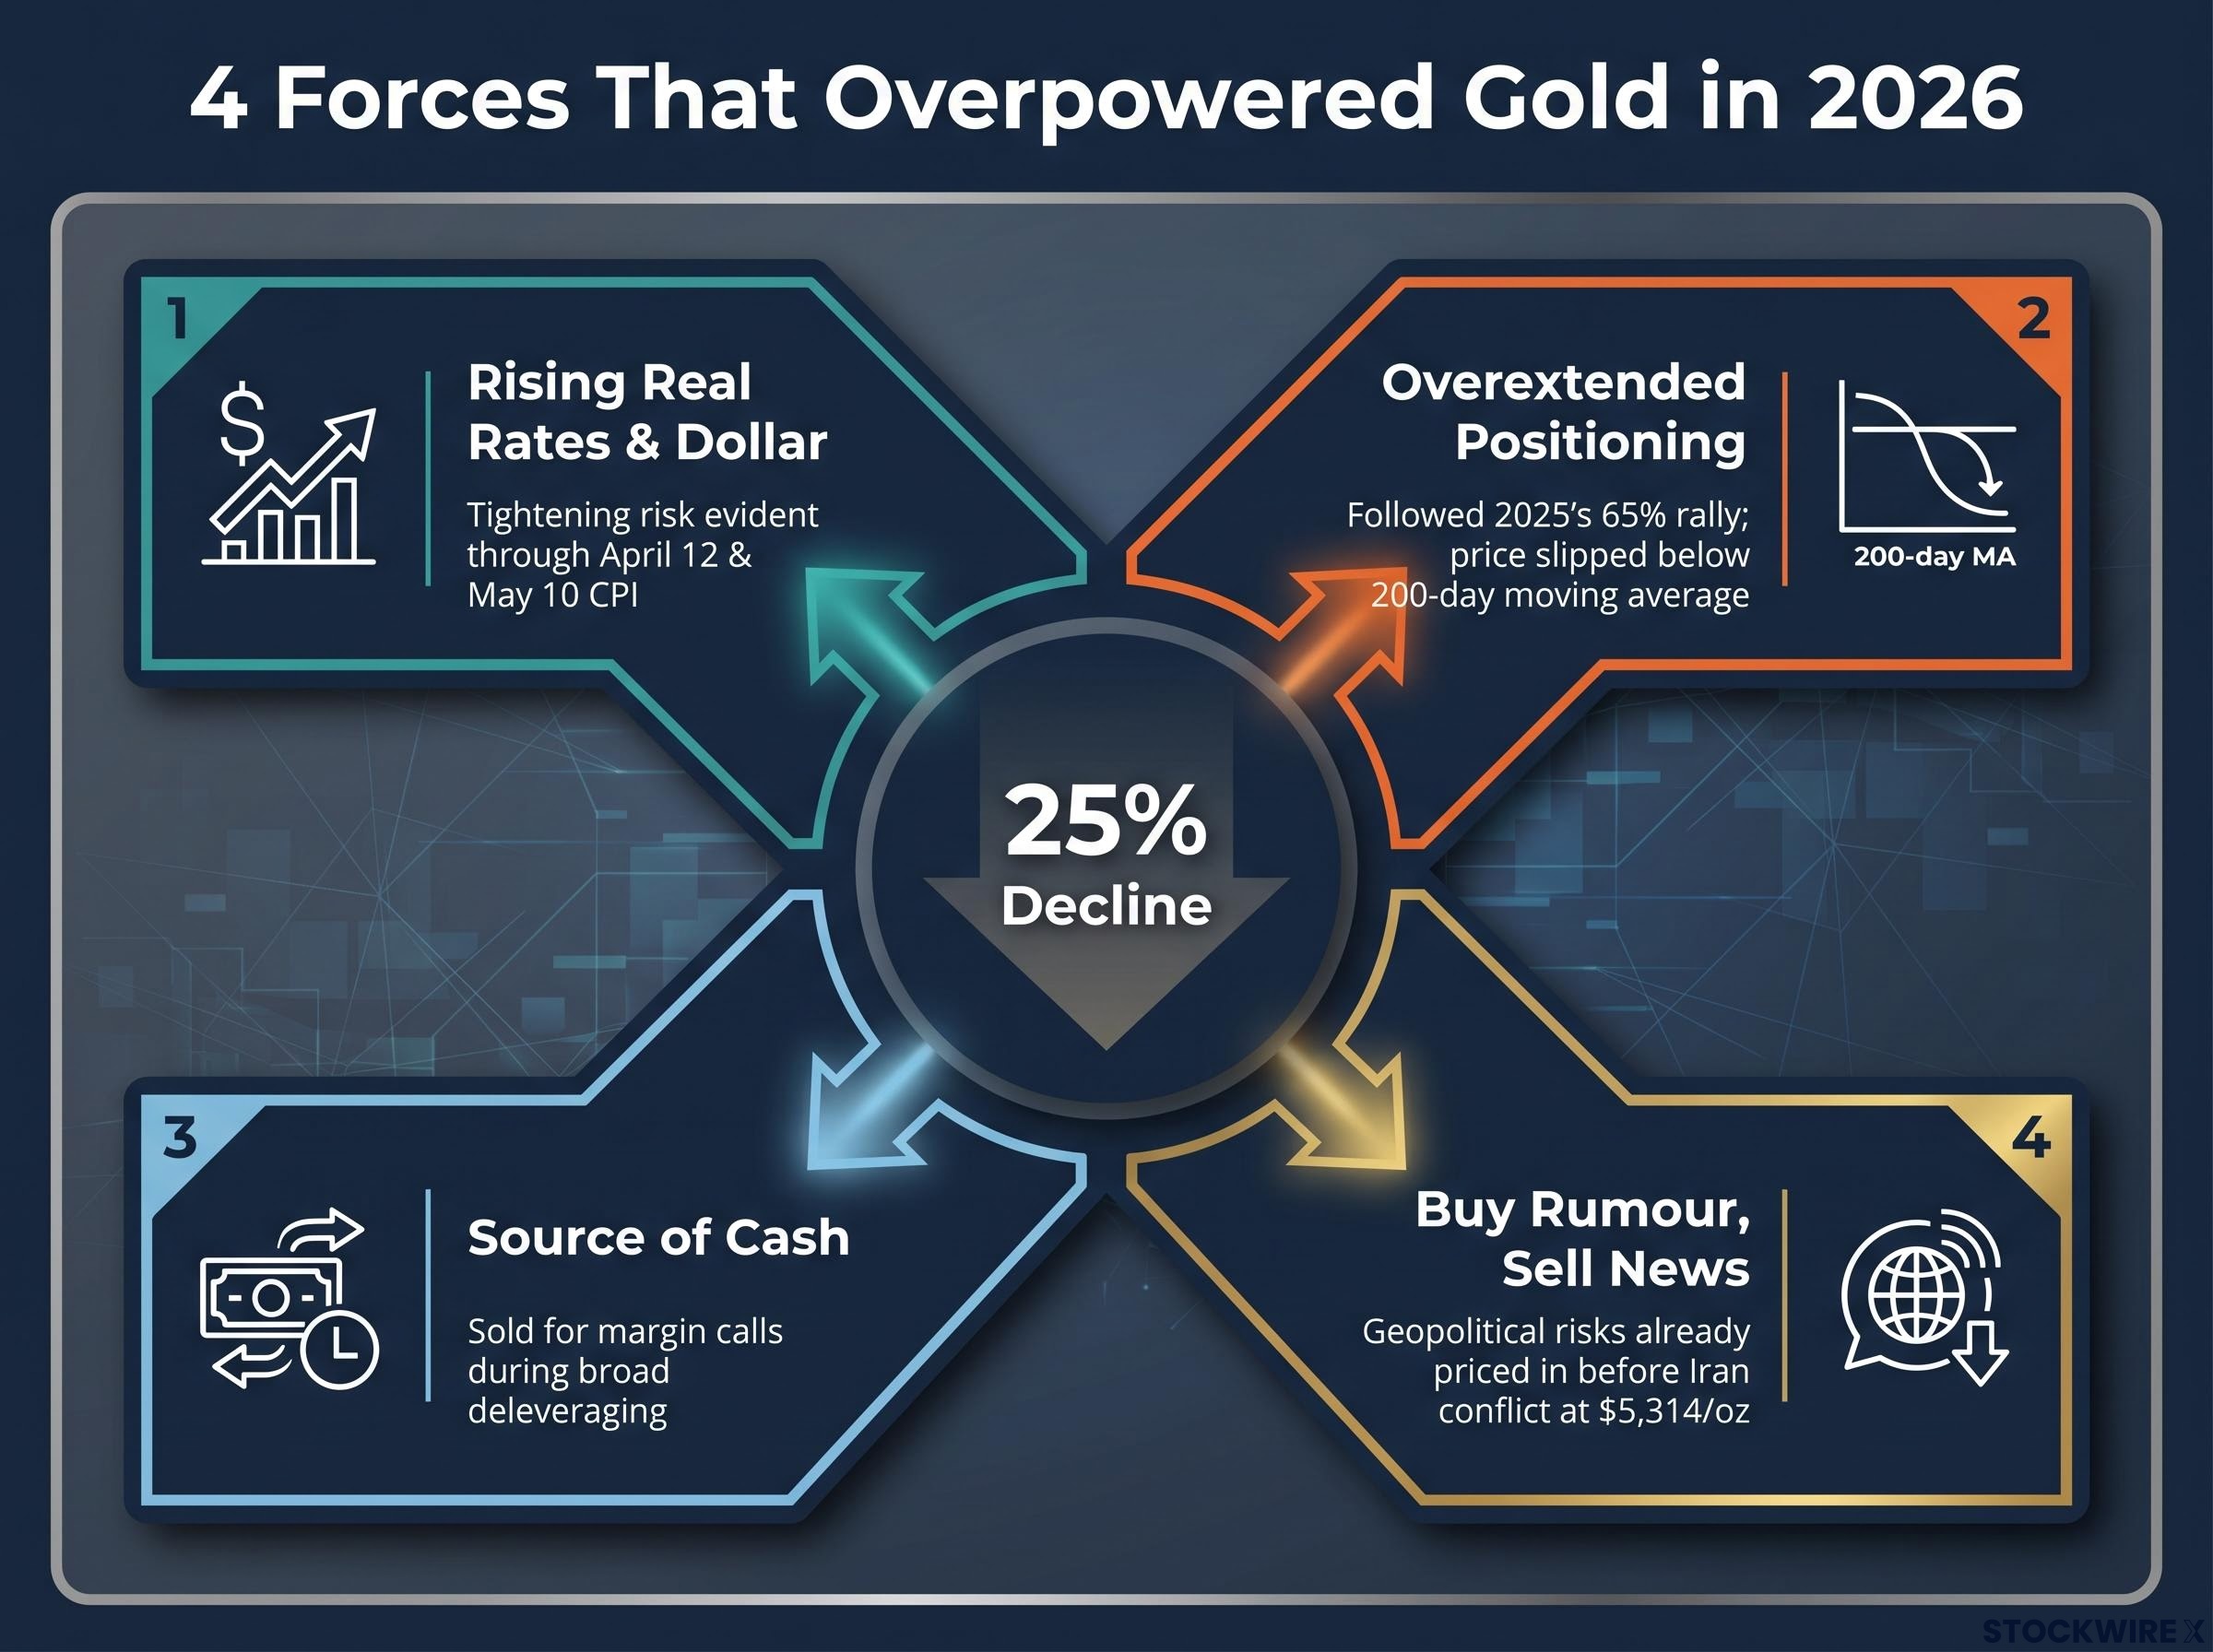
No single explanation accounts for a 25% decline in five months. Four distinct forces converged, each independently meaningful, collectively overwhelming.
Real yields and dollar pressure operated in tandem across the entire five-month decline, with US 10-year Treasury yields near 4.60% raising the opportunity cost of holding a non-yielding asset while simultaneously strengthening the dollar, making gold more expensive for every buyer outside the United States.
Citi Research cut its near-term gold target by approximately $300 to $4,000 per troy ounce after momentum broke, citing elevated downside risk following the massive 2025 run-up.
The severity of the decline is explained by convergence. Each force was independently capable of producing a correction. Together, they produced a bear market.
The performance gap between gold and equities over the first half of 2026 challenges assumptions about which asset class carries more risk.
Gold, the supposed defensive asset, experienced a drawdown nearly five times the magnitude of the global equity mini-correction that began in late February and concluded by 30 March. Equities recovered. Gold took until mid-June to claw back to roughly flat.
Gold miners faced a compounded effect during the sell-off that spot price data alone does not capture: beyond the revenue impact of falling gold prices, long-duration cash flow discounting meant that higher discount rates simultaneously compressed the present value of future production, producing equity declines that in some cases exceeded the percentage fall in the underlying metal.
This is not a permanent indictment of gold’s role. It is a concrete illustration that gold can be more volatile than broad equities over meaningful time horizons, a risk that is frequently underappreciated by investors who treat it as a stability anchor.
The World Gold Council’s 2026 outlook included scenario analysis projecting a 5-20% correction from elevated starting levels if adverse rate or dollar surprises materialised. The actual outcome, a nearly 25% peak-to-trough decline, exceeded even the pessimistic end of that range. The risk was knowable. The WGC had quantified it before the year began. The correction was not a black-swan event; it was a tail scenario that the most sophisticated gold research had explicitly modelled.
The World Gold Council’s 2026 outlook published in December 2025 included explicit scenario analysis projecting a 5-20% correction from elevated starting levels if real yields rose or the dollar strengthened unexpectedly, making the eventual 24.7% drawdown a tail outcome that the leading industry research body had formally modelled rather than a bolt-from-the-blue surprise.
The 2026 episode validated a specific set of indicators that proved more useful than headline-watching for assessing gold’s direction. Four deserve attention:
Starting valuation is the risk factor that receives the least attention. Buying gold after a 60-65% annual gain at record highs embeds a substantial risk premium into the entry price. Under those conditions, even modest disappointments in rate trajectories or growth can produce outsized downside, as the 2026 episode demonstrated with precision.
Gold’s safe-haven function depends on the simultaneous direction of real yields, the dollar, and positioning, not on the severity of the geopolitical headline.
Gold can serve a diversification function over longer time horizons. It is not, however, a reliable short-term hedge against every geopolitical shock or CPI print. The empirical record from 2026 is now the clearest case study demonstrating this distinction.
Gold traded at approximately $4,355 per troy ounce on 15 June, having recovered from the $4,070 trough on 11 June. On a net basis, the metal is approximately flat for the year, a far cry from the record-extending gains consensus had projected in January. Whether the trough proves to be the cycle low remains an open question. Citi Research’s near-term target of approximately $4,000 per troy ounce suggests at least one major institution sees further downside as plausible.
The core lesson is specific rather than sweeping. The 2026 bear market did not prove gold is useless as a portfolio hedge. It proved that safe-haven logic is not self-executing. Real rates, dollar direction, and entry valuation determine whether a geopolitical and inflationary backdrop translates into gold price gains or, as in 2026, produces a bear market instead.
Safe-haven logic is not self-executing. The conditions that are supposed to make gold go up can produce the opposite result when real yields, the dollar, and positioning are aligned against it.
For investors reassessing gold at mid-year, the four-indicator framework offers a forward-looking lens. If real yields turn lower and the dollar weakens from current levels, gold’s recovery thesis has a mechanism. Without those conditions, recovery lacks the same structural support, regardless of how many geopolitical risks remain on the front page.
Investors reassessing gold at mid-year will find our deep-dive into the long-term structural gold thesis, which examines central bank reserve diversification, the breakdown of stock-bond correlation that has eroded the diversification value of government bonds, and the multi-year horizon over which a 5-10% gold allocation has historically improved risk-adjusted returns in a 60/40 portfolio.
This article is for informational purposes only and should not be considered financial advice. Investors should conduct their own research and consult with financial professionals before making investment decisions. Past performance does not guarantee future results. Financial projections are subject to market conditions and various risk factors.
Four forces converged to drive gold down nearly 25% from its January 2026 peak: rising real interest rates and a stronger US dollar, overextended long positioning after a 65% rally in 2025, forced selling of gold as a liquid funding source during deleveraging, and a 'buy the rumour, sell the news' dynamic where geopolitical risks had already been priced into the 2025 rally.
Because gold pays no income, holding it carries an opportunity cost that rises when real yields increase; higher real rates make yield-bearing assets more attractive by comparison, compressing gold prices, while falling real rates reduce that opportunity cost and tend to support gold.
Gold was already near $5,314 per troy ounce when air strikes on Iran began in March 2026, meaning a substantial geopolitical risk premium had been built into the price during the 2025 rally; when the conflict materialised, the incremental safe-haven bid was limited and rate-expectations pressure from energy-driven inflation proved the dominant force.
Gold experienced a peak-to-trough drawdown of nearly 24.7% from its January high before recovering to roughly flat by mid-June, while the MSCI World Index posted positive returns year-to-date through 15-16 June 2026, meaning gold's drawdown was nearly five times the magnitude of the global equity mini-correction that resolved by the end of March.
The four most reliable indicators are the direction of real yield curves, the trend of the US dollar (DXY index), futures positioning data to identify crowded longs, and whether gold is trading above or below its 200-day moving average, as a breach of that level in early 2026 coincided with an acceleration of the sell-off.