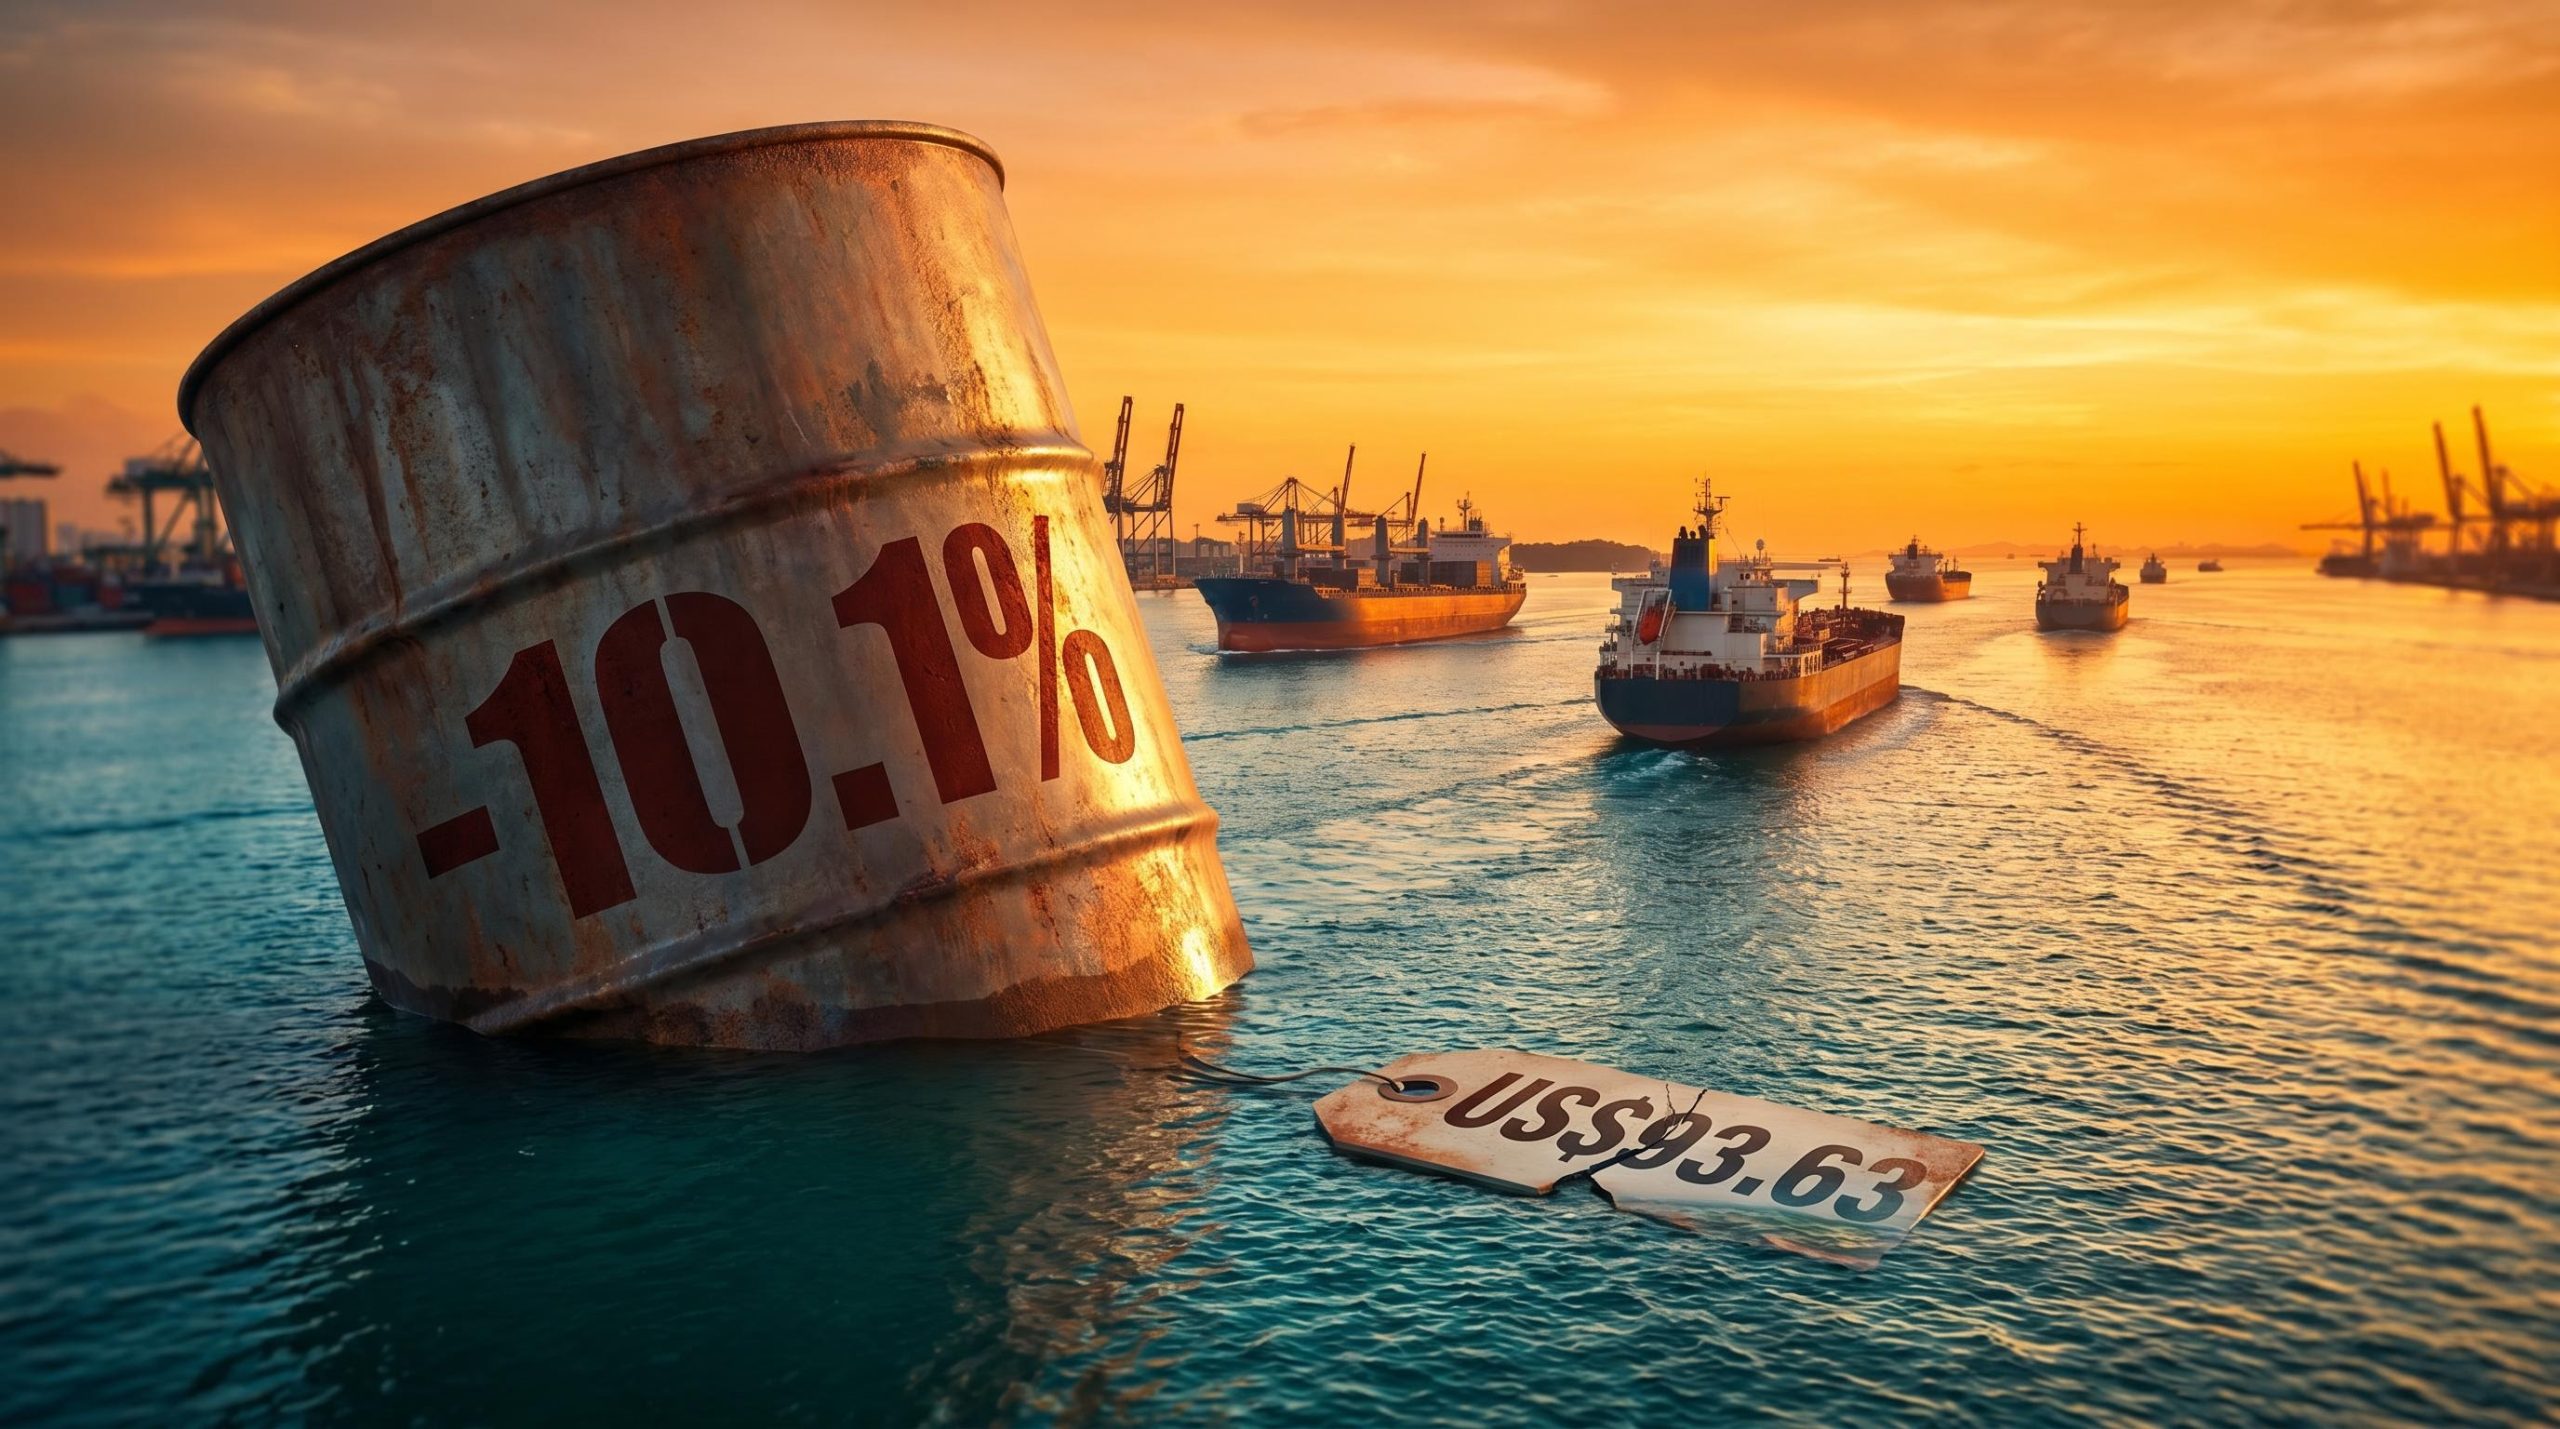
Brent crude plunged 10.1% in a single session on 25 May 2026, settling at US$93.63, its sharpest one-day decline in months. The trigger: reports that a draft US-Iran memorandum could reopen the Strait of Hormuz within weeks. The move sent ripples across equities, bonds, currencies, and commodities simultaneously, a reminder of how a single geopolitical development can reprice global risk in hours. With US and UK markets closed for public holidays, the scale of the selloff in reduced liquidity conditions made it more striking still. What follows maps the trigger, the oil supply mechanics, the cross-asset winners and losers, and what Australian investors should be watching as the situation develops.
A draft deal with Tehran sent crude into freefall
The market reaction traced directly to a draft memorandum reported by Axios, and its provisions were specific enough to move prices before any ink dried. The reported terms included:
- A 60-day ceasefire extension between the US and Iran
- Reopening of the Strait of Hormuz, with Iran responsible for mine clearance
- A phased removal of the US naval blockade
- Unfreezing of Iranian assets held abroad
President Trump publicly framed the negotiations as progressing well. Iran’s Foreign Ministry acknowledged that consensus had been reached on many topics, though it cautioned against assuming an imminent signing.
Iran’s Foreign Ministry stated that while consensus had been reached on many topics, an imminent signing of any agreement should not be assumed.
The crude selloff reflected that distinction only partially. Brent fell 10.1% to US$93.63, a near five-week low. WTI declined 6.02% to US$90.31. The move was a reassessment of the supply-risk premium that had been embedded in oil prices throughout the Hormuz disruption, not a shift in demand fundamentals. For investors, the question is whether those provisions become binding terms or remain a negotiating framework that unravels.
When big ASX news breaks, our subscribers know first
What the Strait of Hormuz actually carries, and why markets priced the news so aggressively
The Strait of Hormuz is the world’s most consequential oil chokepoint, the narrow passage through which a substantial share of globally traded crude and liquefied natural gas transits daily. Its partial closure during the US-Iran confrontation had been the single largest source of geopolitical risk premium in energy markets for weeks. Any credible prospect of reopening was always going to trigger a sharp repricing.
The Hormuz supply disruption that preceded this session was not a sudden event but a compounding process: Brent crude climbed approximately 57% from around US$70 per barrel in late February 2026 to above US$110 by mid-May, as Gulf production shut-ins peaked near 10.8 million barrels per day and bypass pipeline alternatives proved structurally insufficient to close the volume gap.
The EIA Strait of Hormuz chokepoint data places the strait’s pre-conflict throughput at approximately 20-21 million barrels per day of crude and petroleum liquids, a volume representing roughly one-fifth of global petroleum trade and explaining why even a partial closure generates outsized risk premiums across energy markets worldwide.
The numbers, however, reveal a gap between the reported progress and the physical reality. The IRGC Navy reported 35 vessels transited in a 24-hour window on 22 May 2026, up from 26 earlier that week. Independent vessel tracking indicated the pre-conflict daily average was well above recent transit levels, meaning actual throughput remained well below historical norms.

| Metric | Reported Figure | Pre-Conflict Baseline |
|---|---|---|
| IRGC-reported daily vessel transits | 35 | 138 |
| Independent tracking estimate | Well below average | 138 |
That gap matters. Markets may be pricing an optimistic supply-restoration scenario that the physical data does not yet support, creating the conditions for a price reversal if negotiations stall.
LNG flows and European gas prices respond first
Three LNG tankers from the Persian Gulf navigated the strait in recent days, the first tangible evidence of partial reopening. European natural gas futures responded, declining below 49 euros per megawatt hour from a six-week peak, according to Bloomberg data. Gas markets, with their tighter supply chains and fewer alternative routing options, proved more immediately sensitive to the transit signal than crude.
Global equities celebrated, but the gains were uneven
Japan’s Nikkei 225 hit a fresh all-time high of 65,158, up 2.87% on the session. The three-day cumulative advance of 8.95% was the sharpest in more than six years.
Europe followed. The STOXX 600 rose 1.04% to its highest level since 2 March, sitting within 1% of its February record peak. European bank stocks gained approximately 2%, lifted by falling bond yields. Germany’s DAX climbed 2.01% to 25,389.
US and UK markets were closed for Memorial Day and Spring Bank Holiday respectively, concentrating activity in Europe and Asia and likely amplifying moves in thinner liquidity. S&P 500 futures rose 0.98%; Nasdaq futures gained 1.37%.
| Index | Country | Level | Change (%) | Driver |
|---|---|---|---|---|
| Nikkei 225 | Japan | 65,158 | +2.87% | All-time high; tech and chip stocks |
| STOXX 600 | Europe | Highest since 2 Mar | +1.04% | Banks, falling bond yields |
| DAX | Germany | 25,389 | +2.01% | Broad risk-on sentiment |
| S&P 500 Futures | US | Futures only | +0.98% | Cash market closed |
| Shanghai Composite | China | 4,153 | +0.96% | Regional risk-on |
The breadth of gains across geographies confirmed this was a macro sentiment shift. The varying magnitudes, however, reveal which markets carry the most sensitivity to oil-price and geopolitical-risk inputs.
Airlines flew higher while chip stocks rode a different tailwind
Not all beneficiaries of this session were beneficiaries for the same reason. The distinction matters for how investors interpret the rally.
Brent’s drop below US$100 per barrel directly reduced fuel cost expectations for European carriers, whose fuel bills are priced against crude benchmarks. Japanese chip and technology stocks rallied on a separate catalyst: AI-related enthusiasm was cited alongside lower energy costs, and conflating the two misreads the investment thesis.
- European airlines: Lufthansa gained approximately 3%; Air France-KLM rose approximately 6%
- Japanese tech and chip stocks: Renesas and Rohm each climbed approximately 10%; SoftBank rose more than 5%; Tokyo Electron gained more than 3%
An unnamed Israeli official argued the emerging deal demonstrated to Tehran that Hormuz control was as powerful a geopolitical tool as nuclear capability, a framing that introduces residual risk to the optimistic scenario priced into markets.
For Australian investors holding international equity exposures, the distinction between oil-price beneficiaries and AI-momentum plays carries different duration and reversal risk.
Bonds and inflation expectations shifted, but the RBA picture is more complicated
The mechanism is straightforward: lower oil prices reduce near-term inflation expectations, which reduces the anticipated pace of central bank rate increases, which is why European bond yields fell on the session.
- Germany 10-year bond yield: down 10 basis points to 2.93%, approaching a one-month low
- US 10-year Treasury yield: 4.558%
- VIX: 16.59, consistent with a risk-on session
- AUD/USD: 0.7171
The ECB, Bank of England, and US Federal Reserve all face modestly reduced inflation pressure if oil prices hold at these levels. Bitcoin traded at US$77,319, up 0.79%; Ethereum reached AUD$2,939, up 1.21%, reflecting the broader risk appetite.
What lower crude means for ASX energy names
The Australian picture is more nuanced. Lower oil prices ease imported inflation, but they also reduce revenue and earnings expectations for ASX-listed energy producers including Woodside and Santos. The net effect on the Reserve Bank of Australia’s rate calculus is non-trivial.
The RBA’s inflation calculus was already strained before 25 May: Australian CPI reached 4.6% in the year to March 2026, the cash rate was raised to 4.10% in March, and RBC analysts warned headline inflation could peak at 5-6% if crude remained elevated, a backdrop that makes the directional move in oil prices directly consequential for ASX equity multiples and fixed income positioning.
Adding complexity, Australian coal stocks had already surged earlier in the week on a separate catalyst: China’s suspension of coal mines in Shanxi province. Coronado rose 20.9%, Whitehaven gained 8.7%, and Yancoal added 7.4%. The result is a split picture within the ASX resources complex, with energy names facing a headwind and coal names riding a supply-driven tailwind.
ASX sector rotation during oil shocks does not produce uniform outcomes even within the resources complex: at Brent above US$110, Woodside, Santos, and Karoon Energy gained approximately 40% year-to-date on oil-indexed LNG revenues, while Qantas absorbed an estimated A$800 million increase in its fuel bill, illustrating the divergence that a move back toward those price levels could reinstall if the draft deal unravels.

The deal is not signed, and markets know it
The scale of the session’s moves warrants respect. The speed and breadth of repricing reflect genuine reassessment. The optimism, however, rests on a draft memorandum, not a signed agreement.
The unresolved risks are specific:
- Netanyahu’s position: The Israeli Prime Minister stated publicly that Trump had assured him Iran’s nuclear programme would be completely dismantled and enriched uranium removed, a condition that may not align with the draft’s reported terms
- Israeli opposition framing: An unnamed Israeli official argued the deal demonstrated to Tehran that Hormuz control rivals nuclear capability, signalling political resistance to the agreement’s structure
- Iran’s own caution: The Foreign Ministry acknowledged consensus on many topics while explicitly stating an imminent signing should not be assumed
The 60-day ceasefire is an extension, not a resolution. Mine clearance responsibility falls on Iran and carries execution uncertainty. The phased US naval blockade removal introduces sequencing complexity where a single delay could unwind the framework.
The session’s moves represent a geopolitical risk premium being partially unwound. The physical supply gap, 35 reported daily transits versus the 138-ship pre-conflict baseline, remains the leading indicator. If transit volumes do not normalise toward that baseline, the optimism priced into crude may prove premature.
The supply normalisation timeline matters as much as the diplomatic one: Saudi Aramco’s CEO warned that recovery could extend into 2027, and war-risk insurance premiums remained at crisis levels even after the April ceasefire announcement, meaning transit volume restoration depends on commercial confidence that lags the diplomatic signal by weeks or months.
A 10% oil session is a signal worth reading carefully, whatever comes next
A 10.1% single-session crude move driven by geopolitical de-escalation is historically significant. It reveals the size of the risk premium that had accumulated in oil prices throughout the Hormuz disruption, and the speed with which markets will shed it when presented with credible relief.
Australian investors should distinguish between the immediate reaction (broad equity gains, lower bond yields, airline and tech outperformance) and the durable thesis, which depends entirely on whether transit volumes actually normalise toward the 138-ships-per-day baseline. Independent vessel transit data from Hormuz is the leading indicator. ASX energy names, particularly Woodside and Santos, are the domestic barometer for how Australian portfolios are being repriced.
This article is for informational purposes only and should not be considered financial advice. Investors should conduct their own research and consult with financial professionals before making investment decisions. Past performance does not guarantee future results, and these forward-looking statements are subject to change based on market developments and geopolitical outcomes.