Cook Warns Memory Costs Will Force Apple Price Increases in 2026
1 hr ago

Over 1 trillion dollars was erased from major technology market values in a single week leading into the late April 2026 reporting period. Financial markets are facing a severe stress test as Amazon, Alphabet, Meta, and Microsoft prepare to reveal their first-quarter performance against a backdrop of unprecedented infrastructure spending. The anticipation surrounding big tech earnings disclosures highlights a growing disconnect between escalating artificial intelligence expenditures and delayed commercial monetisation.
This analysis provides United States investors with a comprehensive framework to navigate the widening gap between corporate cash burn and verifiable enterprise returns. Capital reallocation is punishing deferred profitability, demanding a closer look at whether these massive capital expenditures represent necessary structural capacity or speculative overreach. The speed of the recent sell-off indicates that historical growth assumptions are no longer sufficient to support current valuations. Investors require immediate visibility into how these capital deployments translate into physical assets and future cash flows.
The recent market capitalisation wipeout affecting the primary technology conglomerates has shifted sentiment from optimism to immediate financial anxiety. Investors are demanding validation of capital allocation strategies before committing further funds. United States benchmark interest rates holding steady in the 3.50-3.75% range leave little tolerance for speculative corporate spending. High borrowing costs fundamentally alter how markets penalise deferred profitability, forcing a reassessment of aggressive capital deployment across the entire technology sector.
Market Correction Scale The combined market value loss of over $1 trillion across major technology stocks over the past week reflects breathtaking fears that infrastructure spending is rapidly outpacing near-term monetisation capabilities.
The upcoming disclosures serve as a high-stakes validation point for the broader financial system. According to market data, Amazon, Alphabet, Meta, and Microsoft collectively represent approximately 18.3% of the total S&P 500 index valuation. This extreme concentration risk means any systemic repricing of these specific entities cascades directly through broader United States market indexes.
This unprecedented index concentration risk leaves passive investors exposed to outsized volatility, as any sustained multiple compression among these specific mega-caps effectively dictates the performance of the entire benchmark.
Investors must understand these macroeconomic headwinds before evaluating isolated company earnings. When capital is expensive, the financial penalty for over-investing without immediate returns compounds rapidly. The market is aggressively discounting future earnings growth in favour of present-day cash preservation.
Capital expenditure in the current technology cycle specifically targets the construction of data centres and the procurement of specialised computational chips. This physical infrastructure requires massive upfront capital, fundamentally altering corporate balance sheets and shifting cash flows. Free cash flow across the sector could potentially drop by up to 90% in the short term as these aggressive build-outs consume available liquidity.
Beyond liquidity absorption, these massive deployments are increasingly vulnerable to hardware supply chain bottlenecks, which could artificially constrain the very infrastructure scale these companies are paying a premium to achieve.
Despite stable core businesses, this heavy investment phase visually resembles cash destruction to cautious retail and institutional shareholders. However, this infrastructure spending represents roughly 15-20% of the combined annual revenue for these major players. Given that combined annual revenue for these entities exceeds $1.5 trillion, the capital allocation remains mathematically sustainable, provided it yields future returns.
This educational foundation allows commercial investors to look past frightening headline cash burn rates. Understanding the mechanical relationship between hardware procurement and subsequent depreciation helps normalise the expected drop in free cash flow.
Executives face a complex dilemma when balancing the immediate financial penalty of over-investing against the threat of falling behind competitors. Falling behind in structural capacity could permanently damage market share in highly profitable enterprise cloud services.
According to industry analysts, this massive spending functions as a necessary defensive manoeuvre rather than pure speculation. The infrastructure being built today serves as the foundational layer for all future digital commercial services.
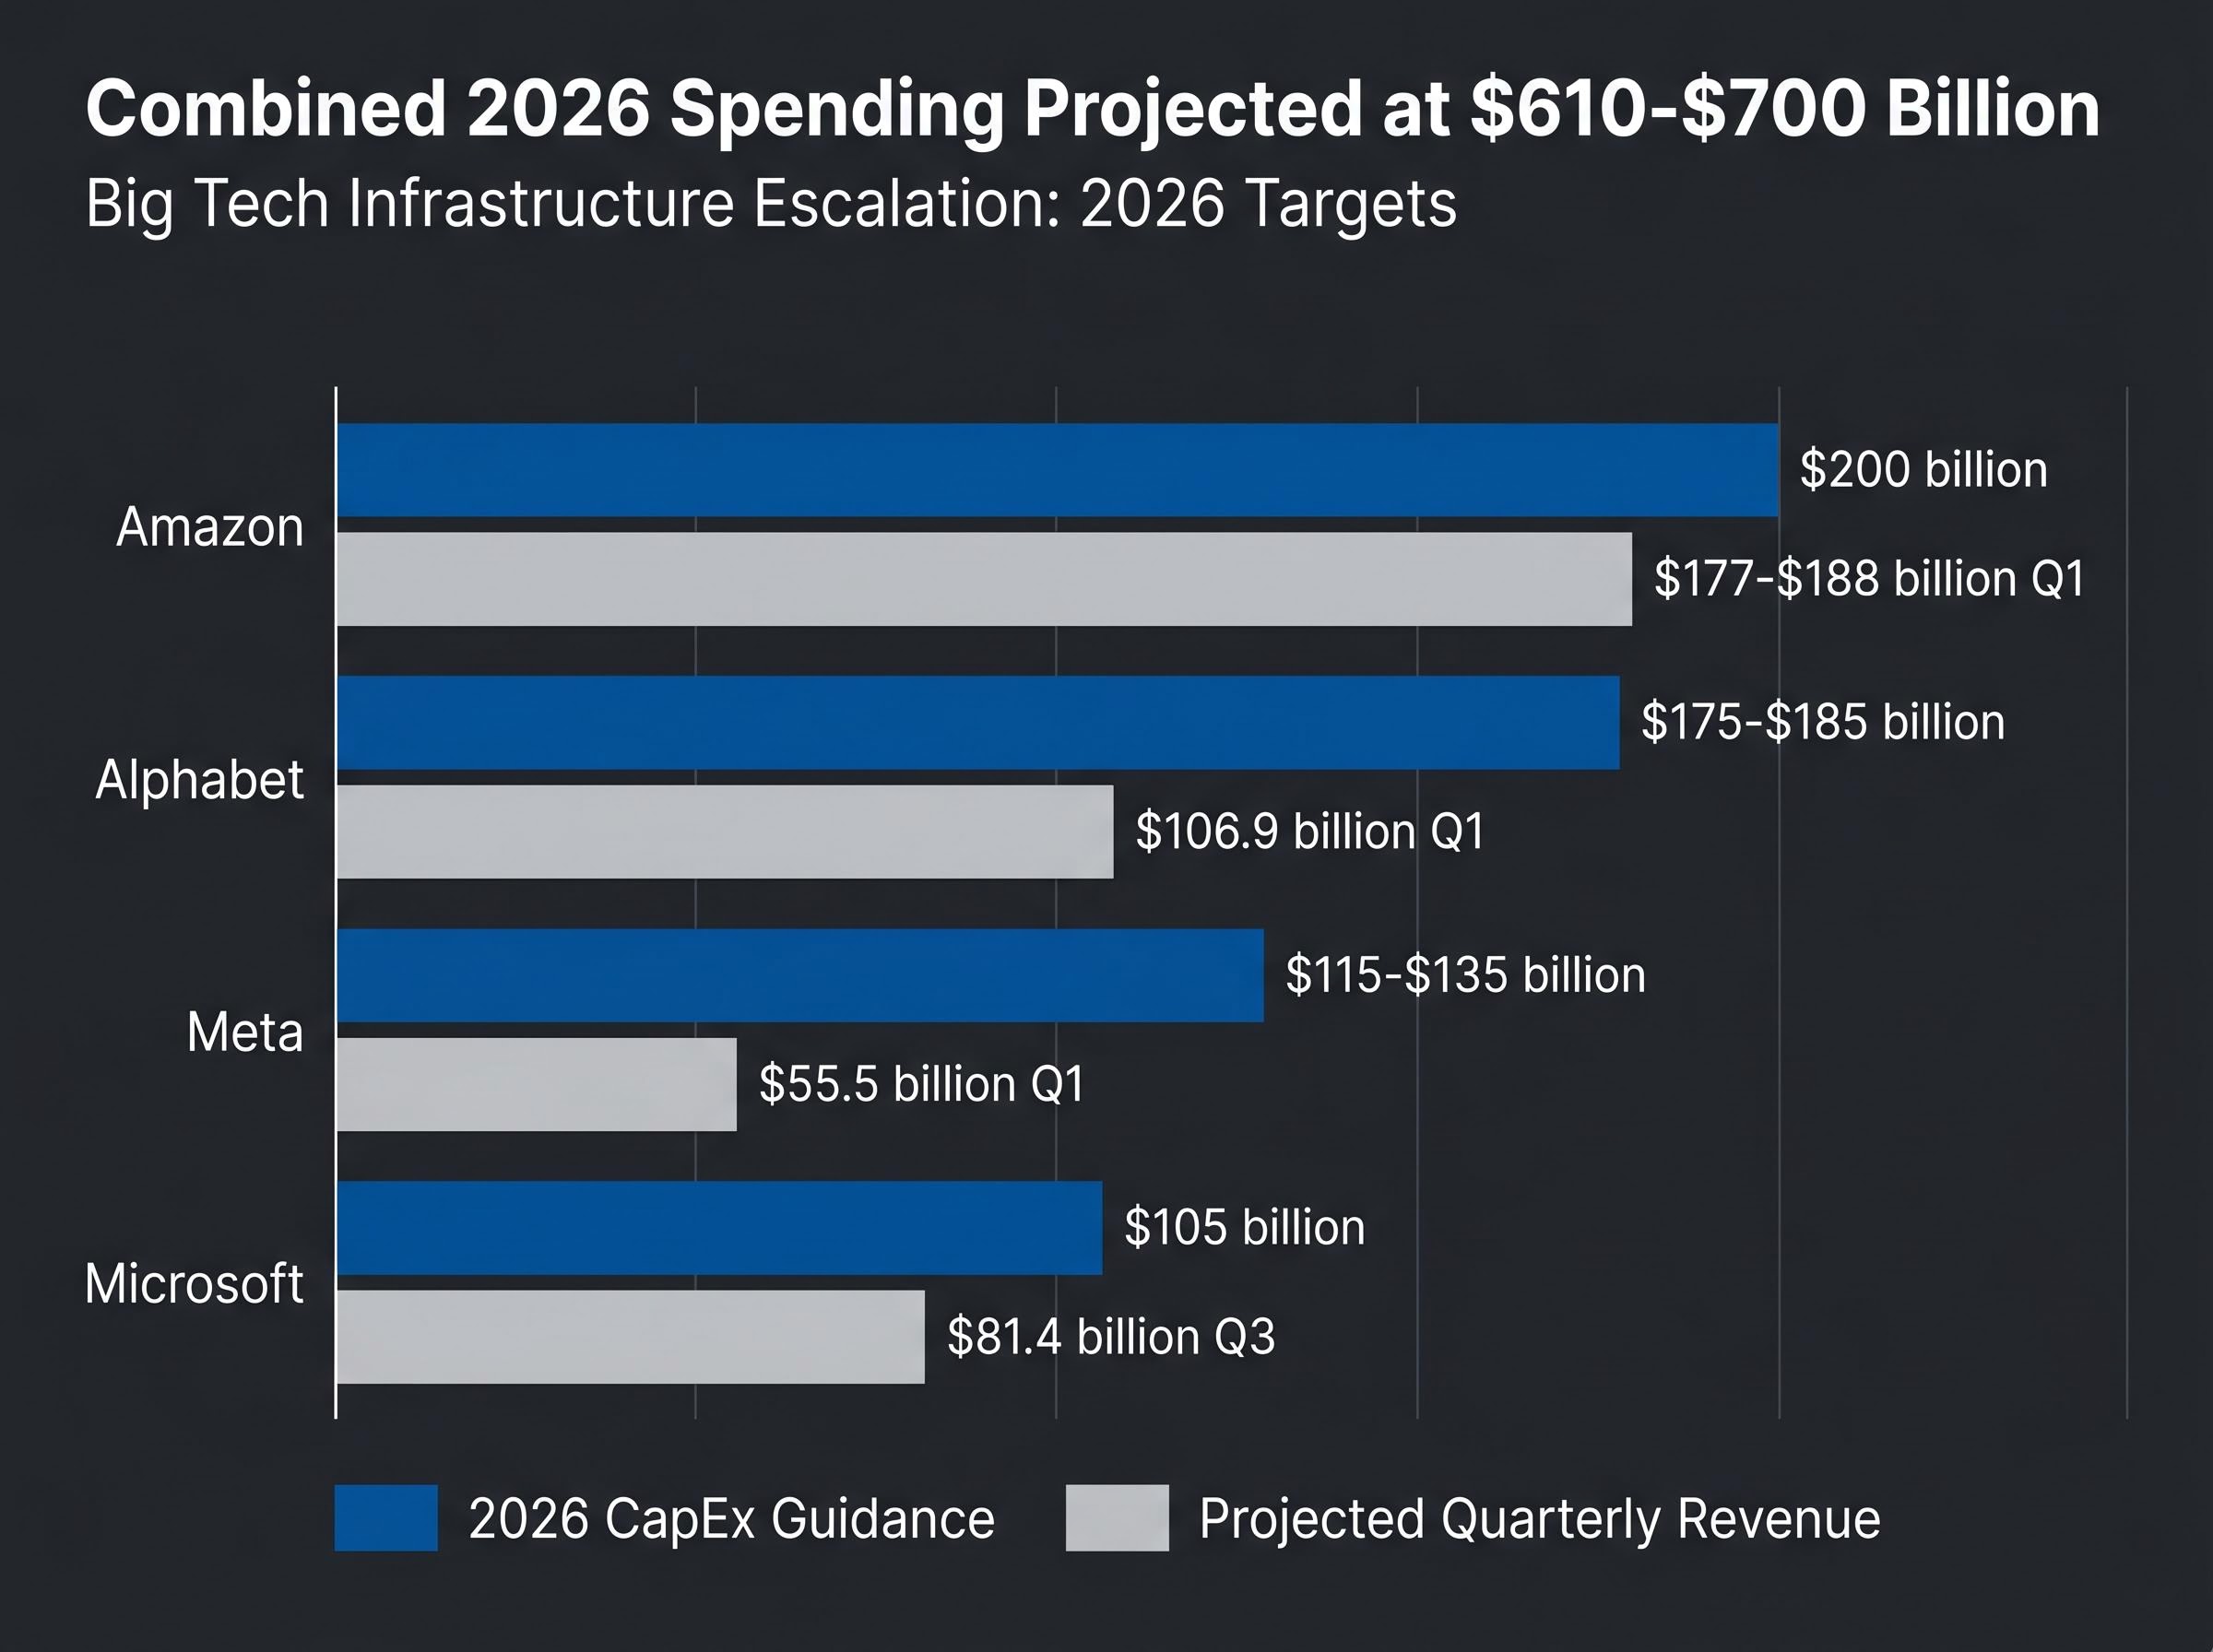
The sheer scale of this infrastructure escalation becomes apparent when examining the individual spending commitments of the four major technology players for the 2026 fiscal year. Combined 2026 spending is projected to reach $610-$700 billion, marking an aggressive year-over-year growth from approximately $410 billion in 2025. This massive acceleration is heavily driven by requirements for advanced data centres and specialised artificial intelligence hardware.
Amazon plans $200 billion in full-year spending alongside $177-$188 billion in projected first-quarter revenue, representing an approximately 50% year-over-year increase in capital allocation. Alphabet projects $175-$185 billion in spending, contrasting with expected first-quarter revenue of around $106.9 billion. Meta guides for $115-$135 billion in spending against $55.5 billion in expected revenue. Microsoft expects $105 billion in full-year spending, contrasting with projected fiscal third-quarter revenue of roughly $81.4 billion.
Contrasting these massive infrastructure targets with projected first-quarter revenues highlights the unprecedented spending ratios these companies are maintaining. Providing exact financial parameters allows investors to measure actual reported earnings against established Wall Street expectations. This specific comparison clarifies which technology conglomerates are stretching their balance sheets the furthest to capture structural capacity.
| Company | Projected Q1 2026 Revenue | 2026 CapEx Guidance |
|---|---|---|
| Amazon | $177-$188 billion | $200 billion |
| Alphabet | $106.9 billion | $175-$185 billion |
| Meta | $55.5 billion | $115-$135 billion |
| Microsoft | $81.4 billion | $105 billion |
A profound friction emerges when contrasting this massive enterprise spending with alarming consumer utilisation metrics. Total United States investment in the sector has reached $285.9 billion, yet the immediate demand side of the equation is showing signs of severe strain. Early cloud computing successes are currently being overshadowed by severe shortfalls observed in consumer subscription models.
OpenAI user metrics serve as a critical warning signal for the broader digital infrastructure ecosystem. Despite hitting $12.7 billion in annual recurring revenue during the first quarter of 2026, OpenAI ChatGPT Plus users are expected to drop 80%, falling from 44 million in 2025 to just 9 million in 2026. This sharp decline forces investors to question the immediate monetisation potential of generative software applications.
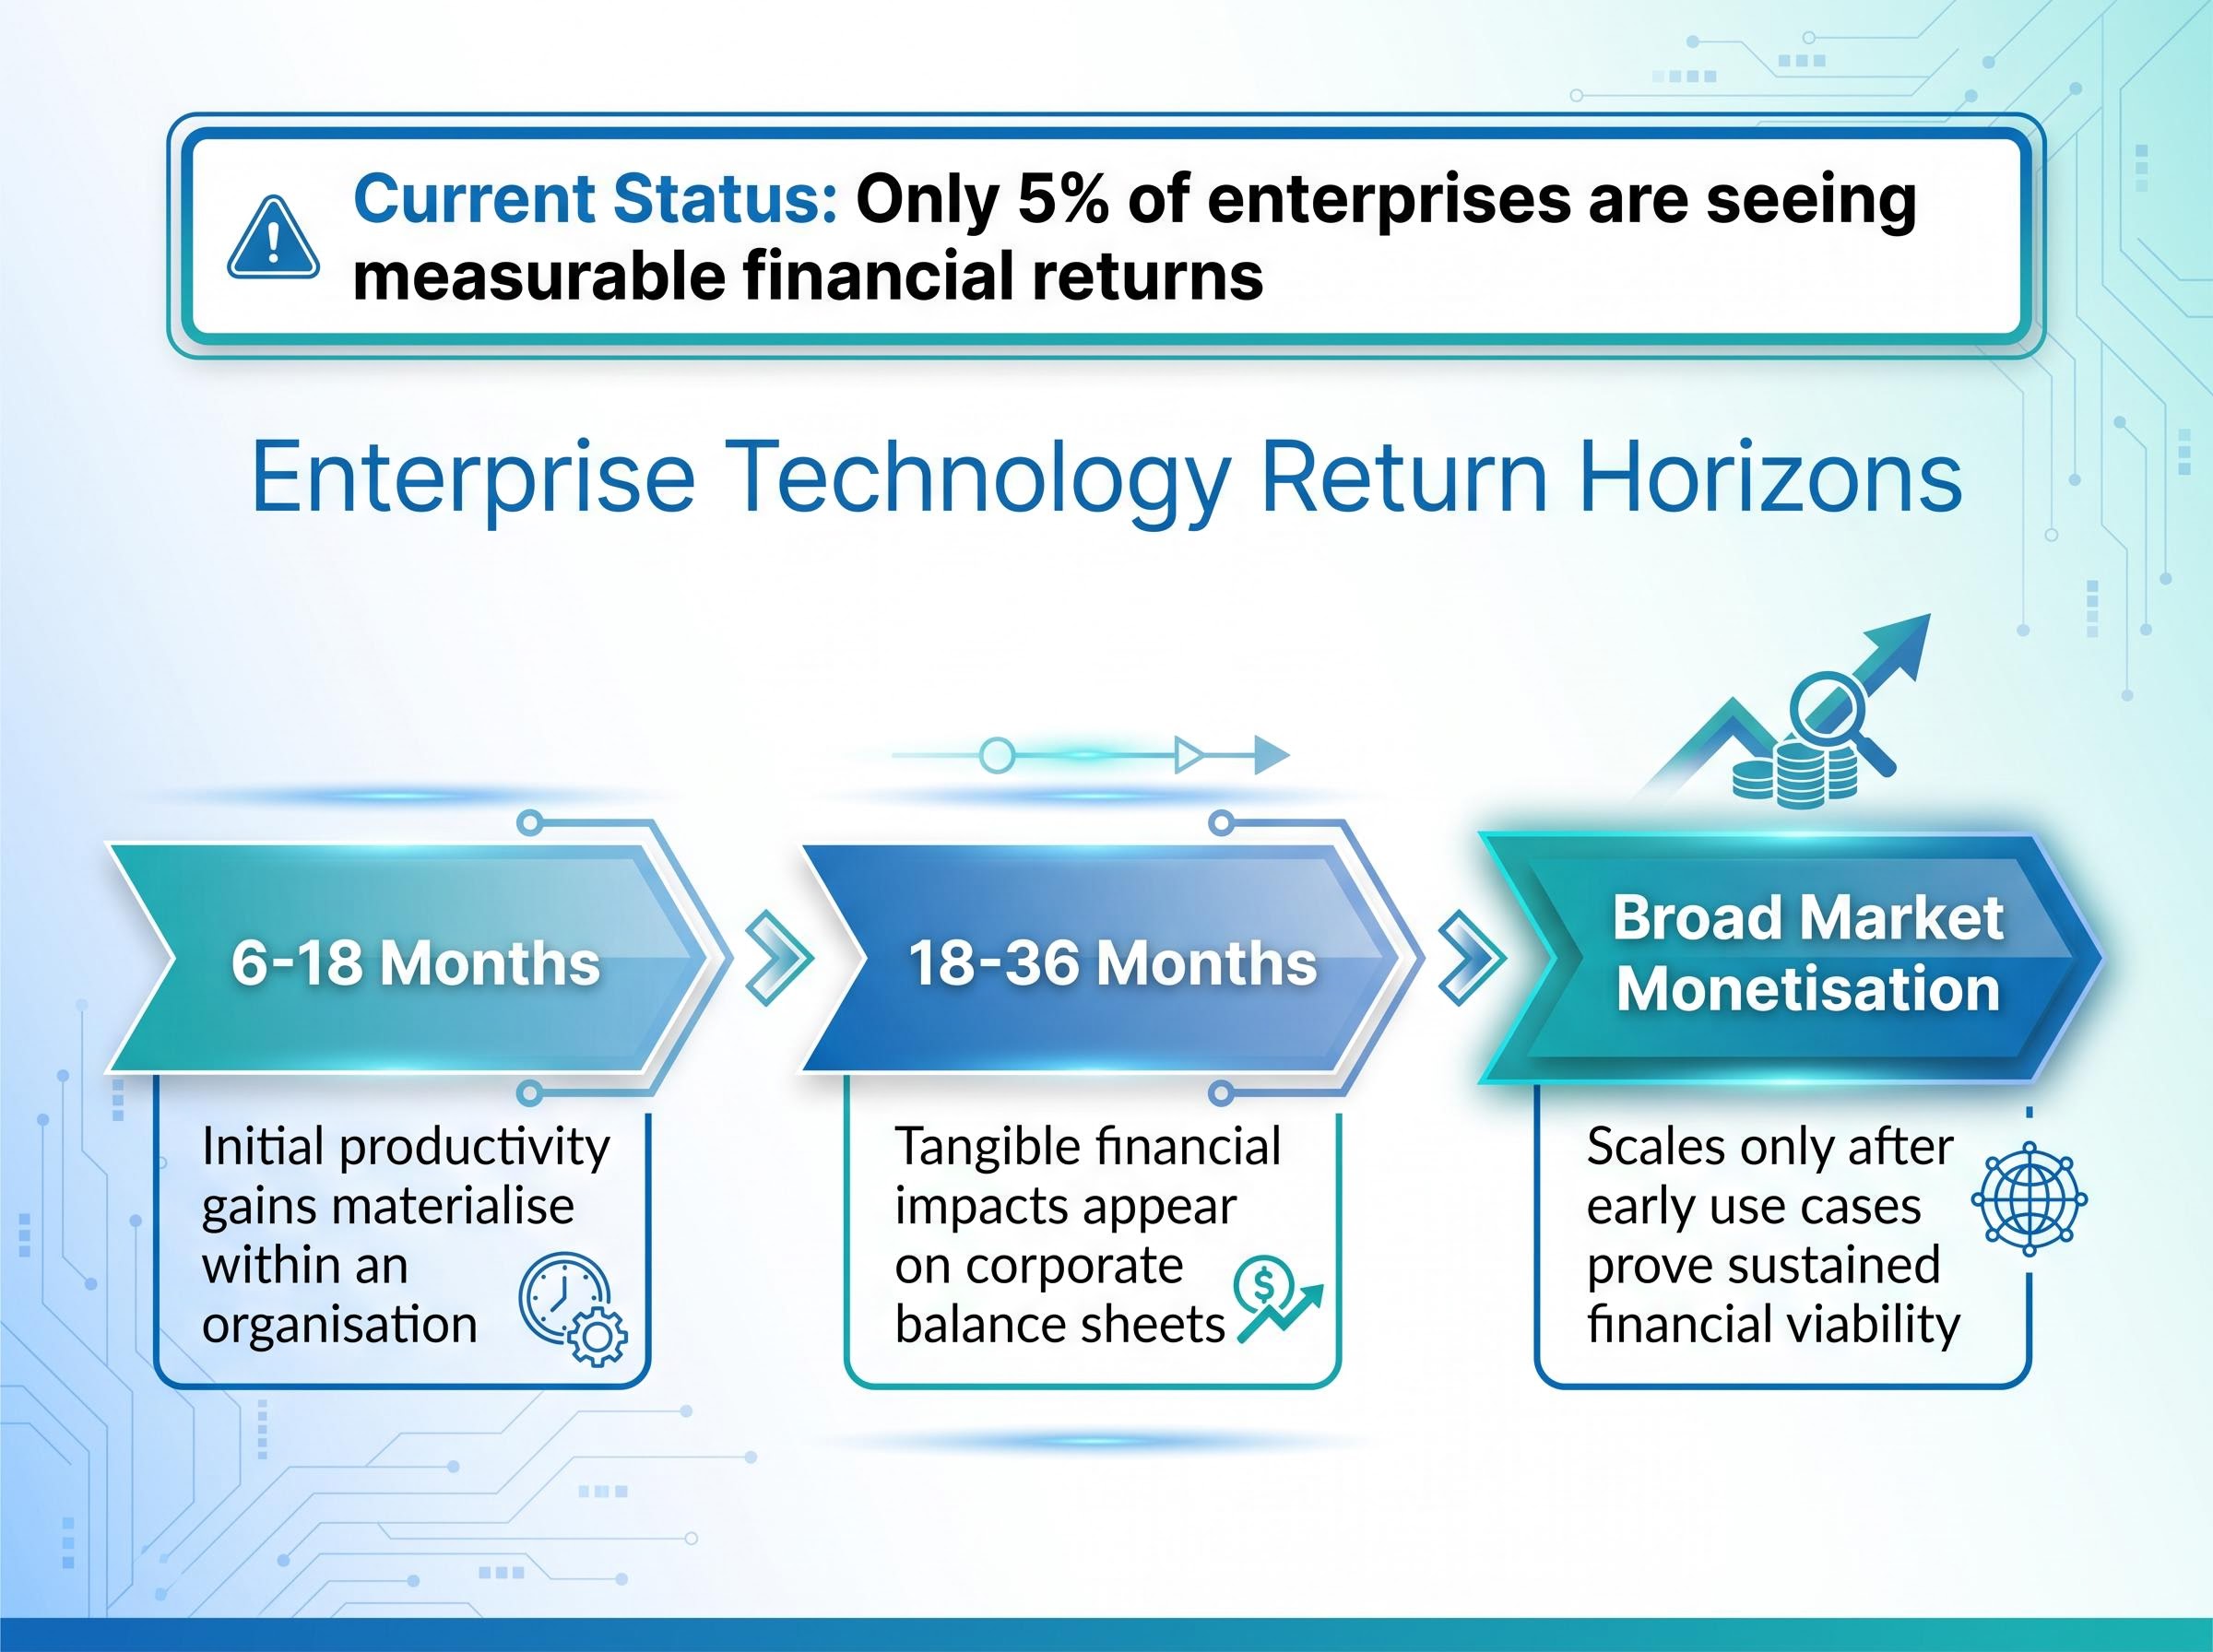
Conversely, Alphabet remains a positive standout in the enterprise space, maintaining Google Cloud margins around 27%. This divergence indicates that enterprise integrations may succeed where consumer subscriptions falter, but the timeline for profitability remains extended. Currently, only 5% of enterprises are seeing measurable financial returns on this technology.
Aligning portfolio holding periods with the reality of delayed enterprise adoption cycles is required for commercial investors. The return on investment horizon follows distinct phases.
For readers wanting to understand the broader implications of delayed returns, our detailed coverage of tech bubble risks examines the historical precedents of infrastructure hoarding and outlines stress-testing methodologies for portfolios heavily concentrated in hardware equities.
While software creators face monetisation anxiety, the immediate capital flows are yielding undeniable commercial results within the physical infrastructure supply chain. New data centres require immense power generation, shifting the focus to alternative energy partners that provide necessary operational utilities. Recent corporate outperformance in the alternative energy sector is a direct result of technology conglomerate demands.
Bloom Energy has emerged as a clear beneficiary of this physical build-out, securing validated partnerships to support escalating power needs. The most secure commercial investments right now might be the utility and power partners rather than the software creators themselves. Identifying these tangible supply chain beneficiaries gives commercial investors immediate, actionable alternatives to holding highly volatile software equities.
Technology leaders are actively committing billions to hyperscaler off-grid power solutions, establishing a bypass blueprint that provides immediate baseload generation outside the severely constrained legacy electrical grid.
The sudden growth figures reported by alternative power providers demonstrate the rapid capital transfer occurring in real time.
Bloom Energy reported first-quarter 2026 revenue of $751.1 million, representing a 130% year-over-year increase. Product revenue for the company accounted for $653.3 million, up 208% compared to the prior year. The company raised full-year 2026 revenue expectations following a validated partnership with Oracle. Shares of Bloom Energy appreciated in post-market trading following the disclosures.
The immediate market winners in the current technology cycle are the physical infrastructure and alternative power providers, rather than the software platforms awaiting consumer adoption. Patience will be strictly required for companies deploying record levels of capital into cloud architectures. The margin of safety for technology investors no longer rests solely on user growth metrics, but on cash flow resilience and physical supply chain positioning.
As the earnings calls proceed, investors should evaluate management teams based on their ability to defend balance sheets while funding necessary structural expansion. Companies that can maintain positive free cash flow during this capital expenditure cycle offer a far safer profile than those entirely dependent on future software monetisation.
This article is for informational purposes only and should not be considered financial advice. Investors should conduct their own research and consult with financial professionals before making investment decisions. Past performance does not guarantee future results. Financial projections are subject to market conditions and various risk factors.
The capital expenditure versus monetization gap refers to the period where technology companies spend massive amounts on infrastructure like data centers and AI chips, but have not yet seen proportional commercial returns or revenue growth from these investments.
Major technology players like Amazon, Alphabet, Meta, and Microsoft are collectively projected to spend between $610 billion and $700 billion on infrastructure in the 2026 fiscal year.
The immediate beneficiaries are companies in the physical infrastructure supply chain and alternative energy sectors, which provide the necessary power generation and utilities for new data centers. Bloom Energy is cited as an example.
Over $1 trillion was erased from major technology market values due to investor anxiety regarding the rapid pace of infrastructure spending outpacing near-term monetization capabilities, particularly concerning AI investments.
Initial productivity gains generally take 6-18 months to appear, tangible financial impacts require 18-36 months, and broad market monetization scales only after early enterprise use cases prove financially viable.