The ASX 200 closed at 8,976.8 on 31 July 2026, up just 9.1 points (+0.10%) on the session. That flat headline number buried one of the most directionally charged trading days of the month.
The index wrapped up its strongest month since February, posting a gain of roughly +2.3% through four turbulent weeks. But the final session’s story was not about the monthly scorecard. It was about a single extraordinary event in Seoul that rewired capital flows across the Australian market in a matter of hours.
The session’s real narrative sits in the gap between sectors: materials and gold surging while healthcare posted its worst day of the month. Here is what the data tells you about where money moved and why, what drove the rotation, and what the resistance level sitting just above the index at month’s end means for the August setup.
How a Seoul market shock reset global risk appetite
South Korea’s KOSPI Composite Index recorded a near-18% intraday gain on 31 July 2026. The move came after the South Korean government stepped in with stabilisation measures to halt a steep market decline. This was not a recovery driven by improving fundamentals. It was a policy-driven rescue that triggered a mechanical chain reaction across global equities.
The policy intervention that lifted the KOSPI on 31 July 2026 came after weeks of severe volatility rooted in KOSPI concentration risk, where Samsung Electronics and SK Hynix together represent roughly 50% of total index capitalisation, a structural feature that amplified both the June crash and the scale of the subsequent government response.
The transmission pathway was direct. The policy intervention propelled the KOSPI higher, which in turn compressed benchmark bond yields globally, drove copper and gold prices upward, and directed capital into higher-beta equities. US equity futures confirmed the read: S&P 500 futures rose +0.29% and Nasdaq futures climbed +0.84% ahead of the Wall Street open. The Australian dollar ticked up to 0.7032 (+0.04%).
The iShares MSCI South Korea ETF (ASX: IKO) surged +15.7% to $237.72 on the day, with no company-specific news. That single move tells you exactly how directly the KOSPI’s intervention transmitted to ASX-listed risk assets.
The government-intervention origin matters. A risk-on wave built on policy action rather than economic improvement lacks the fundamental underpinning that makes rallies self-sustaining. Every sector move that followed on the ASX carries that caveat.
When big ASX news breaks, our subscribers know first
Materials and copper led the charge as commodity prices surged
Copper set the pace before the ASX opened. LME benchmark cash copper had added +1.2% in the prior session, then COMEX copper futures extended the run with a further +0.3% gain to US$6.492/lb in Asian trade, having already surged +2.6% overnight. Copper’s standing as a critical input for artificial intelligence infrastructure added a structural dimension to what might otherwise have read as a straightforward cyclical bid.
Prior COMEX copper records in May 2026 had already exposed the tension between structurally tight long-run supply and tariff-inflated short-term inventories sitting at 20-year highs, a context that matters when assessing whether the further COMEX gains on 31 July reflect genuine demand or a continuation of the same positioning dynamic.
The ASX Materials sub-index (XMJ) climbed +1.43% to 23,187.9. The large-cap majors led the initial move:
- BHP: +2.0%
- Rio Tinto: +1.3%
Higher-beta copper and base-metal names pushed further:
- Sandfire Resources (SFR): +2.4%
- Nickel Industries (NIC): +3.2%
- Iluka Resources (ILU): +4.9%
- WA1 Resources (WA1): +4.7%
Capstone Copper (CSC) was the standout. The stock rose +7.1% to $13.69 after reporting Q2 results that included copper production of 51,759 tonnes, C1 cash costs of US$2.82/lb, and a record Adjusted EBITDA of US$354.0 million. A record earnings result arriving on a day of surging copper prices is the kind of confluence that concentrates institutional attention on a single name.
| Stock | Move | Close |
|---|---|---|
| BHP | +2.0% | — |
| Rio Tinto | +1.3% | — |
| Capstone Copper (CSC) | +7.1% | $13.69 |
| Iluka Resources (ILU) | +4.9% | — |
| Fortescue (FMG) | -1.9% | — |
The exception was Fortescue (FMG), which fell -1.9% after disclosing a US$525 million after-tax non-cash impairment on its Iron Bridge magnetite project. In a sector where everything else moved higher, FMG’s impairment stood out as the one company-specific story that broke the pattern.
Gold and uranium stocks surged on fund flows and falling yields
The ASX Gold Sub-Index (XGD) rose +1.6%, making it the best-performing sector on the day. Two tailwinds combined to produce the move: easing bond yields reduced the cost of holding non-yielding gold, while a pullback in crude oil prices cut diesel input costs and lifted producer margins at the same time.
The gains were broad-based across producers of varying size.
| Stock | Move | Close |
|---|---|---|
| Kingsgate Consolidated (KCN) | +7.7% | $4.04 |
| Black Cat Syndicate (BC8) | +5.3% | — |
| West African Resources (WAF) | +5.2% | — |
| Predictive Discovery (PDI) | +4.7% | — |
Uranium told a different story with the same result. ASX-listed uranium stocks surged in lockstep, but nothing in uranium’s underlying supply or demand picture had changed. The gains were entirely a product of global capital movement.
The Sprott Uranium Miners ETF (NYSE: URNM) gained +4.9% overnight on 30 July, and ASX uranium names followed directly.
| Stock | Move | Close |
|---|---|---|
| Deep Yellow (DYL) | +8.6% | $1.32 |
| Bannerman Energy (BMN) | +7.7% | — |
| Paladin Energy (PDN) | +7.0% | $9.42 |
| NexGen Energy (NXG) | +5.4% | $13.27 |
| Boss Energy (BOE) | +3.0% | — |
Gold and uranium often move together on risk-on days when yield dynamics are shifting, but their mechanics diverged on 31 July. Gold’s gains had a margin improvement story underneath them. Uranium’s gains were entirely sentiment-driven, which means you should treat the uranium cluster’s move as a read on fund positioning rather than a signal about the underlying market for the commodity itself.
Defensives unwound as healthcare bore the brunt of the rotation
The risk-on wave that lifted resources had a direct inverse: capital exited the defensive sectors that had served as safe havens during July’s earlier turbulence. This was not a collection of separate bad-news stories. It was a single rotation, and the losses in healthcare, staples, and financials were the mechanical consequence of the same flows that lifted materials and gold.
Institutional capital rotation out of defensives and into globally exposed base metals and technology has been a recurring structural theme across ASX sessions in 2026, with the June iteration seeing the Materials sector lift while banks and consumer staples absorbed the exit flows, a pattern that July’s final session replicated almost exactly.
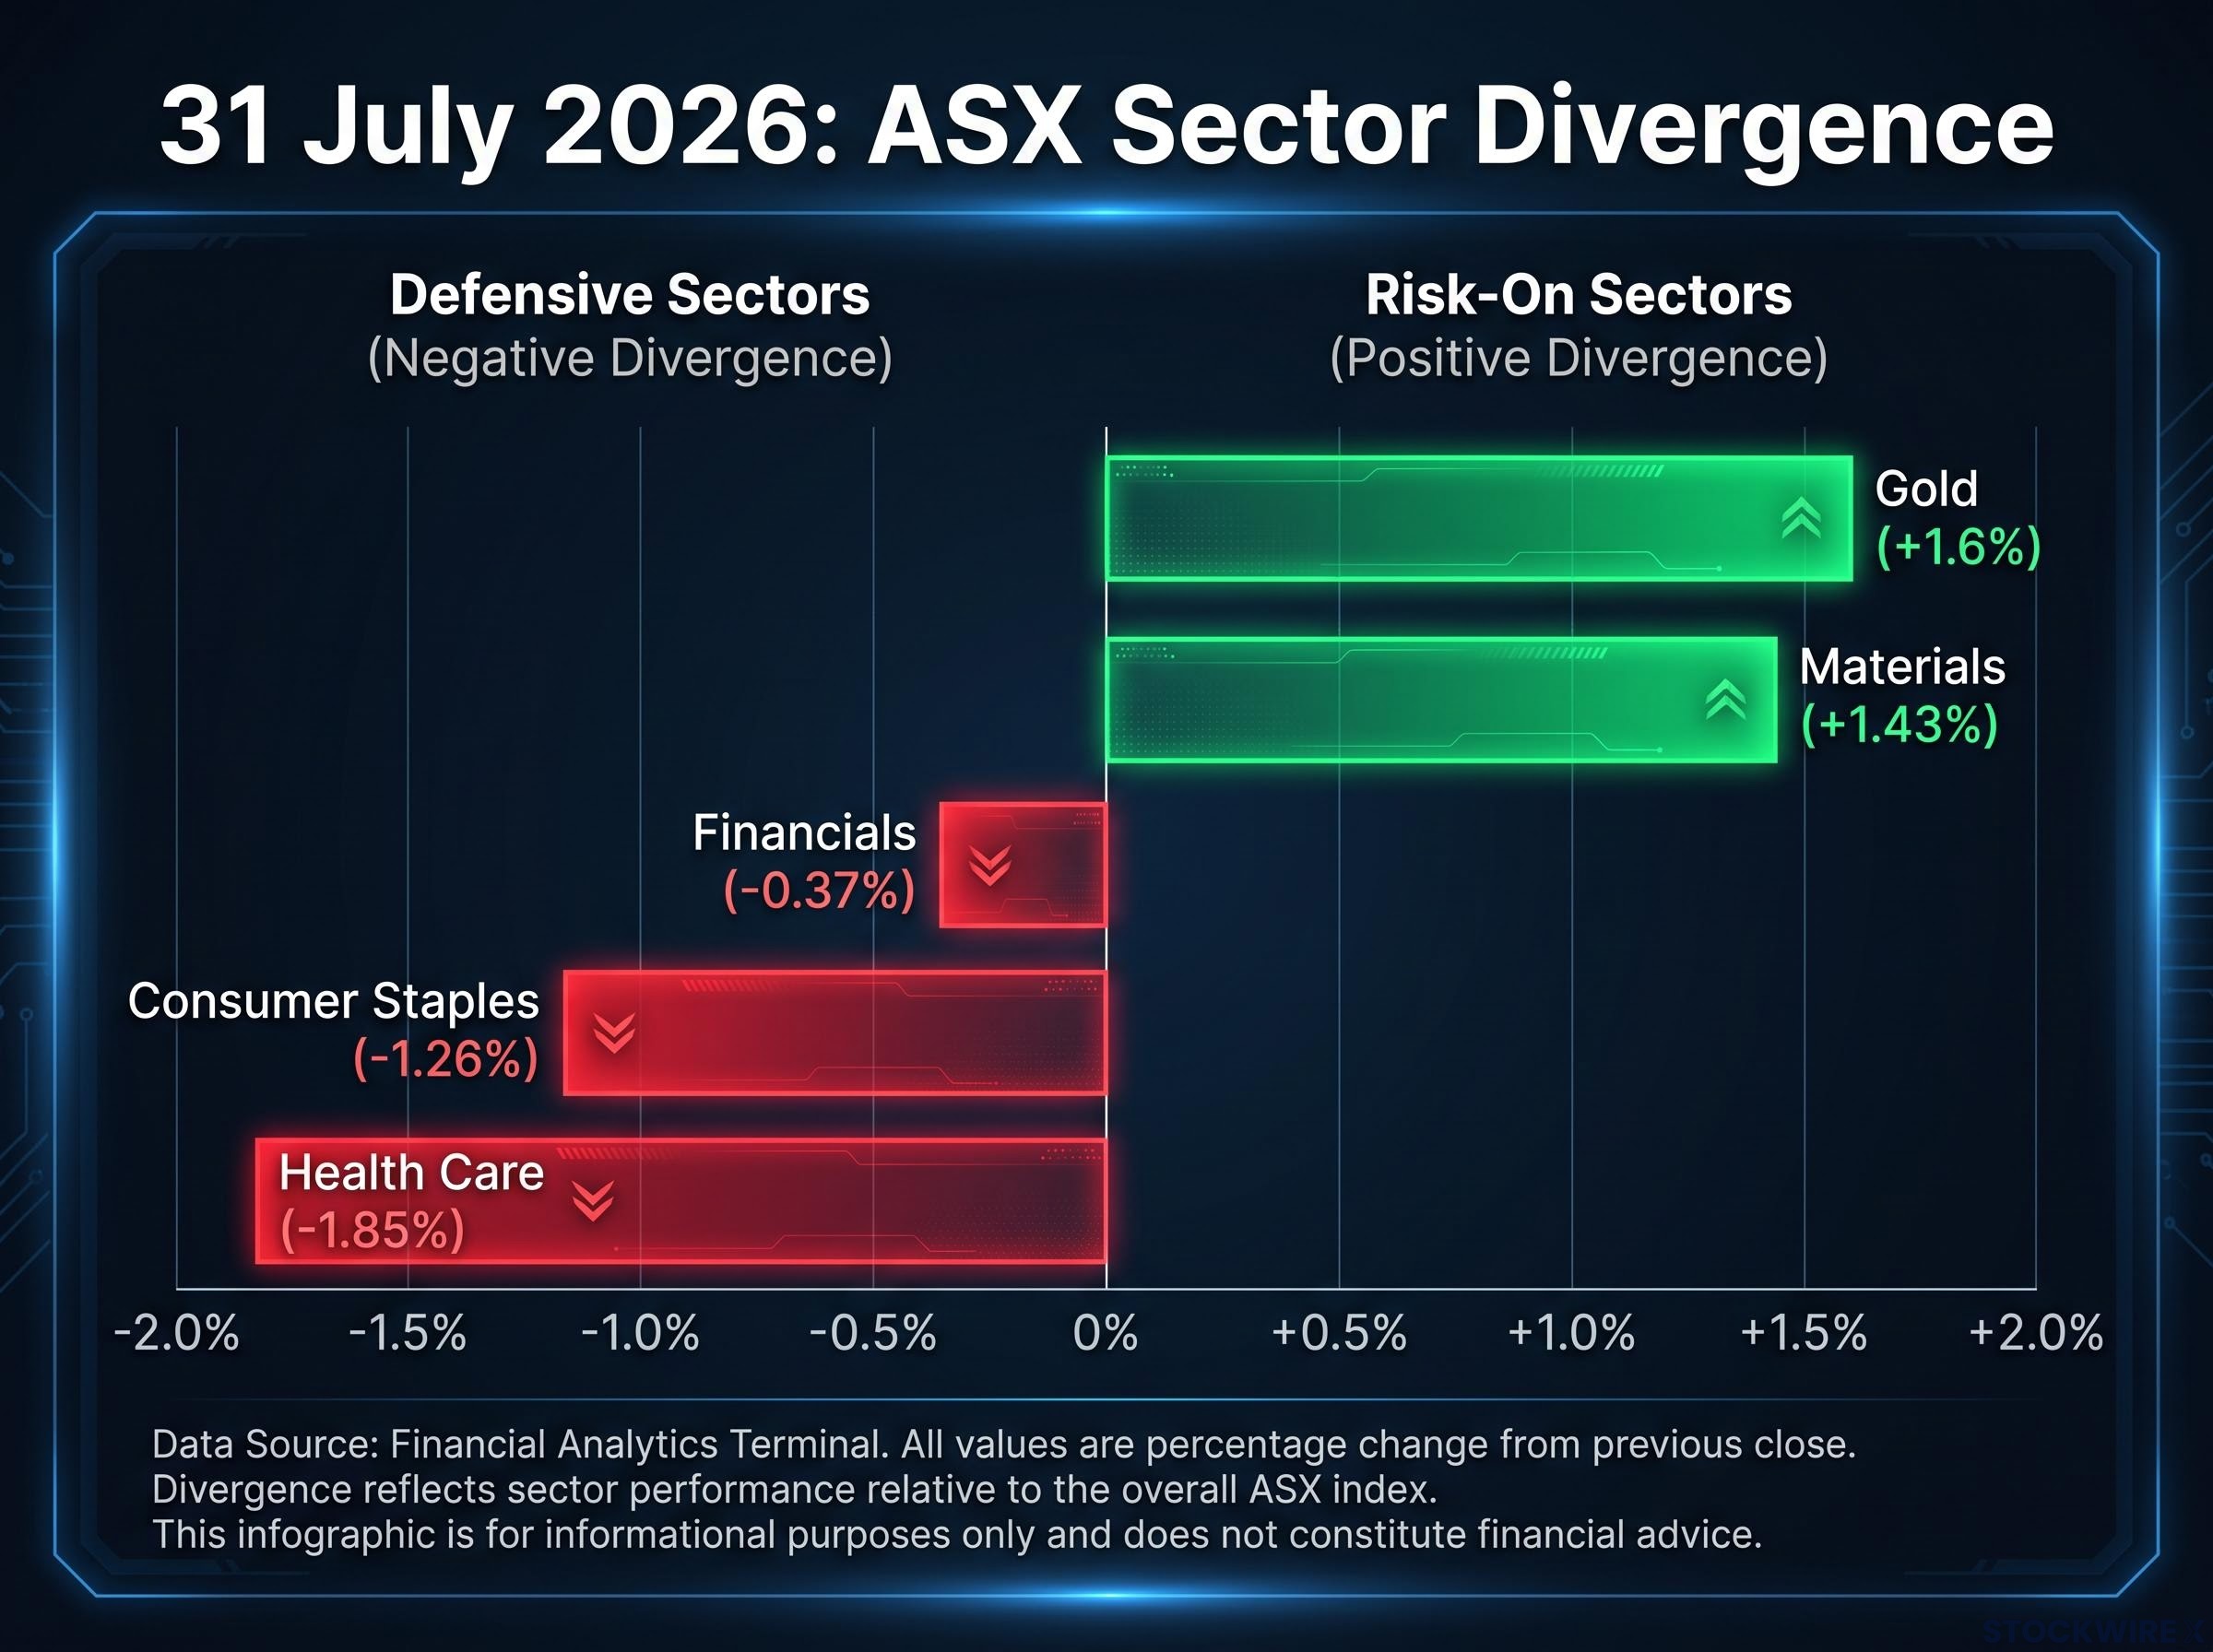
Healthcare took the hardest hit. The ASX Health Care sub-index (XHJ) fell -1.85% to 26,634.0, the worst sector performance of the session. CSL dropped -3.8% to $123.06, amplified by broker action that compounded the rotation pressure:
- Macquarie named CSL as the healthcare stock it most preferred to avoid, retaining a Neutral rating and reducing its price target from $114.00 to $108.00
- Bell Potter retained a Hold rating and raised its price target to $120.00, but was unable to offset the negative tone set by the Macquarie note
Broker sentiment can amplify a rotation sell-off in ways that exceed the fundamental justification. If you hold defensive healthcare names, the distinction that matters is between position-unwinding pressure and a genuine change in a company’s operational outlook. On 31 July, the evidence pointed firmly toward the former.
| Sector | Sub-index Move | Notable Stock Movers |
|---|---|---|
| Healthcare (XHJ) | -1.85% | CSL -3.8%, Sonic Healthcare -2.8%, Cochlear -1.8%, ResMed -1.5% |
| Consumer Staples (XSJ) | -1.26% | A2 Milk -2.5%, Metcash -1.9%, Woolworths -1.7% |
| Financials (XFJ) | -0.37% | QBE Insurance -2.5% |
Consumer staples saw profit-taking across stocks that had absorbed defensive capital during the turbulent weeks prior, with A2 Milk falling -2.5% to $6.89. Financials drifted lower by -0.37%, a softer version of the same dynamic without the broker-amplified severity that hit healthcare.
What the index breadth and technical structure reveal about July’s close
The headline ASX 200 gain of +0.10% suggested a quiet session. The breadth data told a completely different story.
The S&P/ASX 300 recorded 165 advancers versus 117 decliners, a healthy risk-on skew. More telling was the performance gap across benchmarks. The Small Ordinaries gained +1.40%, and the Emerging Companies index surged +2.47%, the day’s strongest benchmark. The All Tech index added +0.46%.
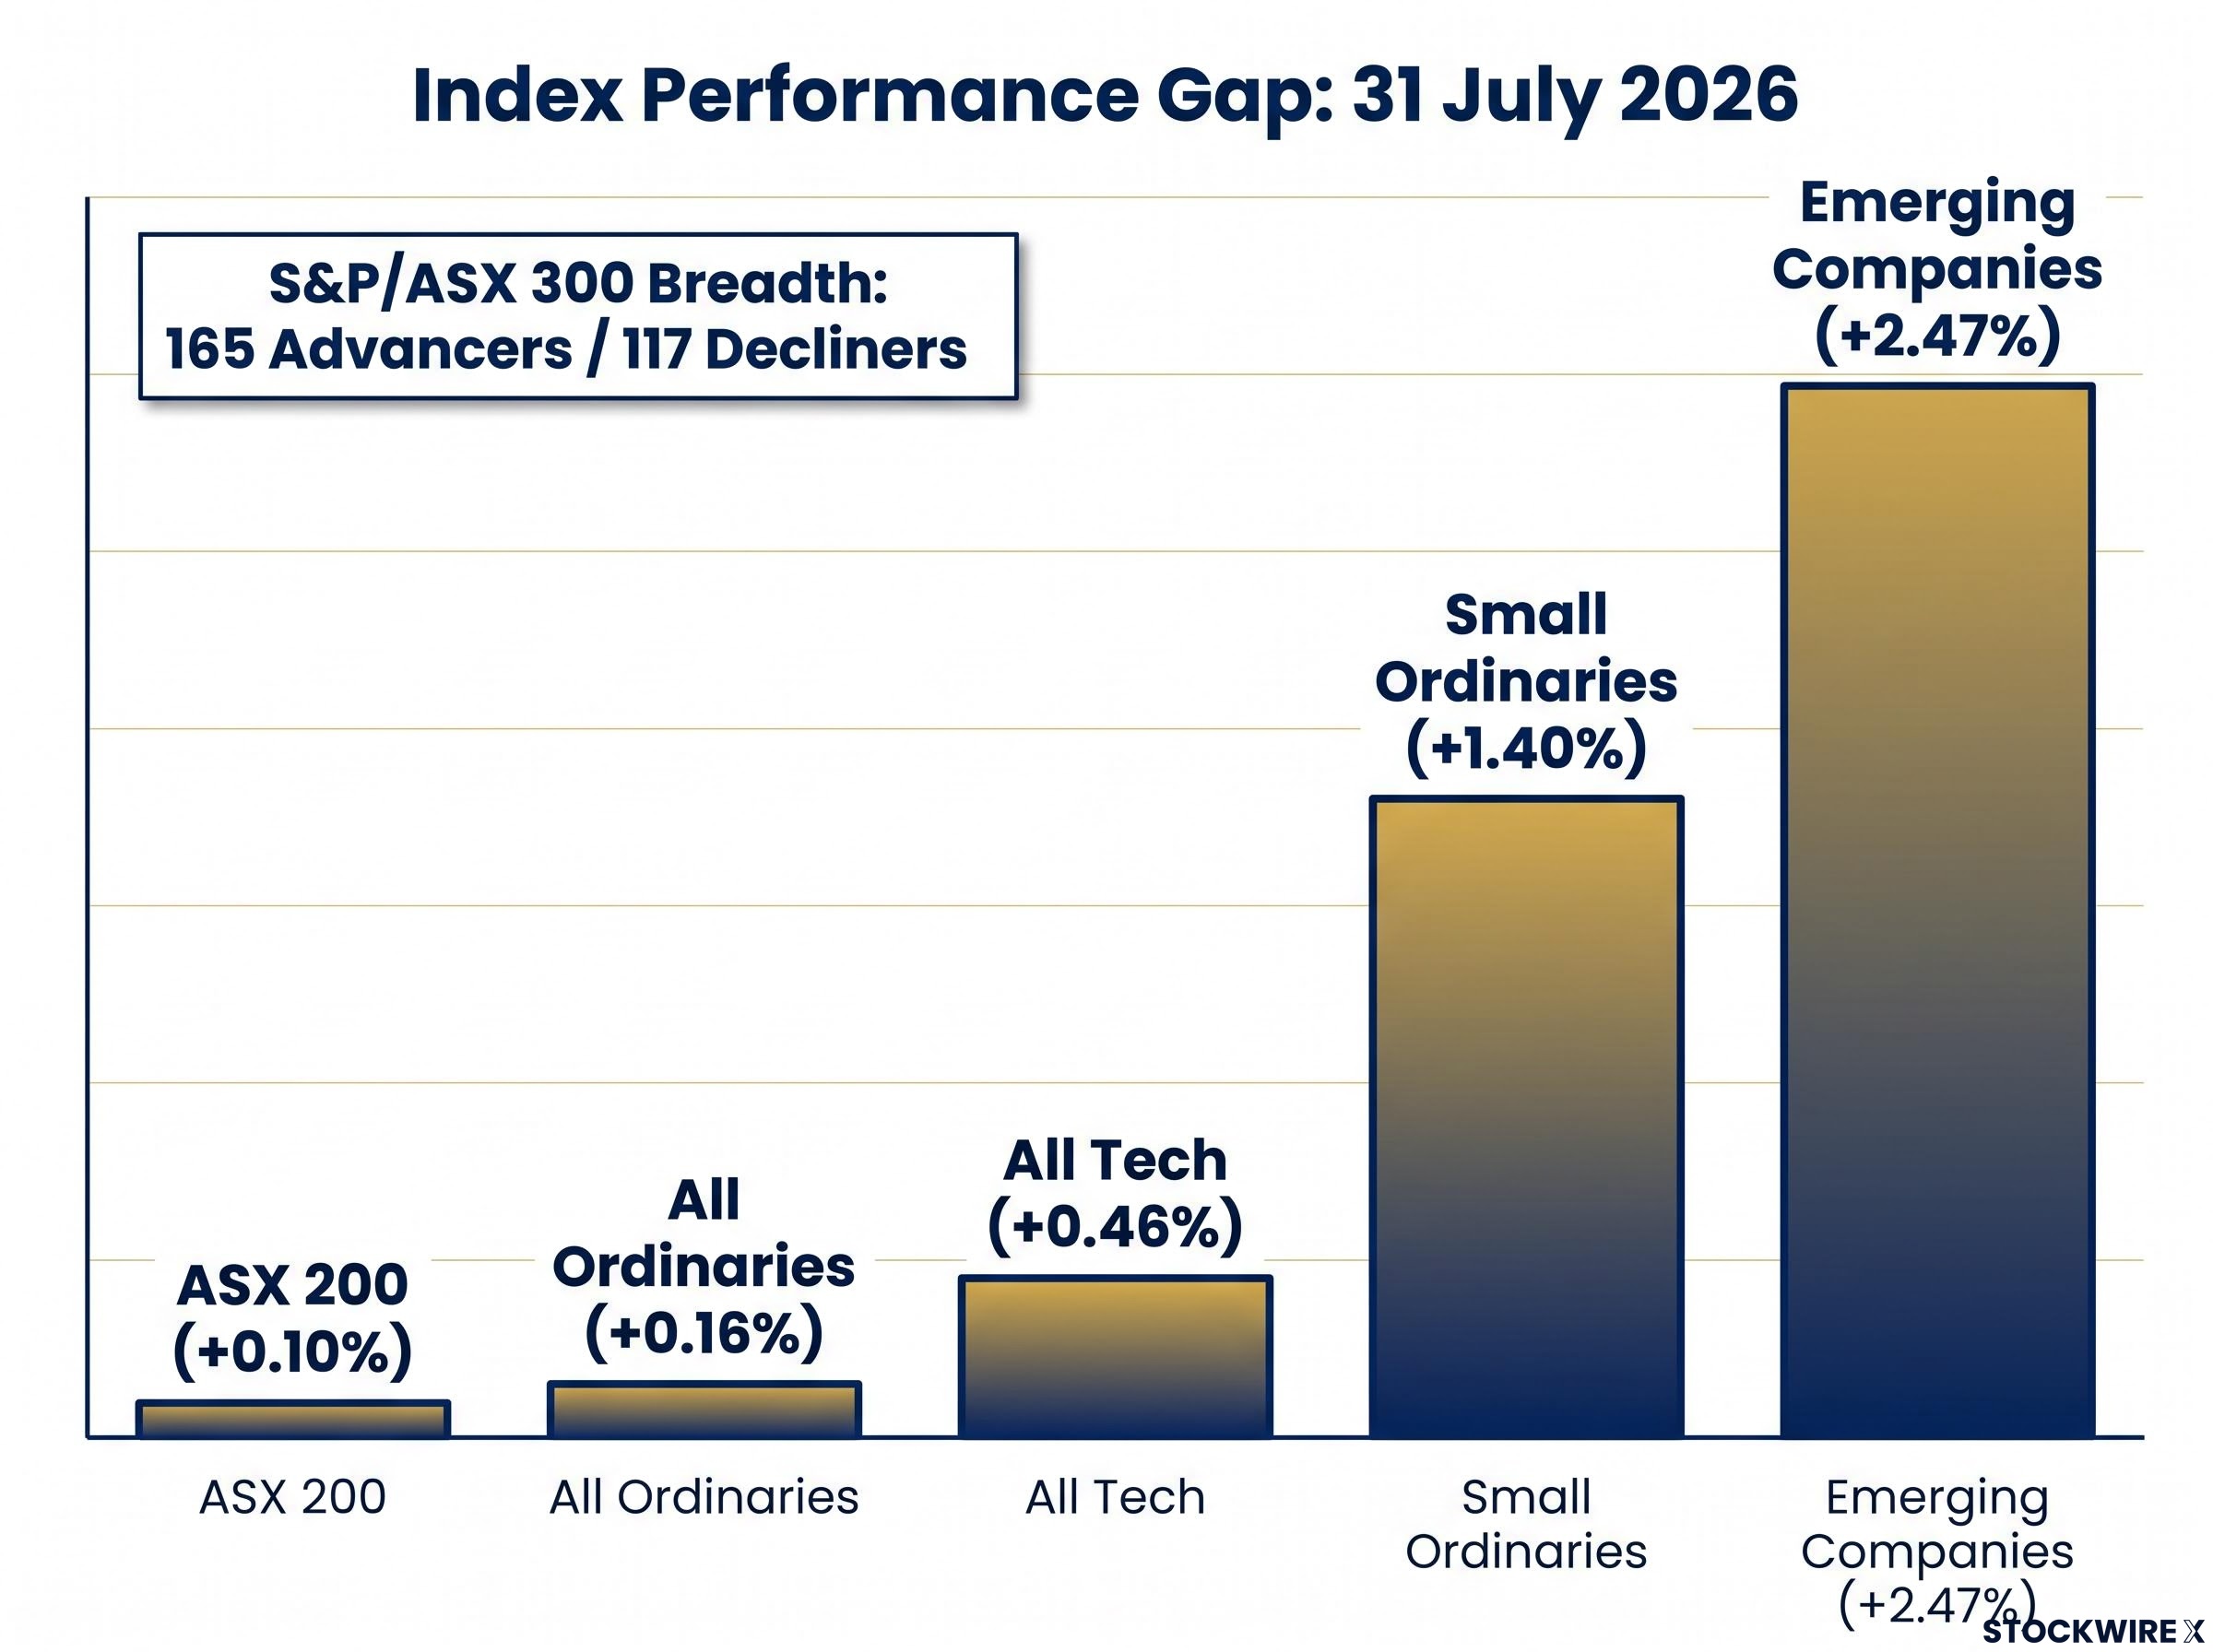
| Index | Close | Daily Change |
|---|---|---|
| ASX 200 (XJO) | 8,976.8 | +0.10% |
| All Ordinaries | 9,137.0 | +0.16% |
| Small Ordinaries | 3,314.6 | +1.40% |
| Emerging Companies | 2,778.9 | +2.47% |
| All Tech | 2,939.2 | +0.46% |
That gap between the ASX 200 and Emerging Companies is the clearest signal that 31 July was a genuine risk-on session rather than a large-cap defensive drift. Investors watching the headline figure alone would have formed a very incomplete picture of the day.
For the week, the ASX 200 gained 204 points (+2.3%), with the index recording a monthly gain of approximately +2.3% in July, a result it had not matched since February 2026.
Technical levels to watch heading into August
Despite the strong monthly finish, the index ended July below the resistance zone that has repeatedly capped rallies. The 8,984-9,022 supply zone (the price region where sellers have consistently emerged) has rejected the index on multiple approaches through July. Market breadth, which measures the number of stocks advancing versus declining, is the measure of how broad a move is across the market.
The two major mid-week sessions each produced candles with a black body and an extended upper shadow, a pattern that points to sellers reasserting control whenever prices pushed through the 9,000 level. Put simply, buying pressure took the index above 9,000 intraday on both occasions, yet supply consistently forced it back below that threshold before the close.
At this point in the cycle, the market sits in an equilibrium state, with neither buyers nor sellers holding a decisive edge, leaving the index susceptible to false breaks in either direction. Carl Capolingua’s model portfolio was positioned at roughly 67% of maximum allowable capital allocation at month’s end, a stance that signals constructiveness without full commitment.
The support zone sits at 8,656-8,708, the level that held during July’s intraweek trough. Understanding the resistance zone sitting just above the month’s close tells you why the index could not convert strong monthly gains into a break above the psychologically important 9,000 level.
The 8,656-8,708 support band was established as the critical floor during July’s mid-month trough, with prior analysis showing that a sustained break below it on rising volume would confirm internal fragility and trigger a potential retest of the 8,500 range floor, making it the downside anchor for any August scenario where the resistance zone above holds.
Whether August confirms or fades the risk-on case
July’s final session leaves two questions unresolved, and the early August answer to each will determine whether the month’s momentum continues or reverses.
- The resistance test. The ASX 200 needs a decisive close above 9,022 on broad, resource-led volume. That would confirm July’s risk-on tilt was the beginning of a structural move rather than a month-end positioning event. Without that break, the 8,984-9,022 zone remains overhead supply and the index stays range-bound.
- The KOSPI follow-through. South Korea’s near-18% surge was government-intervention-driven. If the KOSPI stabilisation proves short-lived or fails to receive economic confirmation, global risk appetite could retreat and the defensive rotation that characterised much of July would likely reassert itself. The breadth tilt toward small and mid caps would need to be sustained to support a bullish reading.
The one technical signal to watch is whether the index posts a decisive close above 9,022 on broad participation. That is the confirmation that separates a genuine shift from a month-end anomaly.
This article is for informational purposes only and should not be considered financial advice. Investors should conduct their own research and consult with financial professionals before making investment decisions.
Past performance does not guarantee future results. Technical levels and forward-looking statements are subject to change based on market developments.
—