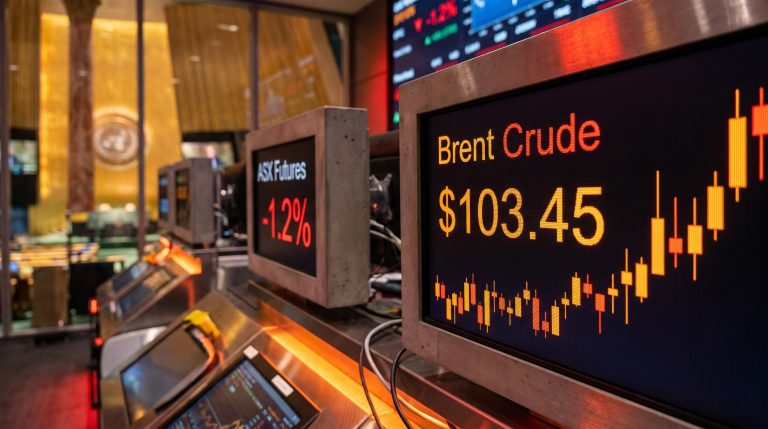
US Treasury yields have broken above levels not seen since 2007, with the 30-year bond touching 5.444% and the 10-year note clearing 5.148%, erasing a two-decade assumption that government borrowing costs would stay comfortably low.
The number that matters is 5%. On long-dated Treasuries, that is not just a round figure. It is the point at which risk-free government debt becomes a genuine rival to stocks, and where mortgages, credit cards, and corporate loans get materially more expensive. The whole move unfolded across two sessions, 23-24 September 2026, with the single-day jump on 23 September the largest in nearly 18 months.
Here is what the data actually shows: what drove the spike, what the Treasury market’s own demand signal is telling investors, and how the ripple effects are landing on stocks, crypto, and everyday borrowing costs right now.
What drove Treasury yields to their highest level since 2007
The spark came from the economy running hotter than almost anyone expected.
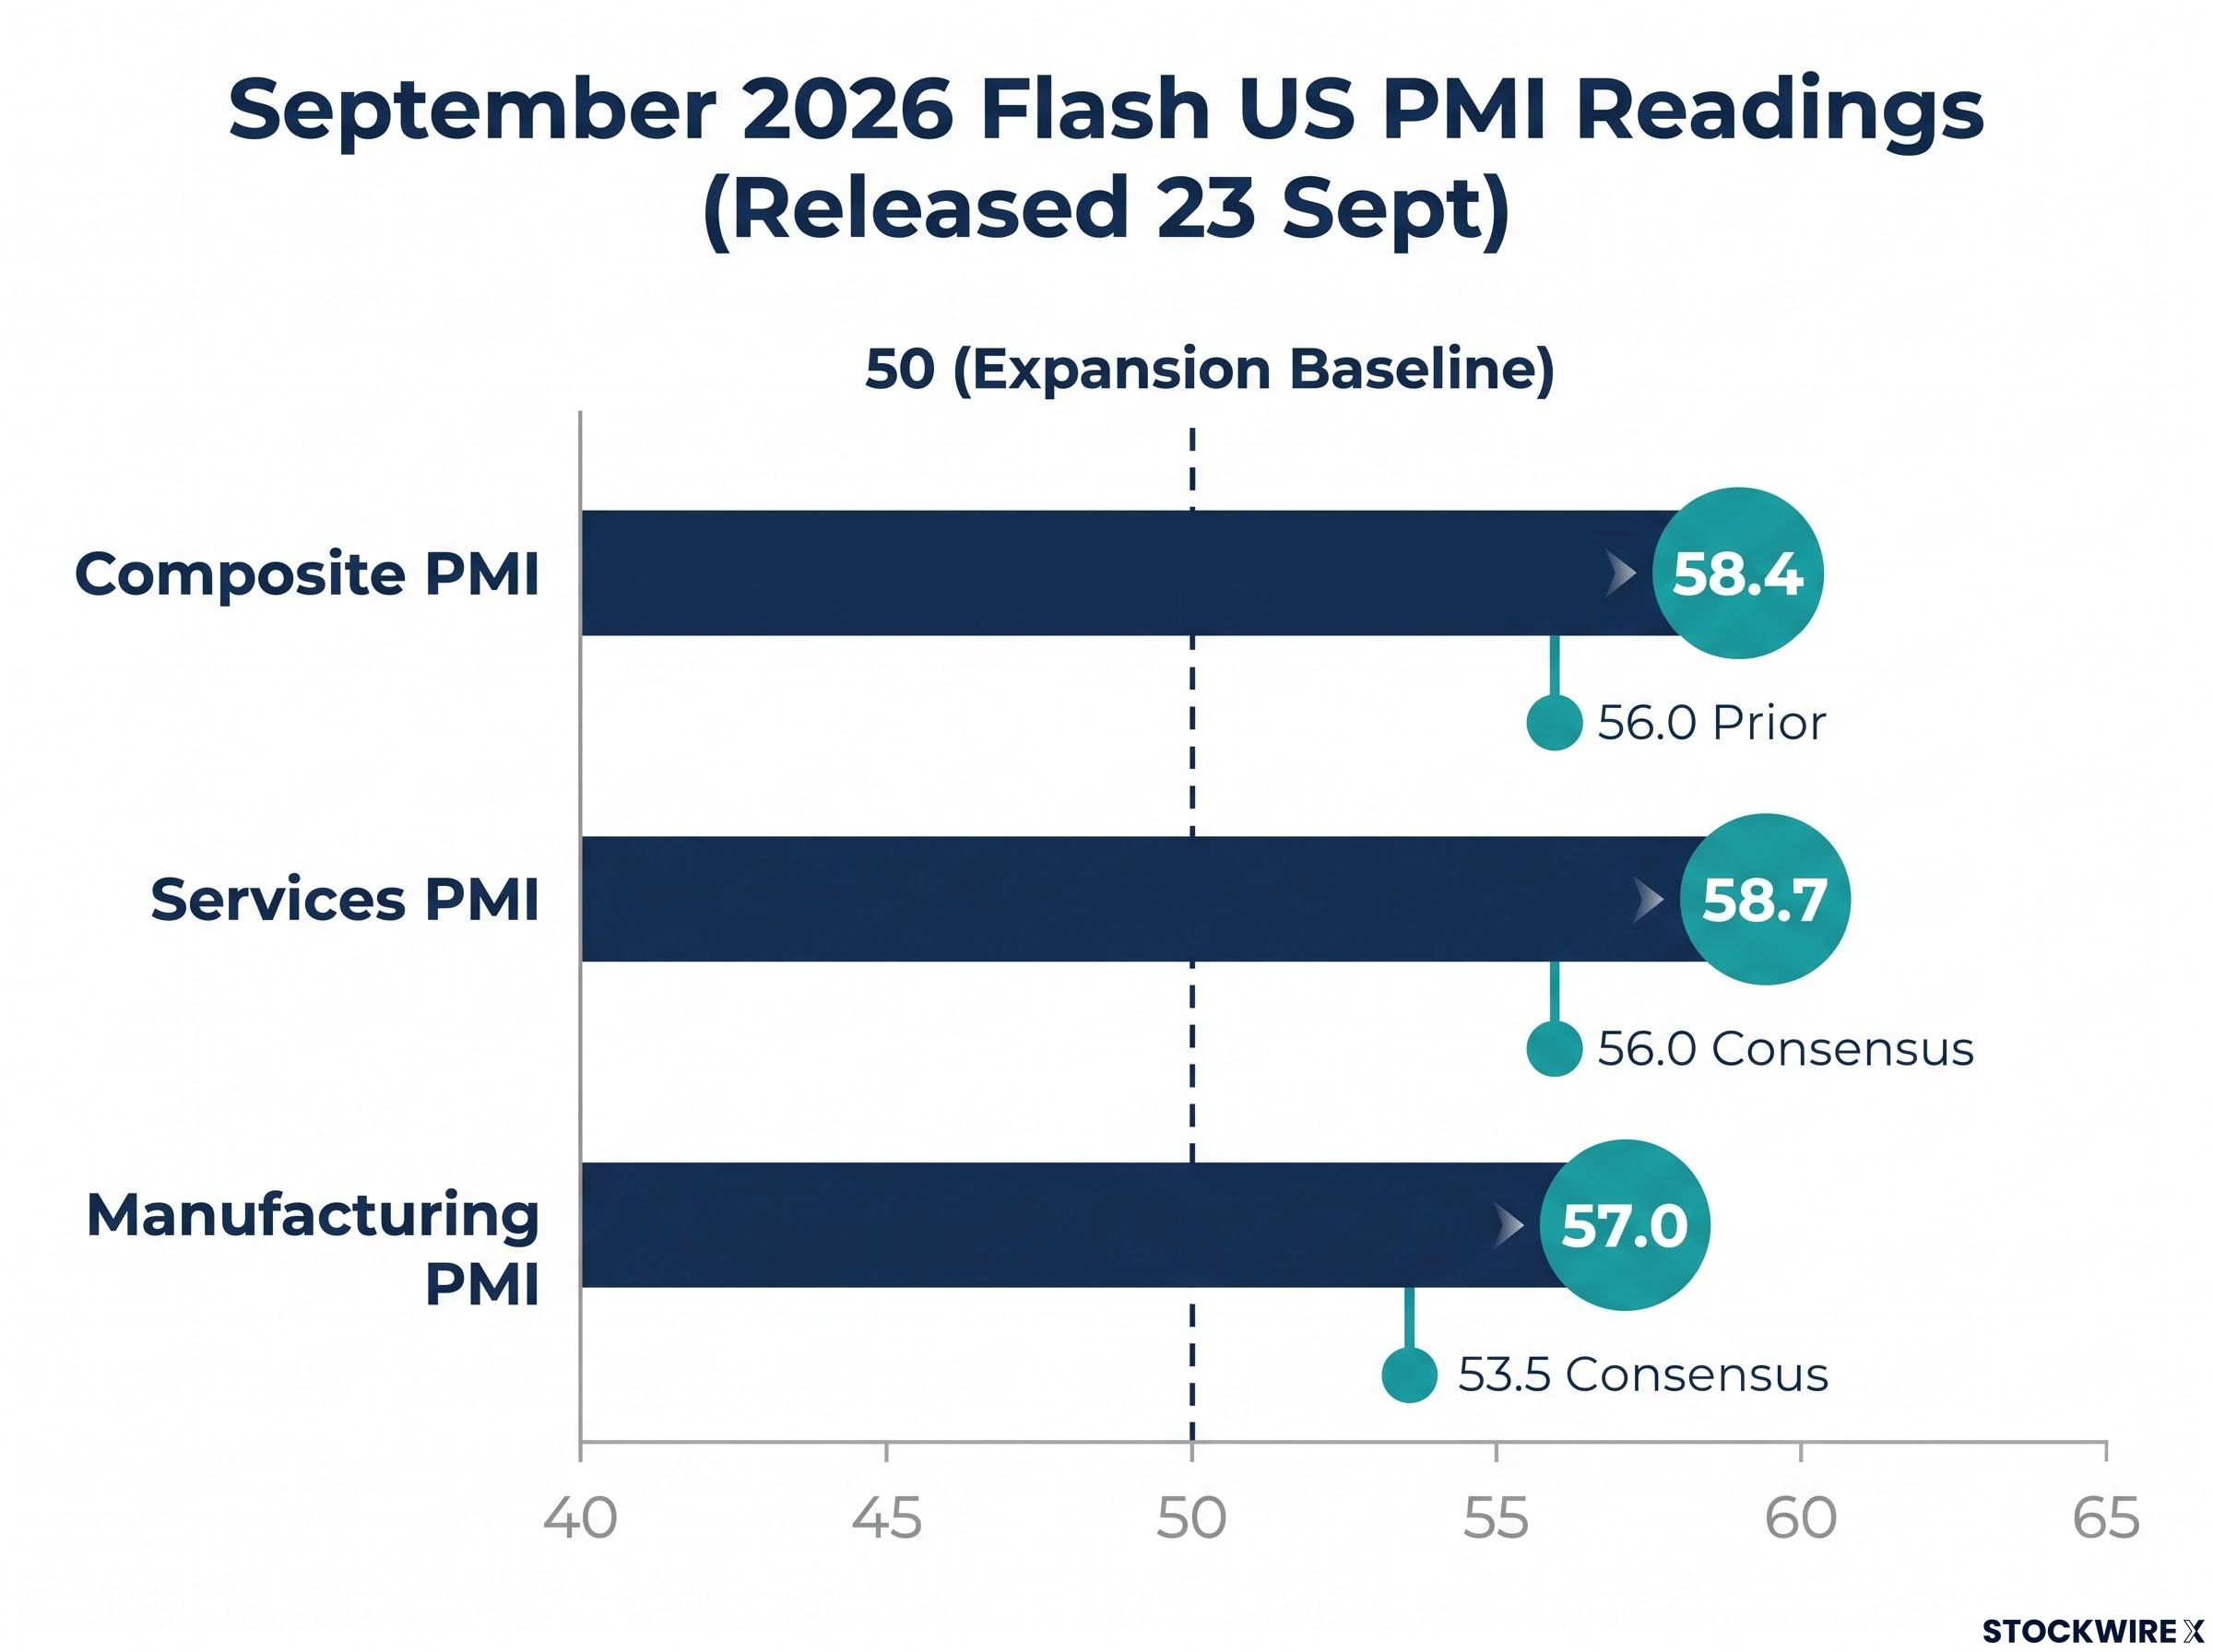
Flash S&P Global US Purchasing Managers’ Index readings for September 2026, released on 23 September, showed private-sector activity accelerating across the board. A PMI is a survey-based gauge of business activity where any reading above 50 signals expansion, and September’s numbers cleared that bar with room to spare.
The S&P Global PMI flash readings for September 2026 recorded a composite output index of 58.4, the fastest private-sector expansion since July 2021, with services and manufacturing both clearing consensus estimates by a wide margin.
- Composite PMI: 58.4 (September flash), up from 56.0 the prior month, described as the strongest private-sector expansion since mid-2021 (per S&P Global data, an unverified characterisation)
- Services PMI: 58.7, well above the 56.0 consensus
- Manufacturing PMI: 57.0, comfortably beating a consensus near 53.5
That kind of beat tells you the Fed has cover to keep rates high. Strong activity plus rising wages and elevated energy costs is exactly the mix that keeps inflation sticky, and a central bank fighting sticky inflation does not cut rates.
The inverse relationship at the core of bond yield mechanics, where a falling price automatically produces a rising yield because the coupon payment is fixed, explains why the Treasury selloff of 23-24 September translated so directly into higher borrowing costs across mortgages and corporate debt.
Then a policymaker made it official.
Fed Governor Michael Barr indicated on 24 September 2026 that additional rate increases are likely necessary to bring inflation back to the central bank’s 2% target in a timely manner.
That comment turned a strong data print into a formal policy signal, and yields extended their climb. The mechanism behind the move is “higher for longer”: if the Fed holds the overnight rate elevated for an extended stretch, investors demand higher yields on longer-term bonds to compensate for the added uncertainty of lending over that horizon.
The market moved fast. The 10-year yield hit 5.104% during the 23 September session, rising more than 13 basis points in a single day, the largest one-session move in nearly 18 months.
For your own planning, the read is straightforward: this is not a temporary spike bolted onto a soft economy. It reflects a durable policy stance, and durable stances need to be priced into financial decisions, not waited out.
When big ASX news breaks, our subscribers know first
How a $70 billion Treasury auction sent a warning signal on demand
Strong data lit the fuse. A weak government bond auction confirmed the fire was already burning.
The US Treasury sold $70 billion of five-year notes, and buyers made clear they wanted to be paid more to show up. The clearest tell is the auction tail: the gap between the yield buyers demanded and the yield expected just before bidding closed. A large tail means investors forced the government to pay up.
| Metric | This Auction | Prior Auction | Recent Average |
|---|---|---|---|
| Auction tail (bps) | 3.1 (2nd-largest on record) | Near flat | ~0.6 |
| Bid-to-cover ratio | 2.21x (lowest since Dec 2018) | 2.371x | ~2.33x |
| Indirect bidder share (%) | 54.31 | 61.51 | ~65.2 |
The notes cleared at a high yield of 5.033%, against a when-issued yield of 5.002% immediately beforehand, producing that 3.1 basis point tail, the second-largest on record.
The bid-to-cover ratio, which measures total bids against the amount on offer, came in at 2.21x, the weakest since December 2018. And indirect bidders, a proxy for foreign and official demand, took just 54.31% of the issue, down sharply from 61.51% at the prior sale.
Every one of those statistics points the same direction: at these debt levels and this fiscal path, investors are demanding meaningfully higher compensation to lend the government money for the long haul.
What the auction result tells us about investor appetite
With indirect bidders pulling back, dealers were left to absorb a larger share than usual. Dealers are obligated to mop up whatever others do not buy, and when they end up holding excess supply, they often sell it back into the secondary market, adding fresh downward pressure on bond prices and upward pressure on yields.
The read to take here is measured. MUFG analysts, cited by FXStreet, framed the auction as confirming concerns about policy, inflation, and supply rather than creating them. Buyers still turned up; they simply demanded more. That is a market repricing, not a market retreating, and analysts caution against reading one poor sale as permanent demand destruction.
The bond market downturn outlook entering this week was already being shaped by Treasury buyback operations that tripled in scale between August and September 2026, yet long-end yields kept rising, signalling to analysts that the intervention was insufficient to contain the structural pressure building in the long end.
Stocks, crypto, and the dollar: how markets responded
The same yield signal rippled outward across every risk asset, hitting each one with a force proportional to its sensitivity to borrowing costs.
Equities led the decline on 24-25 September 2026. Higher yields lift the discount rate used to value future earnings, and that mechanically compresses valuations. Growth companies, whose profits sit further out in the future, take the hardest hit, because more of their value depends on cash flows that are now discounted more steeply.
Crypto followed as a risk-off casualty rather than the safe haven its advocates claim it to be.
- Bitcoin fell below $84,000 on 25 September 2026, extending a roughly 2% pullback from the prior session
- Worldcoin and Pepe posted double-digit percentage declines over 24 hours, among the worst performers in the market
When real yields spike, crypto trades like a high-beta risk asset, amplifying the move rather than cushioning it.
The dollar and gold completed the picture, following the well-worn high-yield playbook.
- The US Dollar advanced to a two-month high against a basket of currencies
- Gold slipped below $4,300, near a one-week low, despite its traditional safe-haven reputation
- In currencies, USD/JPY held near 158.00 and AUD/USD drifted toward 0.7000
Even gold, the asset investors usually run to when they are nervous, could not escape the pull of a risk-free rate near 5%.
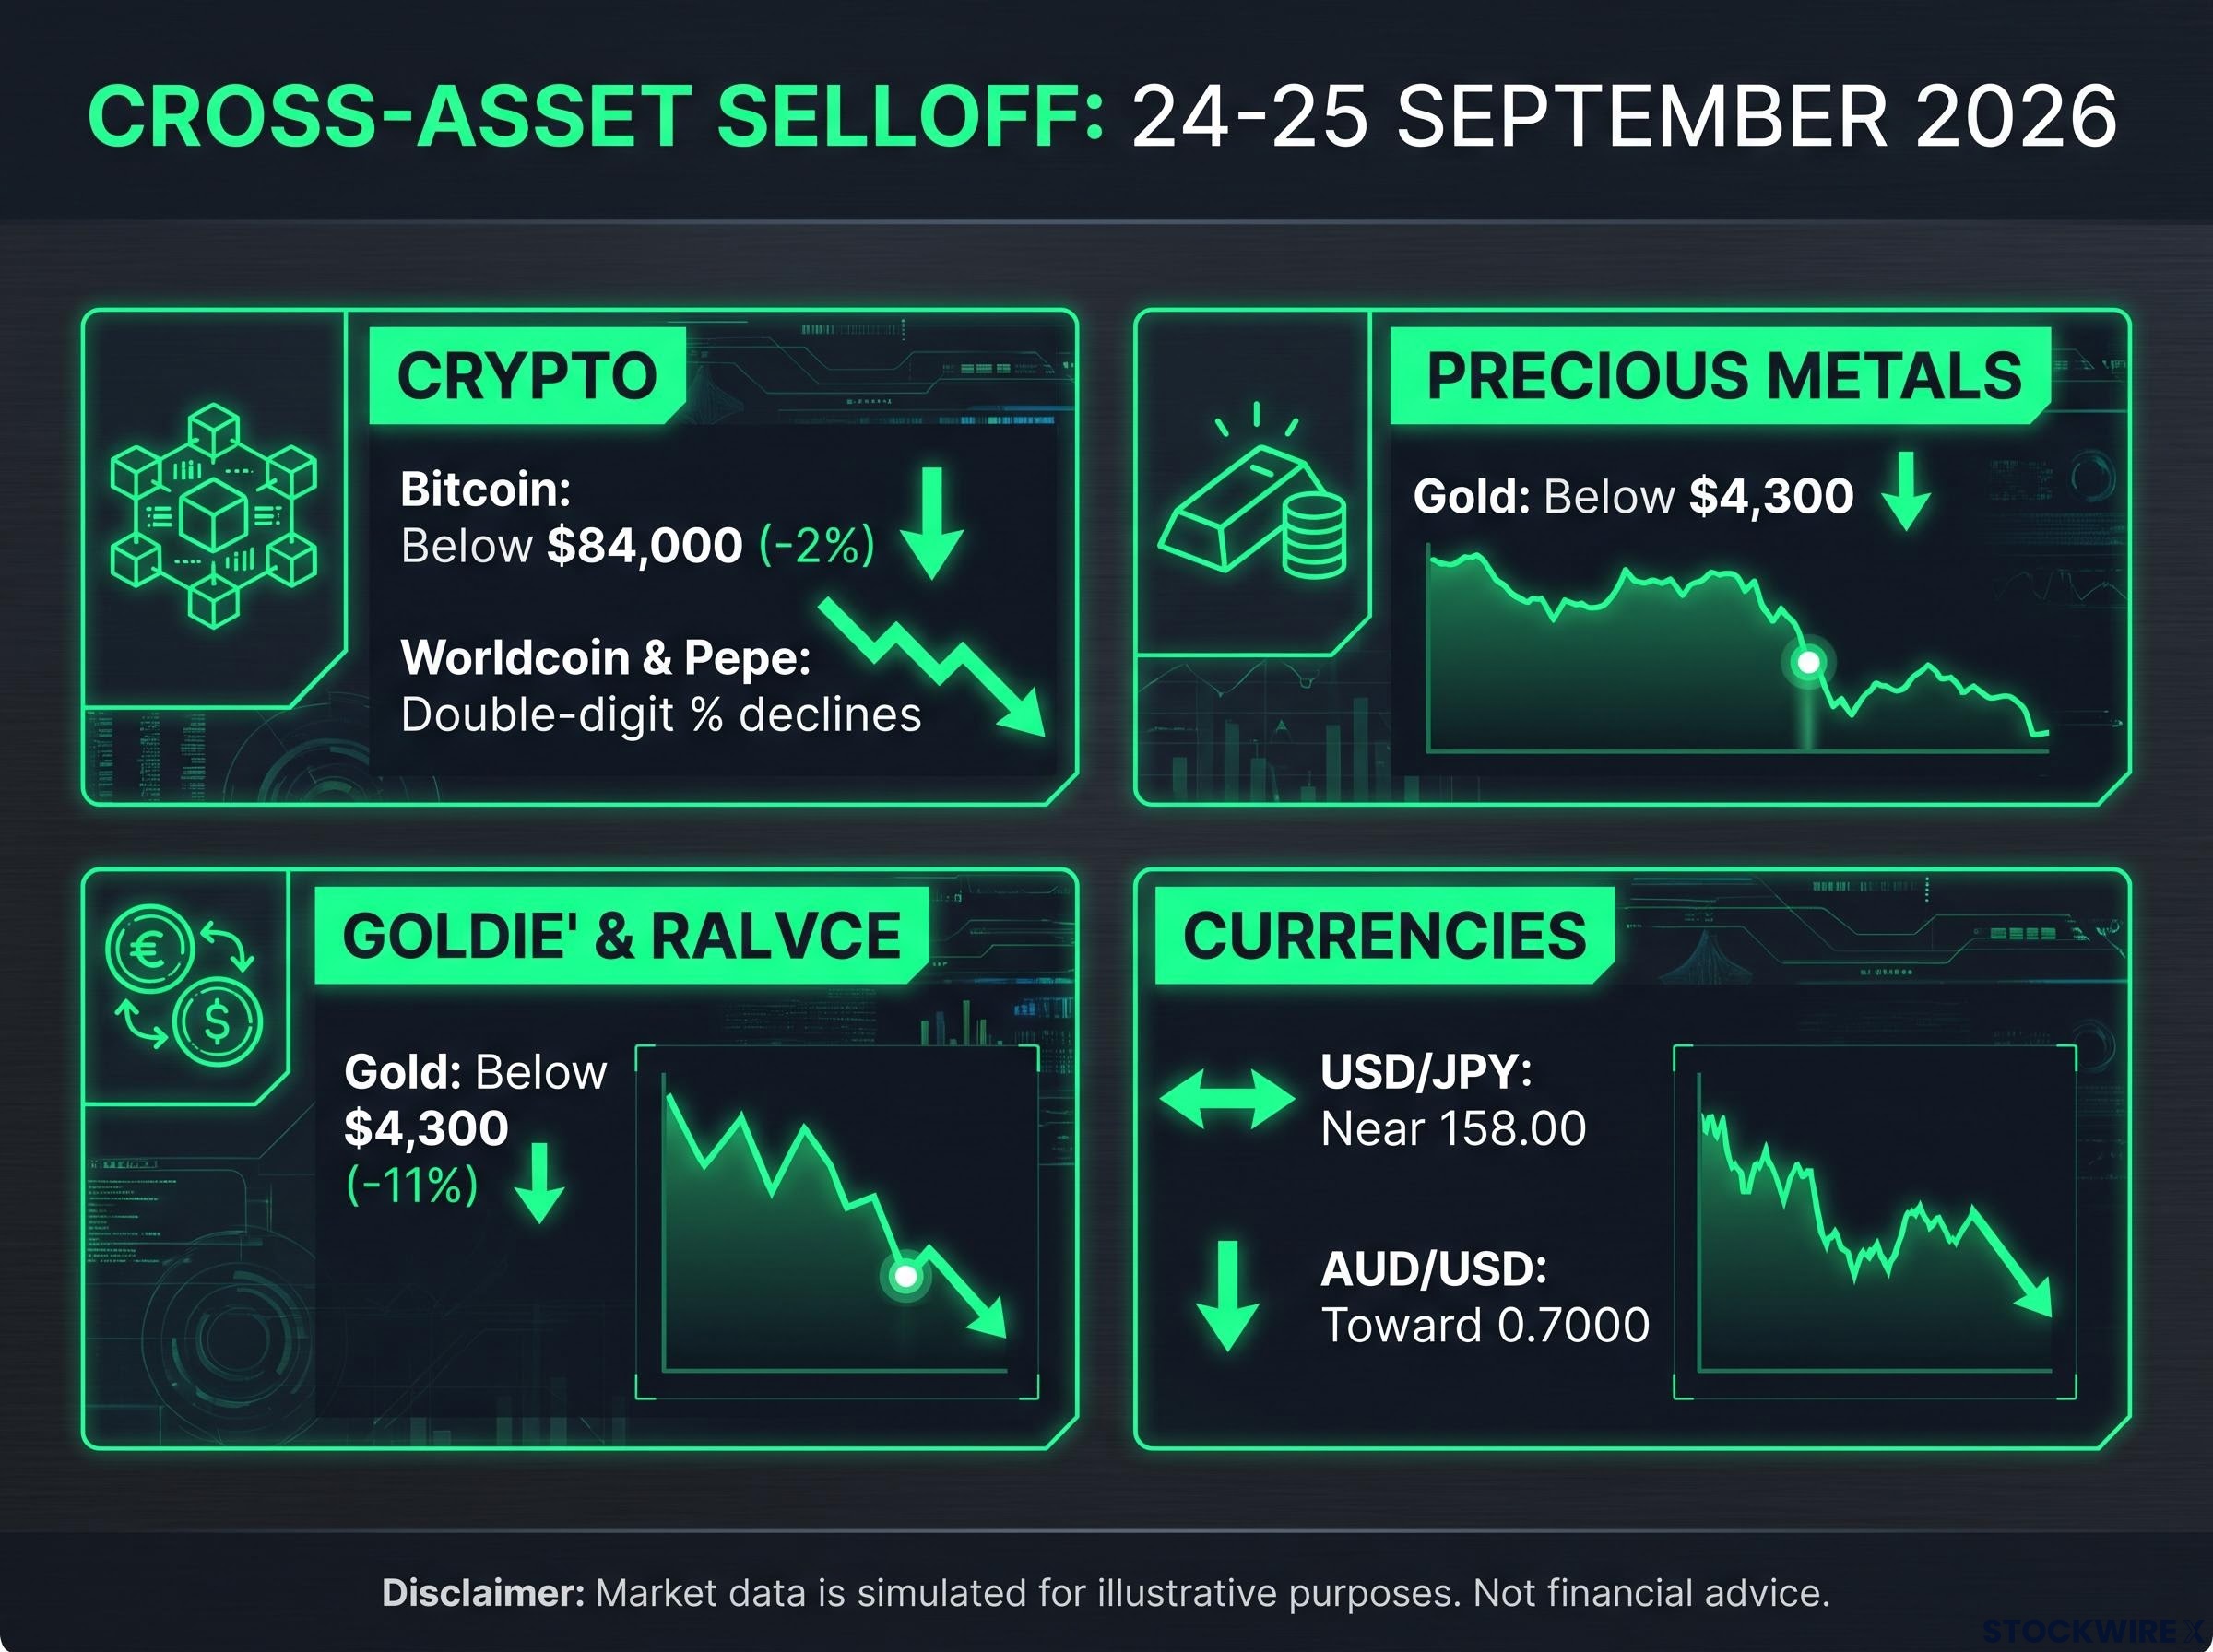
For anyone watching a portfolio, the cross-asset selloff confirms the core dynamic: at 5% on risk-free Treasuries, capital is actively migrating toward yield. Assets that require patience or carry rich valuation multiples are the first to feel that reallocation pressure.
At roughly 5% risk-free on long Treasuries, investors can lock in a high nominal return with far less volatility than stocks. That reprices everything, and it makes this a portfolio-wide event, not a bond-market sideshow.
What 5% yields mean for mortgages, credit, and everyday borrowing costs
The numbers on a bond screen do not stay on the screen. They land on your mortgage application and on the interest accruing against your credit card.
The 10-year Treasury yield is the benchmark that 30-year fixed mortgage rates are priced off. With the 10-year at 5.148%, mortgage rates sit meaningfully above that, pushing homeownership further out of reach for buyers and stripping the incentive for existing owners to refinance.
The transmission from the 10-year yield into mortgage rates is neither instant nor uniform, but a housing market freeze is already visible in the data: housing starts fell 13.5% year-over-year as of July 2026 and Home Depot’s CFO described conditions as ‘frozen’ at the 6.7% mortgage rate level that preceded this week’s further yield climb.
| Borrowing category | Benchmark rate | 2026 context |
|---|---|---|
| 30-year fixed mortgage | 10-year Treasury (5.148%) | Highest benchmark since 2007 |
| Corporate debt | 10- and 30-year Treasury (up to 5.444%) | 30-year at a 22-year high |
| Short-term consumer credit | 2-year Treasury / Fed funds (4.494%) | Two-year peak on hawkish Fed |
Companies feel the same squeeze. Corporate borrowing costs tied to Treasuries rise with the benchmark, so new debt and refinancing get more expensive, which compresses margins and can slow hiring and capital spending. That is a headwind the market is only beginning to price in.
The historical echo is deliberate. The 30-year yield at 5.444% is its highest in 22 years, and the 10-year last traded here in 2007, returning borrowing conditions to their pre-financial-crisis footing.
Yields at 2007 levels evoke the borrowing costs that preceded a sharp slowdown in housing activity and a broad tightening of credit. CNN Business flags sustained conditions like these as a channel through which the economy can tip toward recession.
For perspective, these are not record highs in absolute terms. TradingEconomics notes the 10-year yield’s all-time peak was 15.82% in September 1981, so today’s levels are high by modern standards but within a range markets have digested before.
If you carry a mortgage, are weighing a home purchase, or hold exposure to credit-sensitive sectors, the takeaway is structural rather than temporary. Financial plans built on the post-2008 low-rate assumption need revisiting.
What comes next depends on whether the data breaks first
Two paths sit in front of these yields, and which one arrives depends on data you can track in real time.
The bear case for bonds is simple to state. If PMI readings stay strong and Fed officials hold their hawkish line, yields have room to extend higher, keeping pressure on equities, housing, and credit through the fourth quarter of 2026. Fiscal deficits and heavy Treasury supply are structural forces pushing the term premium up, and structural forces do not fade on their own.
The case for a retreat rests on the cycle turning. If upcoming releases show growth cooling or inflation easing, the term premium built into long yields could unwind quickly. Analysts also note that part of this move may reflect stop-loss selling triggered once 5% broke, and positioning-driven moves can reverse fast. The 5% level itself draws yield-seeking buyers into Treasuries at higher allocations, a natural counter-force to the selloff.
Here are the three signals worth monitoring in the weeks ahead:
- Inflation prints (CPI): a hotter reading extends the hawkish case; a cooler one opens the door to a pullback
- PMI and activity data: whether September’s strength holds or fades decides how much cover the Fed retains
- Federal Reserve communication: any softening in tone from officials like Barr would shift the whole outlook
Knowing the specific triggers gives you agency over the headline noise.
Investors wanting context on why this tightening cycle may not resolve quickly will find our deep-dive into the structural inflation regime, which examines 150 years of inflation cycle data and the 13 simultaneous structural reversals that analysts argue make a quick return to 2% historically unlikely.
This article is for informational purposes only and should not be considered financial advice. Investors should conduct their own research and consult with financial professionals before making investment decisions. Past performance does not guarantee future results. Financial projections are subject to market conditions and various risk factors, and forward-looking scenarios are speculative and subject to change based on market developments.