Think about the last IPO that genuinely excited you. Now ask yourself an uncomfortable question: did buying it on day one actually work out, or did the stock slide the moment you got in?
That pattern is not bad luck. When SpaceX listed on the Nasdaq on 12 June 2026, shares jumped roughly 19% in a debut CNN called “blockbuster.” Then, according to Katie Stockton of Fairlead Strategies, the stock fell even harder before it recovered. The excitement itself was part of the problem.
You are watching this play out at an awkward moment. Blockbuster listings keep arriving, with Anthropic expected to follow in Q4 2026, at the very time the AI investment theme is showing signs of maturation and internal dispersion. These are not two separate stories. They are the same story.
This guide gives you a reusable framework for reading IPO price action analysis with discipline: when post-listing moves actually mean something, when a chart on a brand-new stock can be trusted, and how to read the stage of a long-running technology trade. After this, you will know when to watch and when acting becomes analytically defensible.
Why the stocks you are most excited about fall after listing
You were probably right about the company. You were just wrong about the timing. That distinction is the whole game, and it starts with understanding that a post-IPO slide is a structural, predictable dynamic, not a market failure or a sign you misjudged the business.
The setup begins months before listing day. Pre-IPO media coverage, private round pricing, and underwriter marketing front-load demand so that by the time shares open, most of the optimism is already baked into the offer price. This is the “buy the rumour, sell the news” pattern, and it leaves little room for genuinely new positive information to push the stock higher.
Then the IPO creates its own supply shock. Employees, pre-IPO holders, and fast-money accounts use the first days of strong trading to take profits, adding sell orders at precisely the moment retail enthusiasm peaks.
Here are the four mechanisms working against you at listing:
- Front-loaded demand: the good news is already priced in before you can buy.
- Supply shock: insiders and fast-money accounts sell into the opening pop.
- Valuation anchoring: a stretched offer price means any small disappointment triggers a re-rating downward.
- Stabilisation fade: underwriters support the price early, then step back, leaving conviction to be tested.
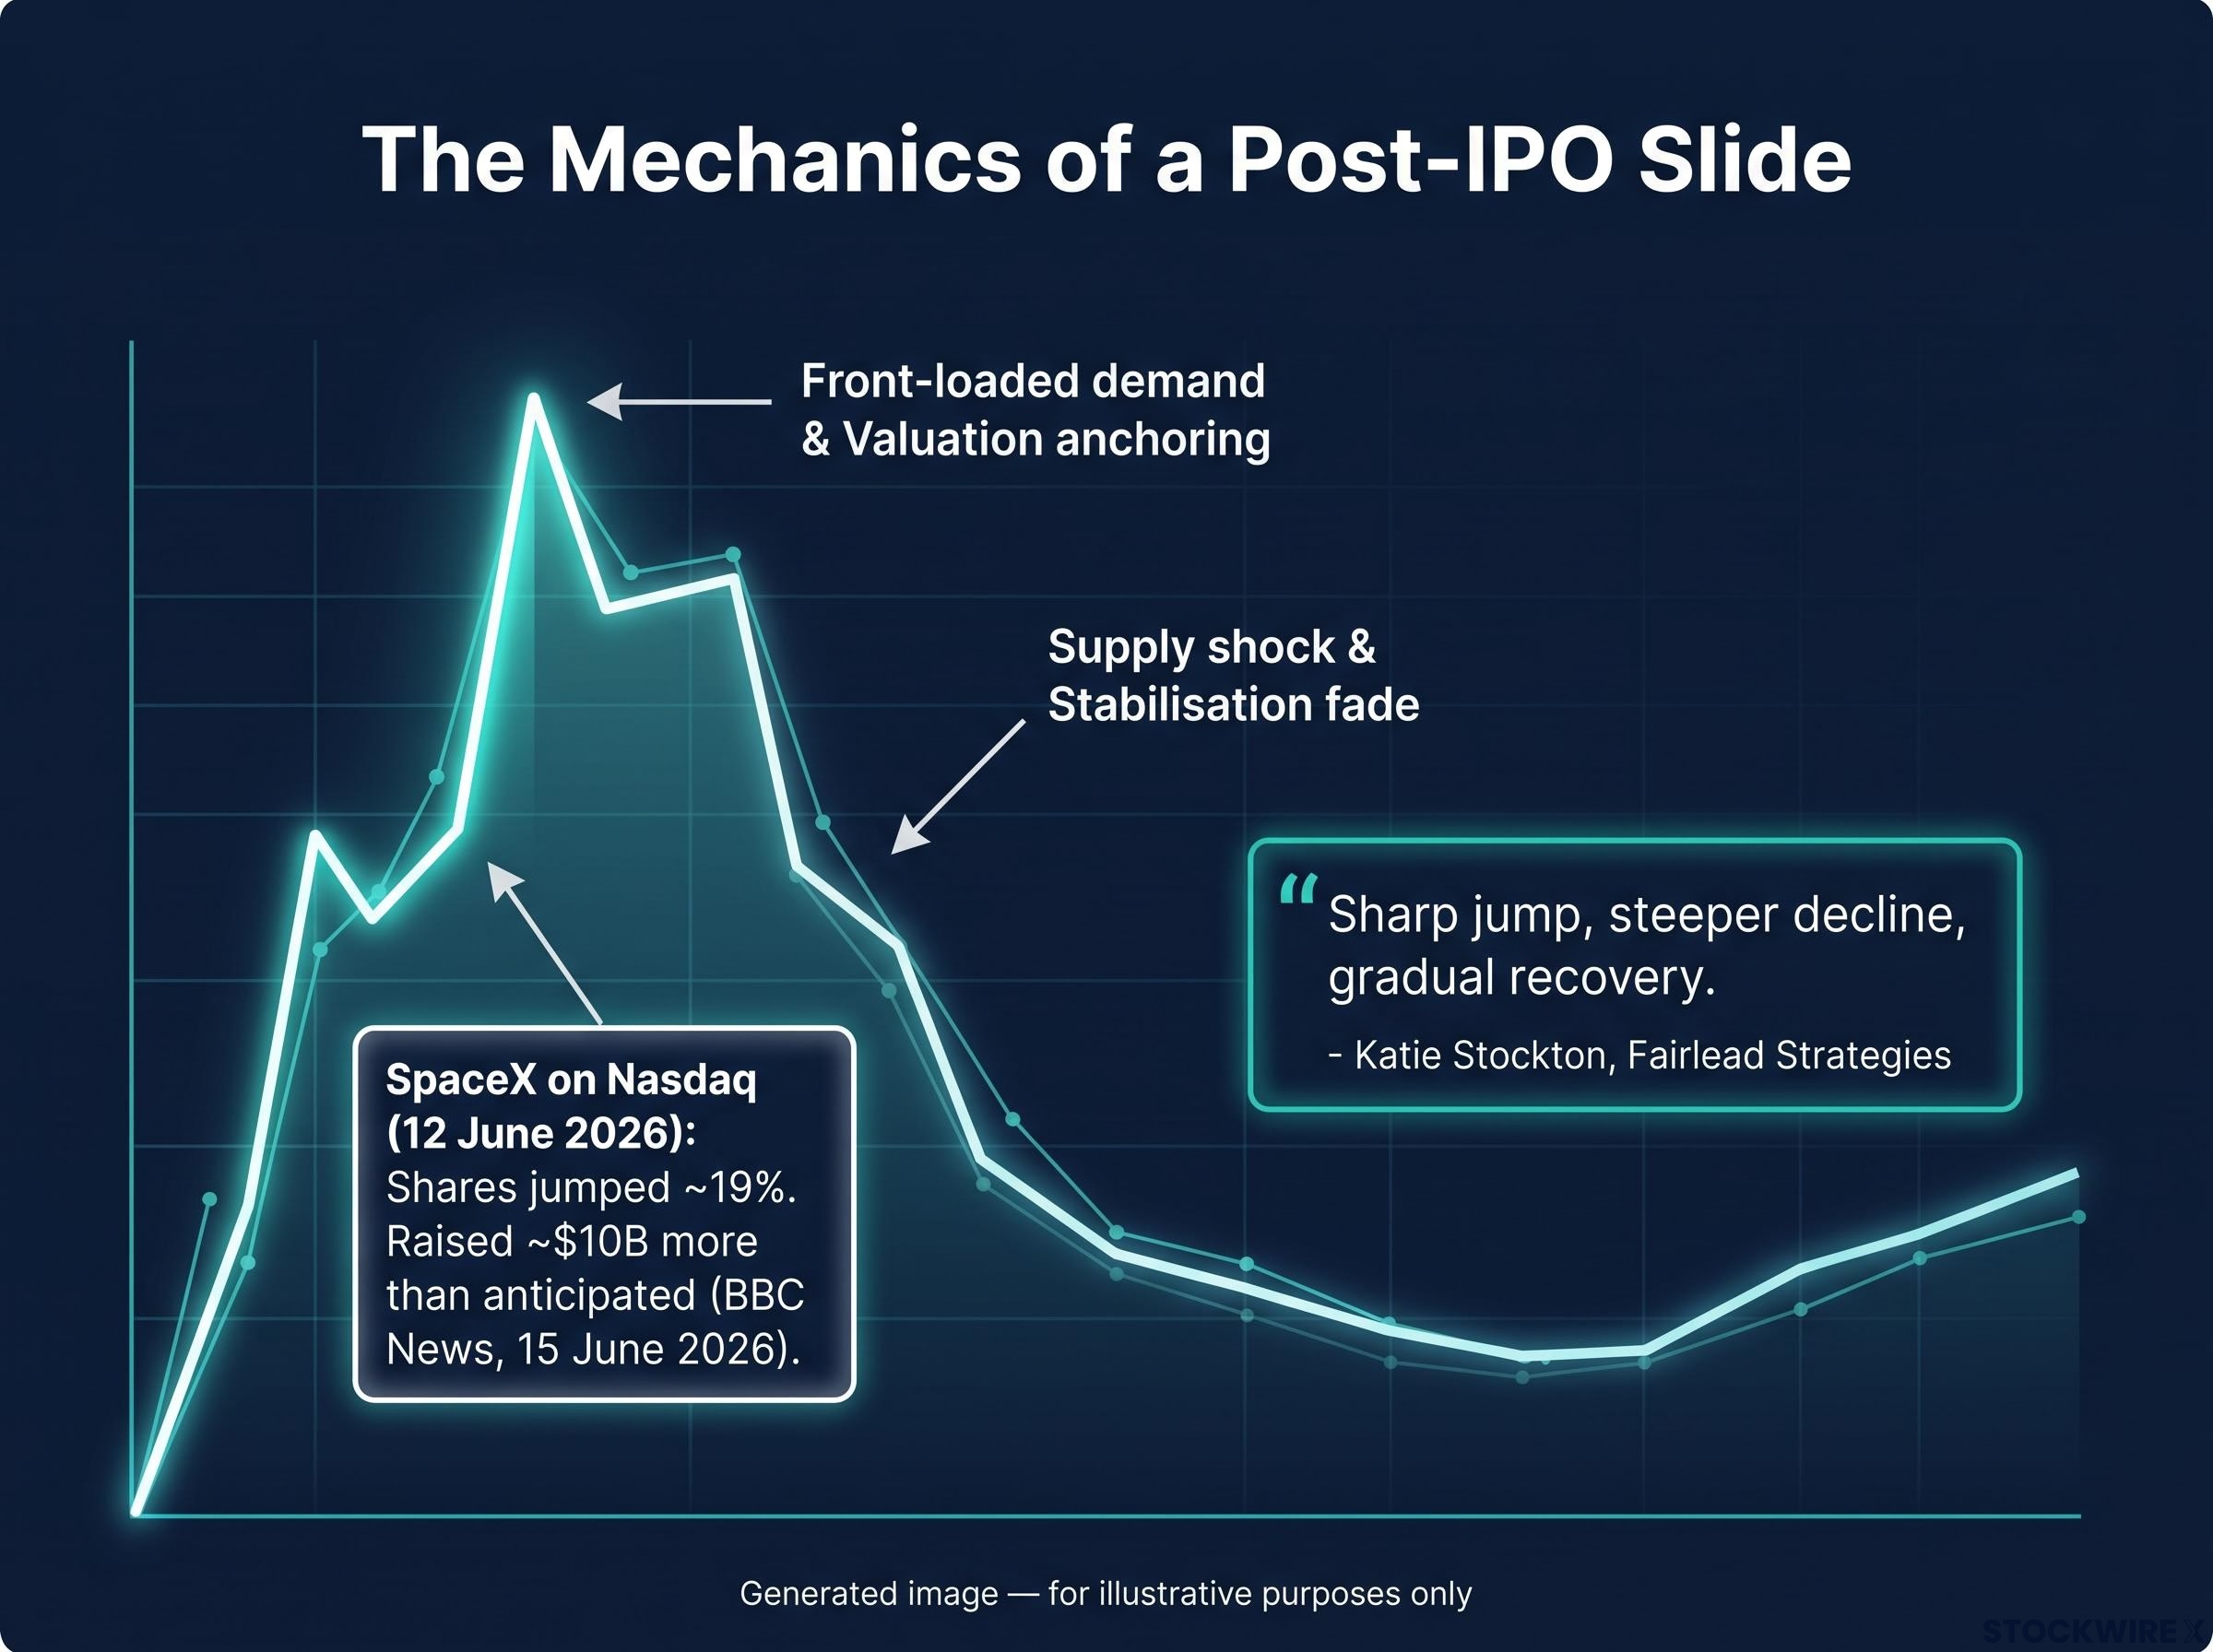
Katie Stockton of Fairlead Strategies observed that SpaceX experienced a sharp jump after its IPO, followed by an even steeper decline, before gradually recovering and establishing a trend.
The scale of the front-loading was hard to miss. BBC News confirmed on 15 June 2026 that the SpaceX listing raised roughly $10 billion more than initially anticipated. When demand is that intense before a stock even trades, the surprise on listing day is rarely large enough to sustain the pop.
If this feels familiar, it should. It is the same dynamic that plays out around a well-telegraphed Federal Reserve rate decision: markets price in the expected move over weeks, so when the Fed delivers exactly what everyone expected, investors take profits and the trade unwinds.
So your excitement about a company is not wrong. Acting on it at listing is simply expensive. Understanding that difference is the first step toward IPO discipline, and it separates disappointment from opportunity. The stock fell because supply and demand mechanics were temporary, which may mean the company is still worth owning once the dust settles.
The structural roots of IPO underperformance run deeper than any single listing cycle: newly listed companies have historically trailed comparably sized established peers by an average of 3.3% per year over their first five years, a drag that compounds quietly into a significant capital gap for long-term holders.
When big ASX news breaks, our subscribers know first
Why you cannot chart a new listing for the first four to six months
Picture sitting with a technician who keeps telling you to put your charting tools away. Not because they do not work, but because on a stock this new, they simply do not function yet. The tools you want to use need history the stock does not have.
Standard technical indicators, moving averages, relative strength index (RSI), and moving average convergence divergence (MACD), all require a minimum amount of price history to produce stable signals. With only a few weeks of trading, a 50-day or 200-day moving average is either undefined or completely dominated by the opening print.
Why the tools don’t work yet
There are four structural reasons the chart cannot help you at this stage:
- Insufficient data: oscillators and moving averages need history to produce reliable signals, and a new listing has none.
- Deal mechanics dominate: underwriter stabilisation, lock-up schedules, index-inclusion trades, and large holders exiting create sharp, non-repeatable moves.
- Float concentration: thin free floats and insider-heavy ownership amplify volatility on modest order flow, making chart patterns misleading.
- Earnings checkpoints: the market needs one or two reporting cycles to reprice on actual performance rather than narrative.
Standard practitioner guidance, reflected in the work of Katie Stockton at Fairlead Strategies, places the viable window at roughly four to six months of price history. That is not an arbitrary rule. It is the point at which one or two earnings cycles have completed and the market has had a chance to reprice on results rather than hype. Frameworks from John J. Murphy, Martin Pring, and CMT Association educational material all reinforce the same principle: indicators are more robust when applied to securities with deeper trading histories.
Peer-reviewed technical pattern reliability research supports this practitioner consensus, finding that price-pattern predictability is weakest when the underlying data series is short, which is precisely the condition a newly listed stock presents in its first weeks of trading.
Put concretely, meaningful technical analysis on SPCX would not be appropriate until roughly October to December 2026. When Anthropic lists in Q4 2026, the same clock starts again from zero.
What analysts watch instead of indicators in the early months
In those first months, the useful reference points are the simple ones: the IPO offer price itself, plus the first-day high and low, which act as informal support and resistance levels.
How the stock behaves relative to those levels in weeks four to twelve gives you a rough read on institutional intent. Holding above the offer price on weakness suggests buyers are adding. Rolling over through it into strength suggests larger holders are distributing.
For you, eyeing either SPCX or a freshly listed Anthropic, this means the chart is not the right tool yet. Acting on early price patterns is speculating on IPO mechanics, not on the company’s investment merit.
How to read the stage of a secular technology trade
The internet boom listed hundreds of companies. Only a handful, Amazon and later Google among them, became enduring giants. Most of the rest failed or were acquired at low valuations, despite carrying compelling stories that sounded, at the time, exactly like the ones dominating headlines today.
That is the pattern worth learning, because it repeats. Early-stage enthusiasm lifts many participants broadly. Then the trade matures, and leadership narrows sharply into winner-takes-most dynamics.
The mobile wave told the same story. Numerous handset makers and mobile-software players competed, but platform economics consolidated the market around Apple and Google’s Android while many others saw share and margins erode. Cloud computing followed suit: as the trade matured, dominant hyperscalers captured most of the economic value while smaller vendors struggled to hold pricing power.
| Technology era | Early-stage winners | Consolidation dynamic | Lesson for AI investors |
|---|---|---|---|
| Internet (late 1990s) | Amazon, Google endured | Most listed names failed or were acquired cheaply | Owning “the theme” was not enough; quality and balance sheet mattered |
| Mobile (mid-2000s to early 2010s) | Apple, Android ecosystem | Network effects entrenched a few, eroded the rest | Not every themed play benefits equally |
| Cloud (2010s onward) | Dominant hyperscalers, leading SaaS | Scale captured value; niche players squeezed | Primary infrastructure beats numerous sub-scale bets |
The AI trade sits somewhere along this same curve. The source characterisation is that it is maturing, expected to favour superior companies while lower-quality participants underperform.
The key risk flagged for retail investors is dispersion: theme-level exposure can hide a growing gap between a small group of structural winners and a larger set of AI-labelled laggards that never fully monetise the hype.
If you currently hold a basket of AI-labelled stocks without distinguishing infrastructure leaders from narrative-driven names, the historical precedents suggest that position will increasingly behave like two very different investments. Knowing where a trend sits in its lifecycle is arguably more valuable than knowing whether the trend is real, because the stage determines which part of the theme rewards you and which part becomes a liability.
Reading the AI trade’s technical signals today
History tells you the shape of the trade. A live signal tells you where you are on it right now. The tool for that is the 200-day moving average, applied to a theme-level AI exposure such as an ETF like BOTZ, AIQ, or CHAT, measured relative to the S&P 500.
What the theme ETF signal tells you
Katie Stockton of Fairlead Strategies has indicated that the 200-day moving average on an AI-focused ETF, charted against the S&P 500, still points to a long-term positive relative trend. In plain terms, the secular AI trade remains intact at the theme level.
That does not mean every component participates equally. A positive relative trend on the theme ETF is not a green light for every AI-labelled stock, and dispersion is precisely the risk to monitor.
AI sector dispersion is already visible in 2026 market data: more than 75% of software application and infrastructure companies in the Morningstar US Technology Index are in negative territory year-to-date, while the spread between top and bottom decile technology stocks has reached a record 133 percentage points.
The semiconductor sub-trend deserves separate attention. According to the source material, the summer of 2026 saw a downward trend in semiconductor-related trades that affected certain long-term technical indicators, with some names losing support on monthly measures. Semiconductor stocks have since shown renewed activity.
Here are the signals worth tracking:
- 200-day moving average on a theme ETF relative to the S&P 500: above the line means the secular trade is intact; losing it signals a regime shift worth reassessing.
- Semiconductor sub-trend direction: the summer 2026 downtrend and its subsequent renewal.
- Post-IPO price stabilisation in new AI listings before applying any full technical read.
One caveat on the data. Specific current ETF relative-performance figures were not independently confirmed in the research, so treat the Stockton observation as the primary authoritative reference and pull live data before acting.
The 200-day test gives you a single, low-maintenance signal: when the theme ETF holds above it on a relative basis, you can hold the trade broadly. When it loses that level, selectivity and quality filtering become the more important discipline. That is how you tell a temporary pullback from a genuine regime shift.
How the Anthropic listing fits into this picture
Anthropic’s anticipated Q4 2026 listing, at a valuation of roughly $2 trillion (per Yahoo Finance and Bloomberg on 15 September 2026), would crystallise late-stage private AI value into public markets. That crystallisation is itself a hallmark of a maturing secular trade.
Because Anthropic is characterised as more closely aligned with semiconductor sector rotation than SpaceX was, its reception will partly depend on where the semiconductor sub-trend stands at listing time.
The “sell the news” risk is structurally identical to what SpaceX experienced. Apply the four-to-six-month waiting framework before treating Anthropic’s chart as analytically reliable.
The AI IPO supply shock carries a dimension beyond any single listing: BCA Research’s analysis of roughly 12,000 IPOs over 40 years finds that elevated listing volumes have historically preceded weaker forward equity returns, as new supply erodes the scarcity premium that concentrated capital into incumbent AI leaders.
Putting the framework to work: IPO discipline meets secular trend awareness
You now hold two tools that work best together. One governs how you treat a fresh listing. The other governs how you read the trade it belongs to. High-profile IPOs arriving inside a maturing secular trend carry double the hype risk, because both the IPO mechanics and the late-cycle dynamics point toward front-loaded expectations.
The SpaceX sequence, spike, decline, then recovery, is the proof of concept. It shows exactly why patience beats enthusiasm on day one.
Here is the framework, step by step:
- Assess the secular trend stage via the theme ETF’s 200-day moving average relative to the S&P 500 before sizing into any individual name.
- At listing, note only the offer price and the first-day range as informal reference levels. Nothing more.
- Wait for the four-to-six-month earnings checkpoint before trusting the chart.
- Reassess with the full indicator suite once that data exists.
- Filter for quality within the theme, distinguishing infrastructure from application layer, before committing capital.
Applied consistently across multiple IPO cycles and trend inflection points, this discipline is worth more than any single trading call, because it compounds your judgement rather than informing one decision.
For investors ready to translate the secular trend framework into a concrete allocation, our dedicated guide to AI ETF portfolio construction covers a four-layer approach across the full AI value chain, with practical sizing logic and overlap management guidance for each tier.
The near-term test is Anthropic. Stockton’s read is that AI remains a long-term intact trend, paired with the maturation caveat that winner-takes-most dynamics will increasingly drive dispersion. The next time a high-profile AI listing generates intense excitement, you have a systematic reason to watch rather than act, and a specific set of signals telling you when acting becomes defensible.
This article is for informational purposes only and should not be considered financial advice. Investors should conduct their own research and consult with financial professionals before making investment decisions.
Past performance does not guarantee future results, and forward-looking figures around Anthropic’s timing and valuation remain subject to market conditions and regulatory approval.