Fed Holds Rates but Dot Plot Signals a Hike Before Year-End
2 hrs ago

Three of Australia’s four largest banks carry sell or strong sell ratings from broker consensus as of April 2026, with projected 12-month downsides ranging from 26% to more than 50% relative to analyst price targets. For a sector that collectively accounts for roughly 25% of the S&P/ASX 200 by market capitalisation, the gap between where these stocks trade and where analysts believe fair value sits is not marginal. It carries real portfolio implications for every Australian investor with superannuation exposure, let alone a direct shareholding. Against that backdrop, one name stands apart: ANZ. What follows breaks down the broker consensus data across all four banks, explains the structural factors behind the divergence in analyst sentiment, and provides a framework for reading how valuation gaps in a sector heavyweight translate into risk-adjusted decisions.
The numbers are stark. Commonwealth Bank of Australia trades at approximately $173.66, up 7.79% year to date. Westpac sits at approximately $38.22, up 24.11%. National Australia Bank is at approximately $39.80, up 19.97%. All three have delivered strong returns in 2026. All three sit materially above where most analysts see fair value landing over the next 12 months.
The gap is not a function of analyst pessimism. It is a function of share price appreciation outpacing earnings growth expectations. Prices have run; consensus targets have not followed at the same pace.
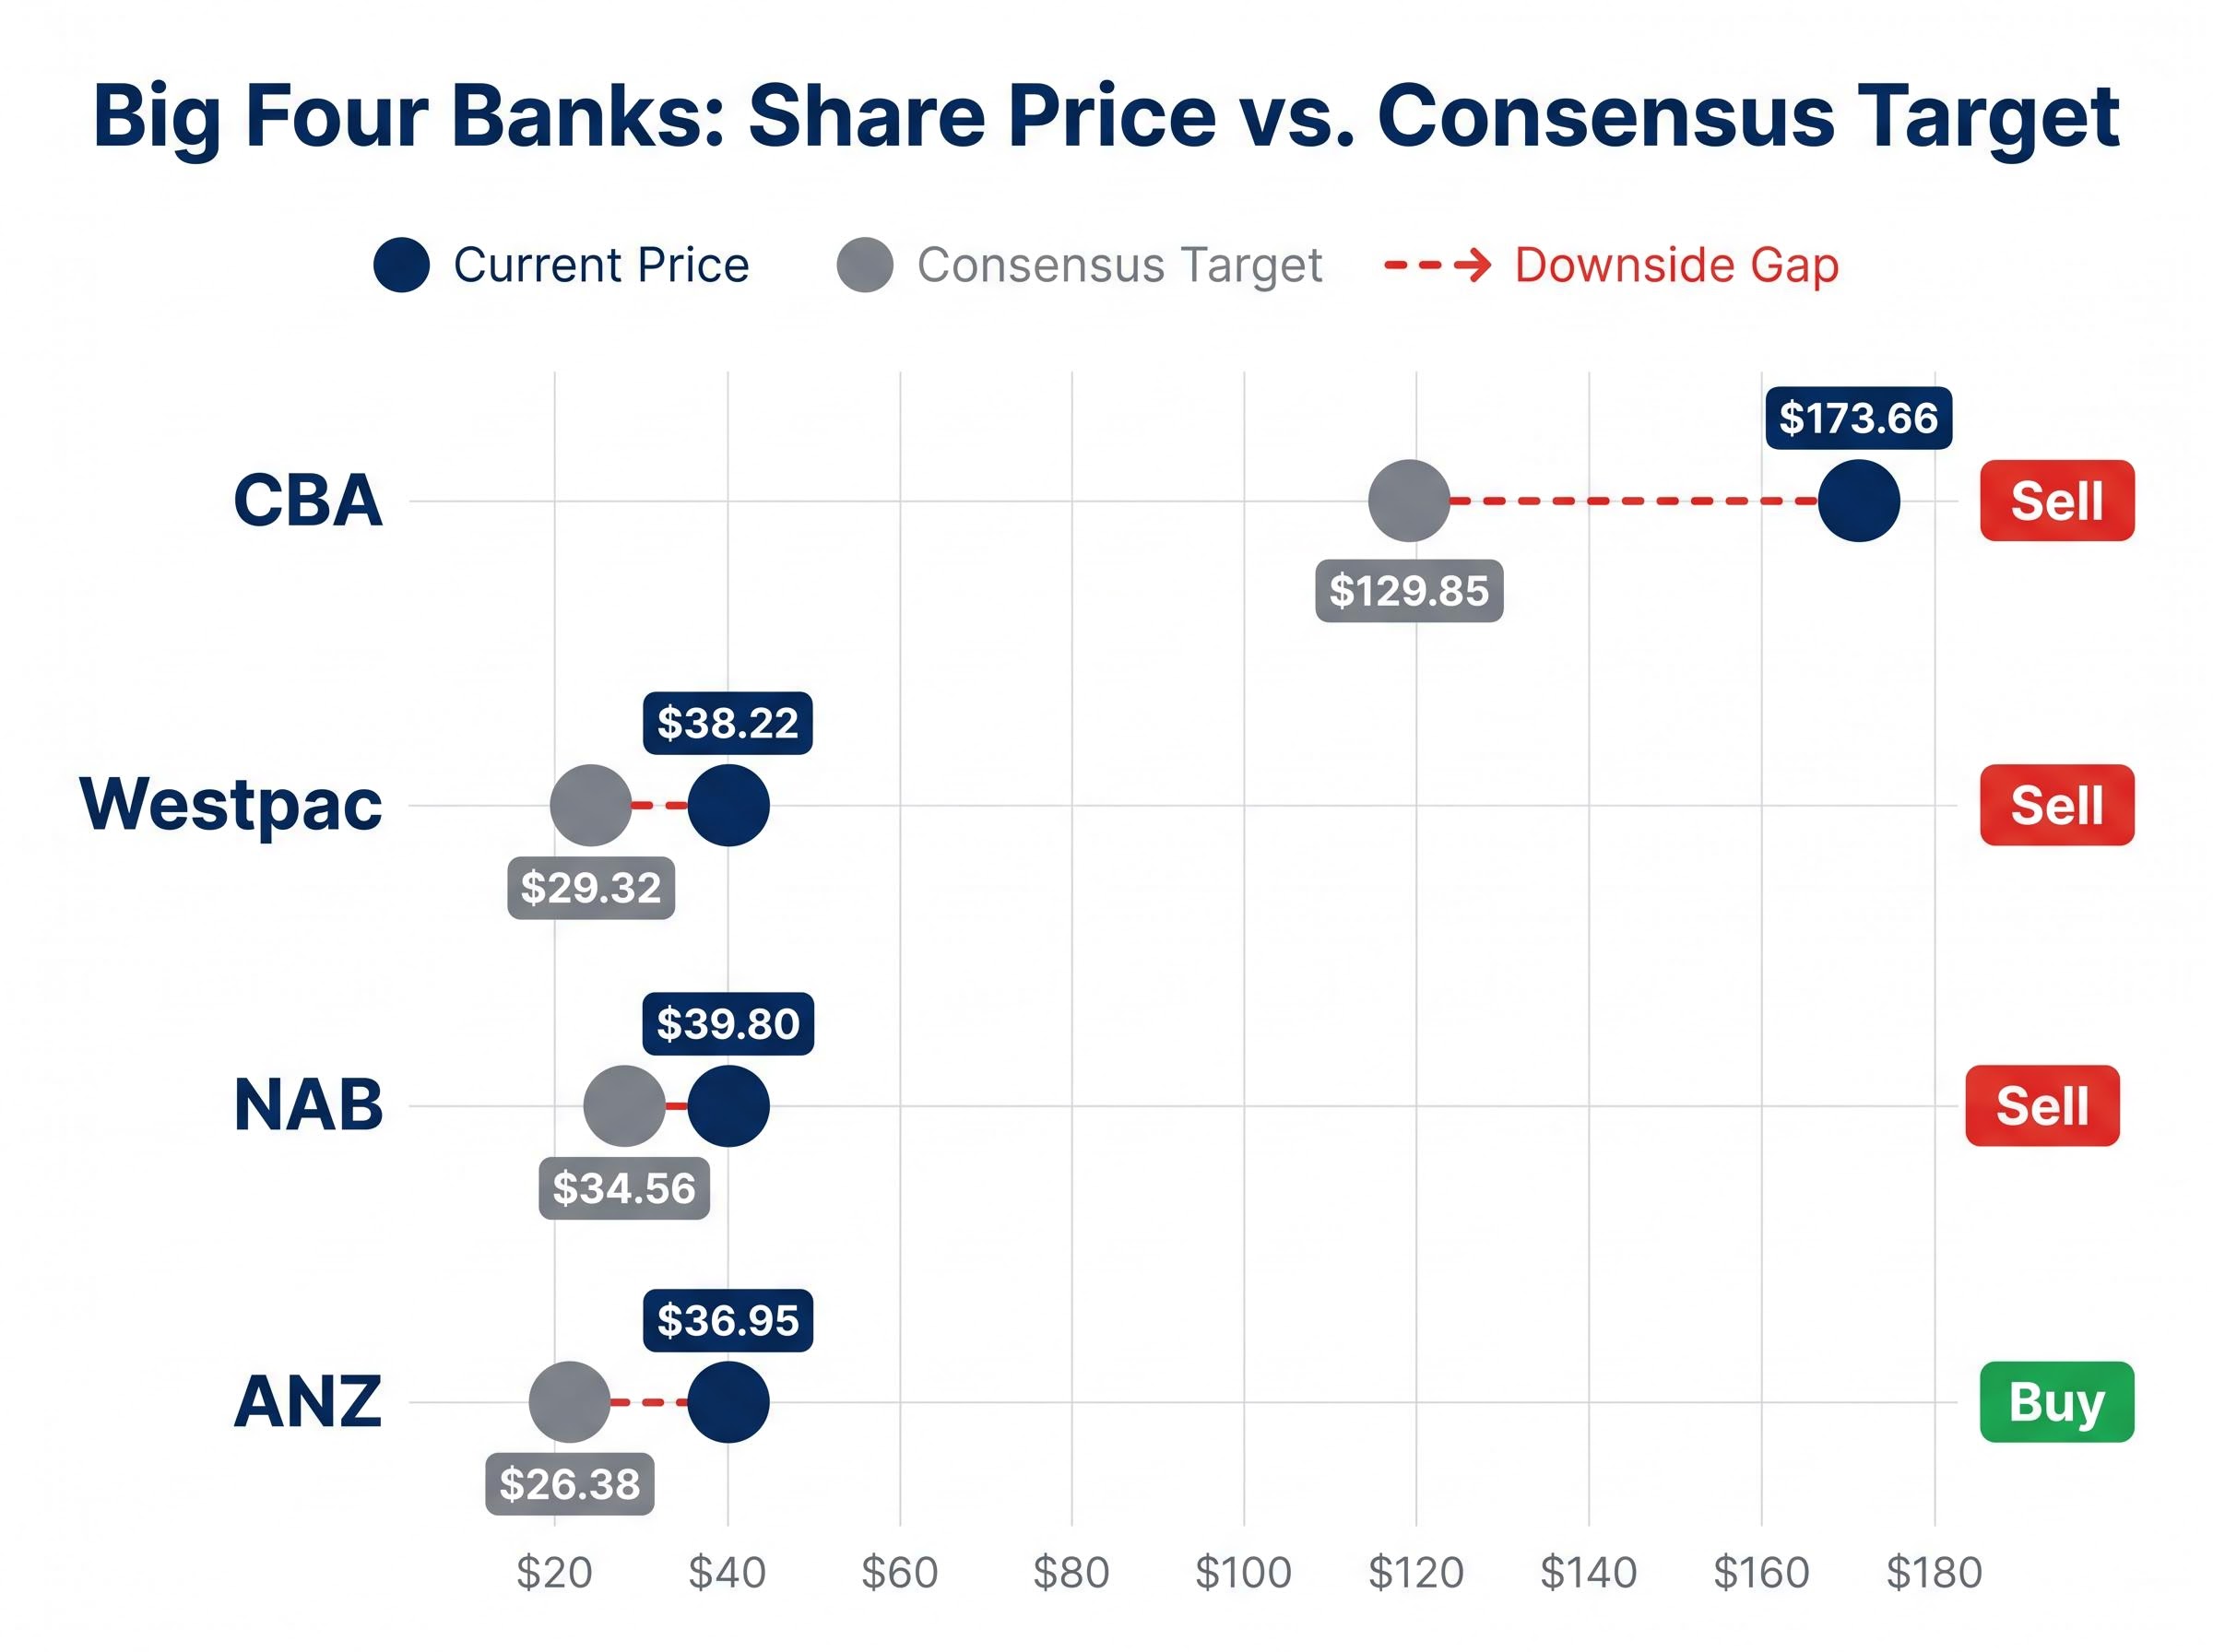
| Bank | Share Price (approx.) | Consensus Target | Implied Downside (%) | Consensus Rating |
|---|---|---|---|---|
| CBA | $173.66 | $129.85 | ~25% | Sell |
| Westpac | $38.22 | $29.32 (downside) | ~26.6% | Sell |
| NAB | $39.80 | $34.56 (downside) | ~13% | Sell |
| ANZ | $36.95 | $26.38 | ~28.6% | Buy |
CBA’s downside target of $90 implies a potential 50.5% decline from current levels, the most extreme bear case among the four banks and the starkest illustration of how far price has moved from where a portion of analysts believe fair value sits.
For investors holding these names through industry super funds or direct portfolios, the size of the price-to-target gap is not academic. It determines whether a quality business is held at a reasonable price, or at a price that already assumes a very optimistic future.
The valuation gaps are not irrational. They reflect genuine quality in some cases, but quality at prices that leave little margin of safety. The analyst concerns are specific to each bank:
CBA’s dividend history, which stretches back to fully franked payments without interruption since 2006, creates a genuine tension for income-focused investors: the income case remains intact, but the gap between the current price and analyst targets means capital risk is elevated at a level that most buy-and-hold frameworks were never designed to absorb.
All four banks beat consensus cash earnings by 4-11% in their FY/HY2025 results, and bad debt charges came in below expectations. Combined Big Four profit for HY2026 reached approximately $15.5 billion, up 3.5%.
The question is whether those tailwinds are now fully reflected in share prices. The RBA cash rate stands at 4.1% as of April 2026, with two further rises forecast to bring it to approximately 4.7% by September 2026. That trajectory supports net interest margins in the near term but also pressures credit quality downstream, particularly for higher-debt borrowers. Analysts suggest the easy cycle gains are priced in, especially for CBA and NAB at current levels.
The RBA’s February 2026 monetary policy statement provides the official rationale behind the cash rate settings that underpin near-term net interest margin projections for the sector, including the inflation and GDP growth outlook that analysts are factoring into their earnings forecasts.
Broker consensus ratings are the aggregated recommendations from a panel of sell-side analysts. They are typically expressed as a distribution of buy, hold, and sell ratings alongside a 12-month price target. The consensus target represents the median or mean of those individual estimates, not a guaranteed outcome.
The distinction matters. A sell rating means the stock appears overvalued relative to an analyst’s intrinsic estimate. It does not mean the business has a fundamental problem. All four banks remain profitable, well capitalised, and investment grade. For a sector that holds approximately 70-80% of Australian banking assets, with combined resident assets exceeding $4.08 trillion, even investors with no direct share holdings carry exposure through managed funds and superannuation.
ASX 200 index concentration in financials means that investors relying on passive domestic equity exposure through superannuation are not running a diversified portfolio in the conventional sense; they are running a concentrated bet on the same four banks whose valuations are under scrutiny from Morningstar and sell-side analysts alike.
CBA’s analyst target range spans from $90 to $155.55, against a current price of approximately $173.66. That $65 spread within the consensus illustrates how wide analyst dispersion can be, even on Australia’s largest company by market capitalisation.
A broker consensus rating does tell investors three things:
It does not tell investors:
ANZ offers a useful illustration: 16 analysts cover the stock, with 6 at buy or strong buy and 6 at hold. That distribution implies a balanced-to-positive skew, a materially different signal from the sell-heavy consensus on the other three.
The case for ANZ does not rest on a single metric. It accumulates across yield, capital, scale, and earnings momentum.
Of the 16 analysts covering the stock, 6 hold buy or strong buy ratings and 6 hold ratings, giving ANZ the most constructive consensus skew among the Big Four. Its year-to-date share price gain of 32.92% is the strongest of the group, reflecting the market beginning to price in the earnings and scale benefits of a structural shift.
The consensus price target of $26.38 implies modest downside from the current price of approximately $36.95. But the bull case target of approximately $43 represents roughly 13% upside, and the distribution of outcomes is more balanced than for CBA, Westpac, or NAB.
ANZ completed its acquisition of Suncorp Bank in July 2024 for $4.9 billion. The deal added approximately $69.5 billion in assets: $32 billion in home loans, $30 billion in deposits, and $7.5 billion in commercial loans. That expanded ANZ’s competitive position in retail banking, a segment where CBA has historically led.
The integration is not complete. A $196 million integration cost hit in 2024 demonstrates that execution risk remains until synergies are fully realised. For investors, the Suncorp integration is the variable that will determine whether ANZ’s current valuation is justified or stretched.
For income-oriented investors, yield and capital strength are the two most relevant metrics when price appreciation is constrained by valuation concerns. Side by side, the four banks present a clear comparative picture.
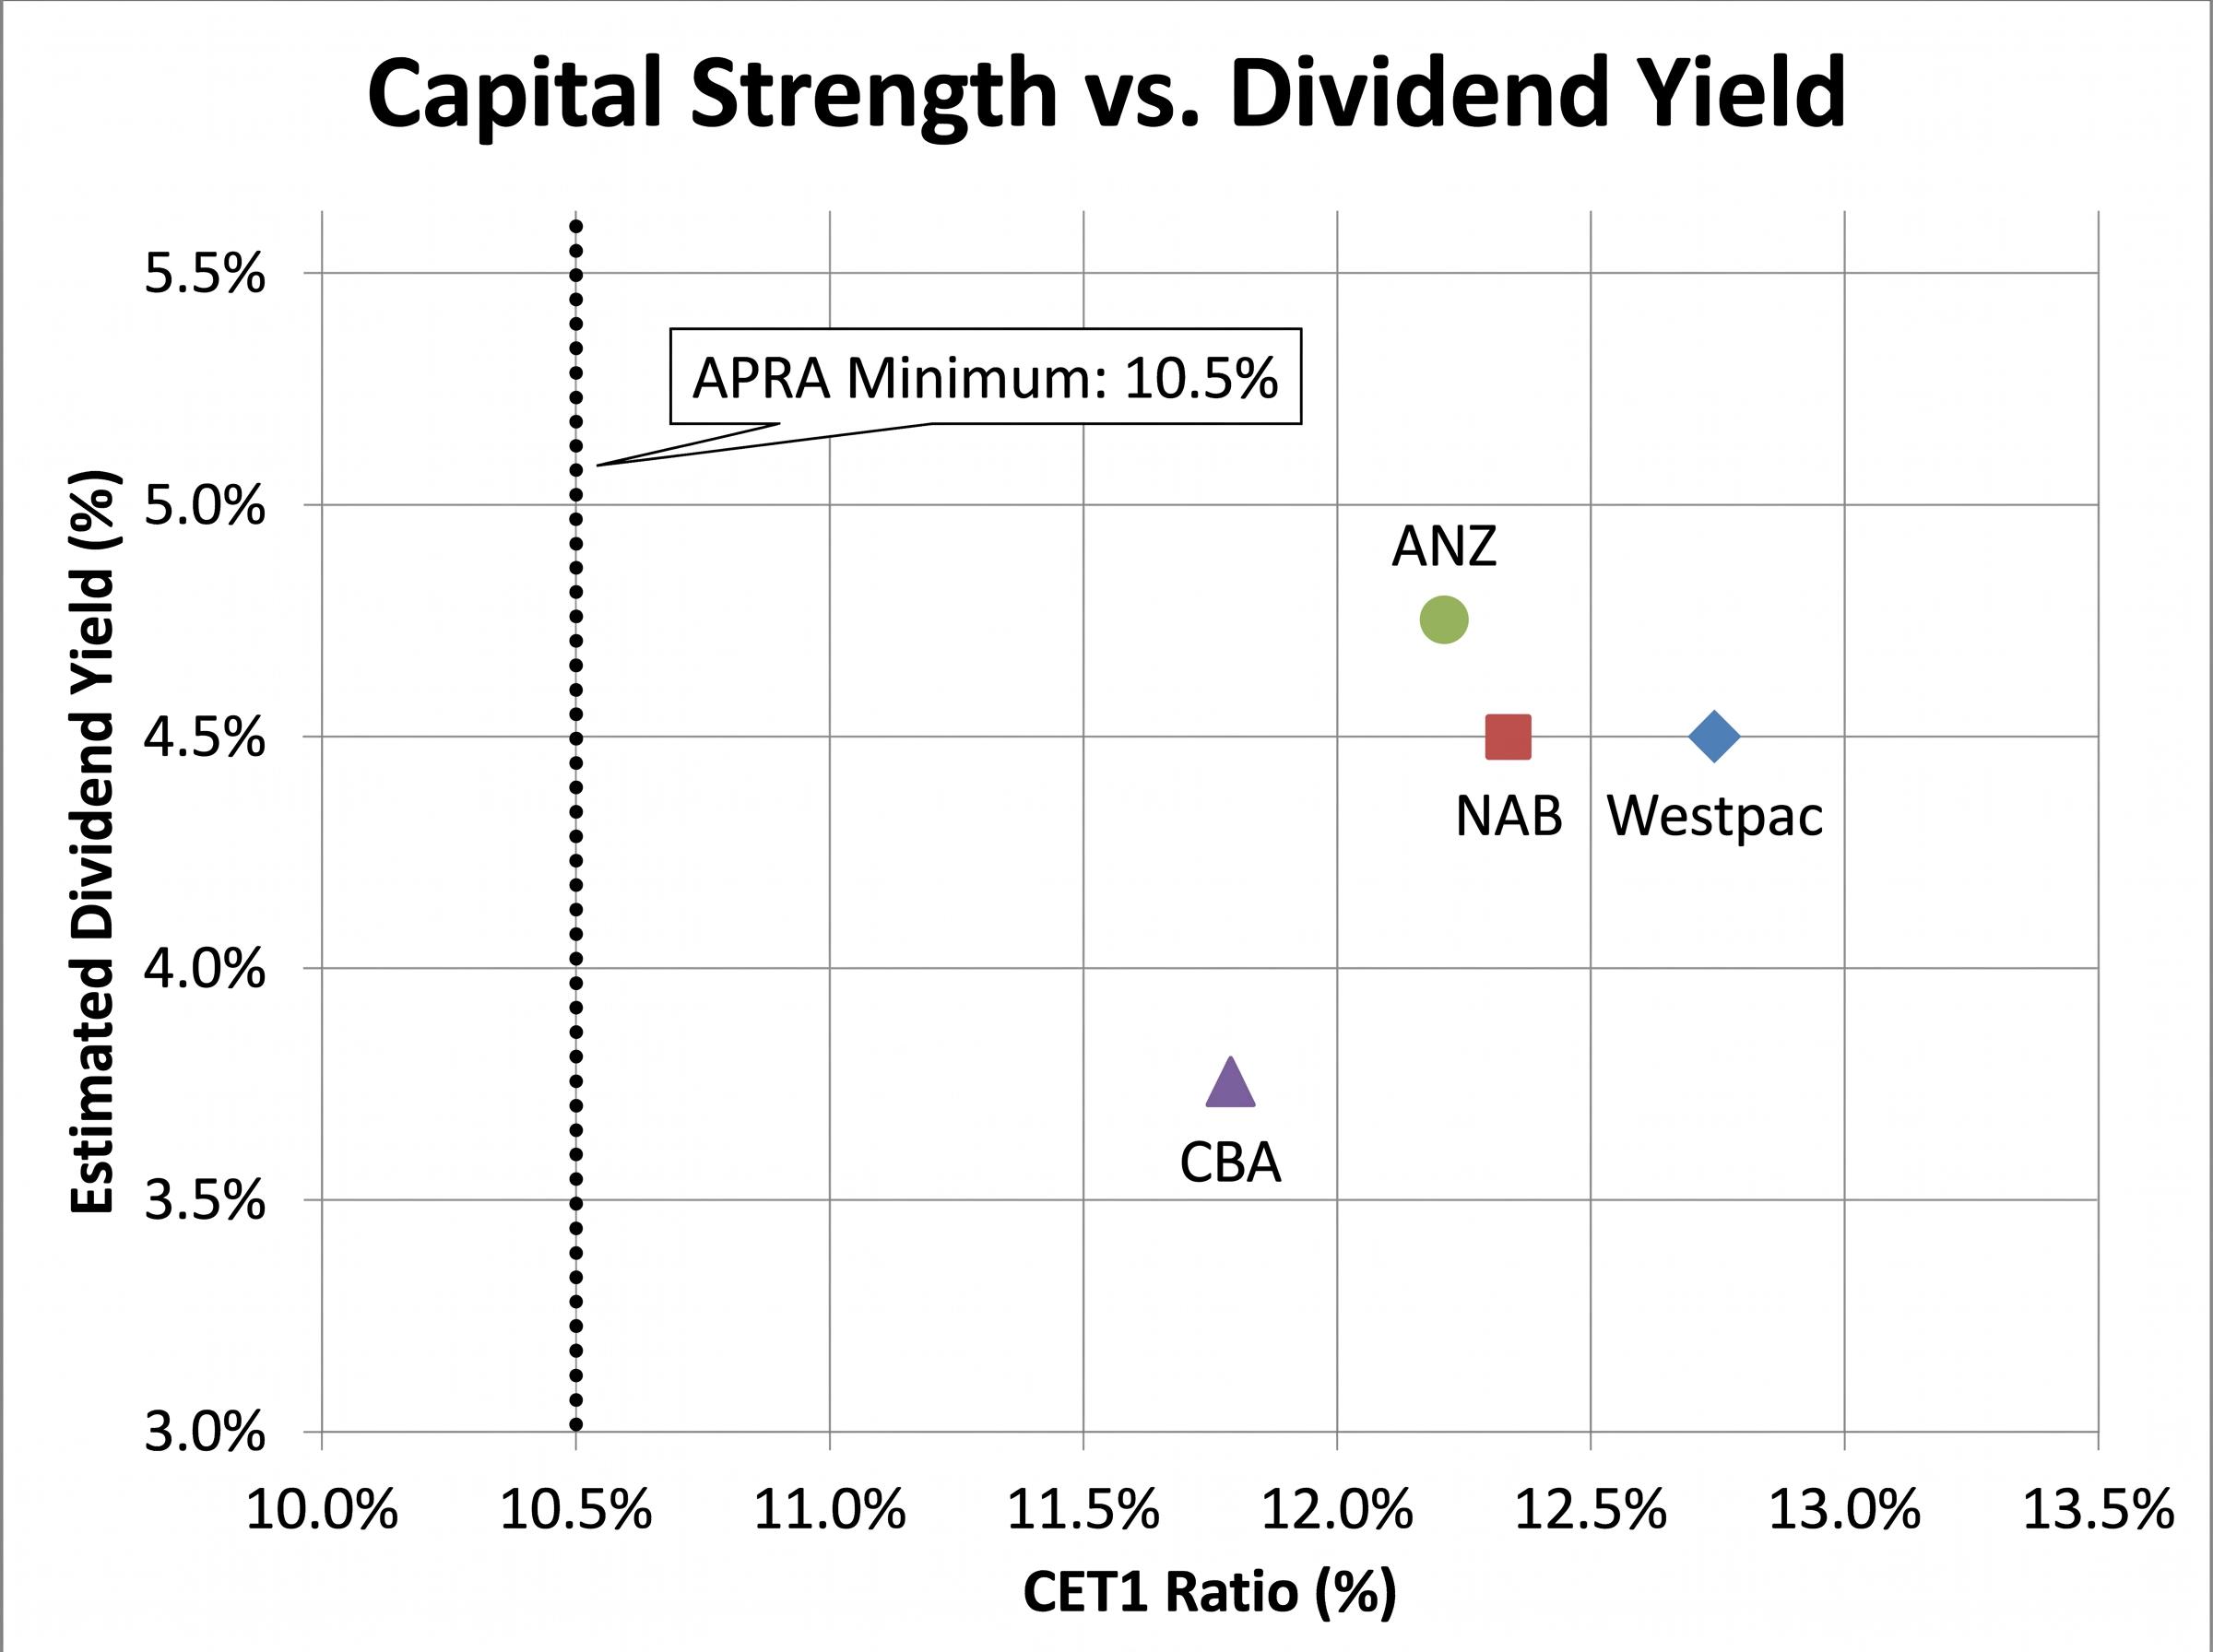
| Bank | CET1 Ratio (%) | Est. Dividend Yield (%) | Analyst Consensus Rating |
|---|---|---|---|
| Westpac | 12.69 | ~4-5 | Sell (overweight on yield) |
| NAB | 12.35 | ~4.5 | Sell / Neutral |
| ANZ | 12.2 | ~4.5-5 | Buy |
| CBA | 11.8 | ~3.5-4 | Sell |
All four banks comfortably exceed APRA’s 10.5% minimum CET1 requirement. Westpac leads the group on capital strength, which partly explains why it retains overweight positioning from some analysts despite its cost-to-income challenge. ANZ and Westpac offer the most attractive yields at current prices, while CBA’s lower yield reflects its premium valuation.
Two structural factors sit across the sector. APRA’s removal of Additional Tier 1 capital from the prudential framework is a capital planning consideration for all four banks. And the RBA’s rate trajectory, with the cash rate forecast to reach approximately 4.7% by September 2026, will boost net interest margins near term but introduces credit quality risk that income investors should weigh against yield.
Additional Tier 1 capital instruments are undergoing structural change across the Australian financial system: APRA’s decision to remove AT1 from the prudential framework creates planning complexity for major banks and their subsidiaries, with institutions including Suncorp Group pursuing new wholesale issuance structures to maintain regulatory capital buffers without immediate equity dilution.
APRA’s framework for removing Additional Tier 1 capital from the prudential framework takes effect from 1 January 2027, with a corresponding recalibration of CET1 requirements that will reshape how all four banks manage their capital buffers over the transition period.
The analytical verdict is clear on the data available: three of the Big Four carry sell-skewed consensus with material valuation gaps, while ANZ carries the most constructive skew, underpinned by a combination of yield, capital adequacy, and an earnings catalyst in the Suncorp integration.
That verdict is a snapshot, not a prediction. Broker consensus reflects analyst estimates at a point in time. RBA rate movements, credit quality deterioration, or Suncorp integration setbacks could all shift the picture. Three variables are worth monitoring across the second half of 2026:
The transmission effect of the oil price shock on financials operates through two channels: elevated CPI feeding into RBA rate decisions that compress net interest margins at the peak, and rising household debt-service costs that accelerate the credit quality deterioration analysts have flagged as the primary risk to current Big Four earnings multiples.
For a sector representing approximately 25% of the ASX 200, even passive investors carry meaningful exposure. The sell ratings on three of the four banks do not require an immediate exit, but they do warrant a clear-eyed assessment of whether current prices reflect the earnings trajectory ahead or the earnings cycle already behind.
This article is for informational purposes only and should not be considered financial advice. Investors should conduct their own research and consult with financial professionals before making investment decisions. Past performance does not guarantee future results. Broker consensus targets are forward-looking estimates subject to change based on market developments and company performance.
—
A broker consensus rating is the aggregated buy, hold, or sell recommendations from a panel of sell-side analysts, accompanied by a 12-month price target. For ASX investors, it signals whether the weight of professional opinion views a stock as fairly priced, overvalued, or undervalued relative to analyst estimates of fair value.
All three banks have seen their share prices run significantly ahead of analyst consensus price targets in 2026, with CBA up 7.79%, Westpac up 24.11%, and NAB up 19.97% year to date. Analysts believe the easy cycle gains from favourable interest rate conditions are already priced in, leaving little margin of safety at current valuations.
ANZ carries the most constructive analyst skew among the Big Four, supported by the highest dividend yield range of approximately 4.5-5%, a CET1 capital ratio of 12.2%, and an earnings catalyst from the completed Suncorp Bank acquisition. Of 16 analysts covering the stock, six hold buy or strong buy ratings and six hold ratings.
Because financials account for roughly 25% of the S&P/ASX 200 by market capitalisation, investors using passive domestic equity funds through superannuation carry concentrated exposure to the same four banks under sell scrutiny. Even without direct shareholdings, stretched valuations in CBA, Westpac, and NAB represent a material portfolio risk.
The primary risk to ANZ's positive outlook is the incomplete Suncorp Bank integration, which incurred a $196 million integration cost hit in 2024. The pace and cost of synergy realisation will determine whether ANZ's current valuation premium is justified or eroded over the coming year.