Zero-day options are no longer a niche corner of the market. These contracts, which expire on the same trading day they are bought or sold, now consistently make up more than 60% of all S&P 500 options traded, with daily notional value approaching $1 trillion on the busiest sessions.
That is a staggering pool of liquidity. It is also a mask.
Underneath the deep, easy fills sits an enormous amount of latent risk, particularly for anyone selling premium and betting the market stays quiet. When a fast intraday move arrives, that risk stops being theoretical.
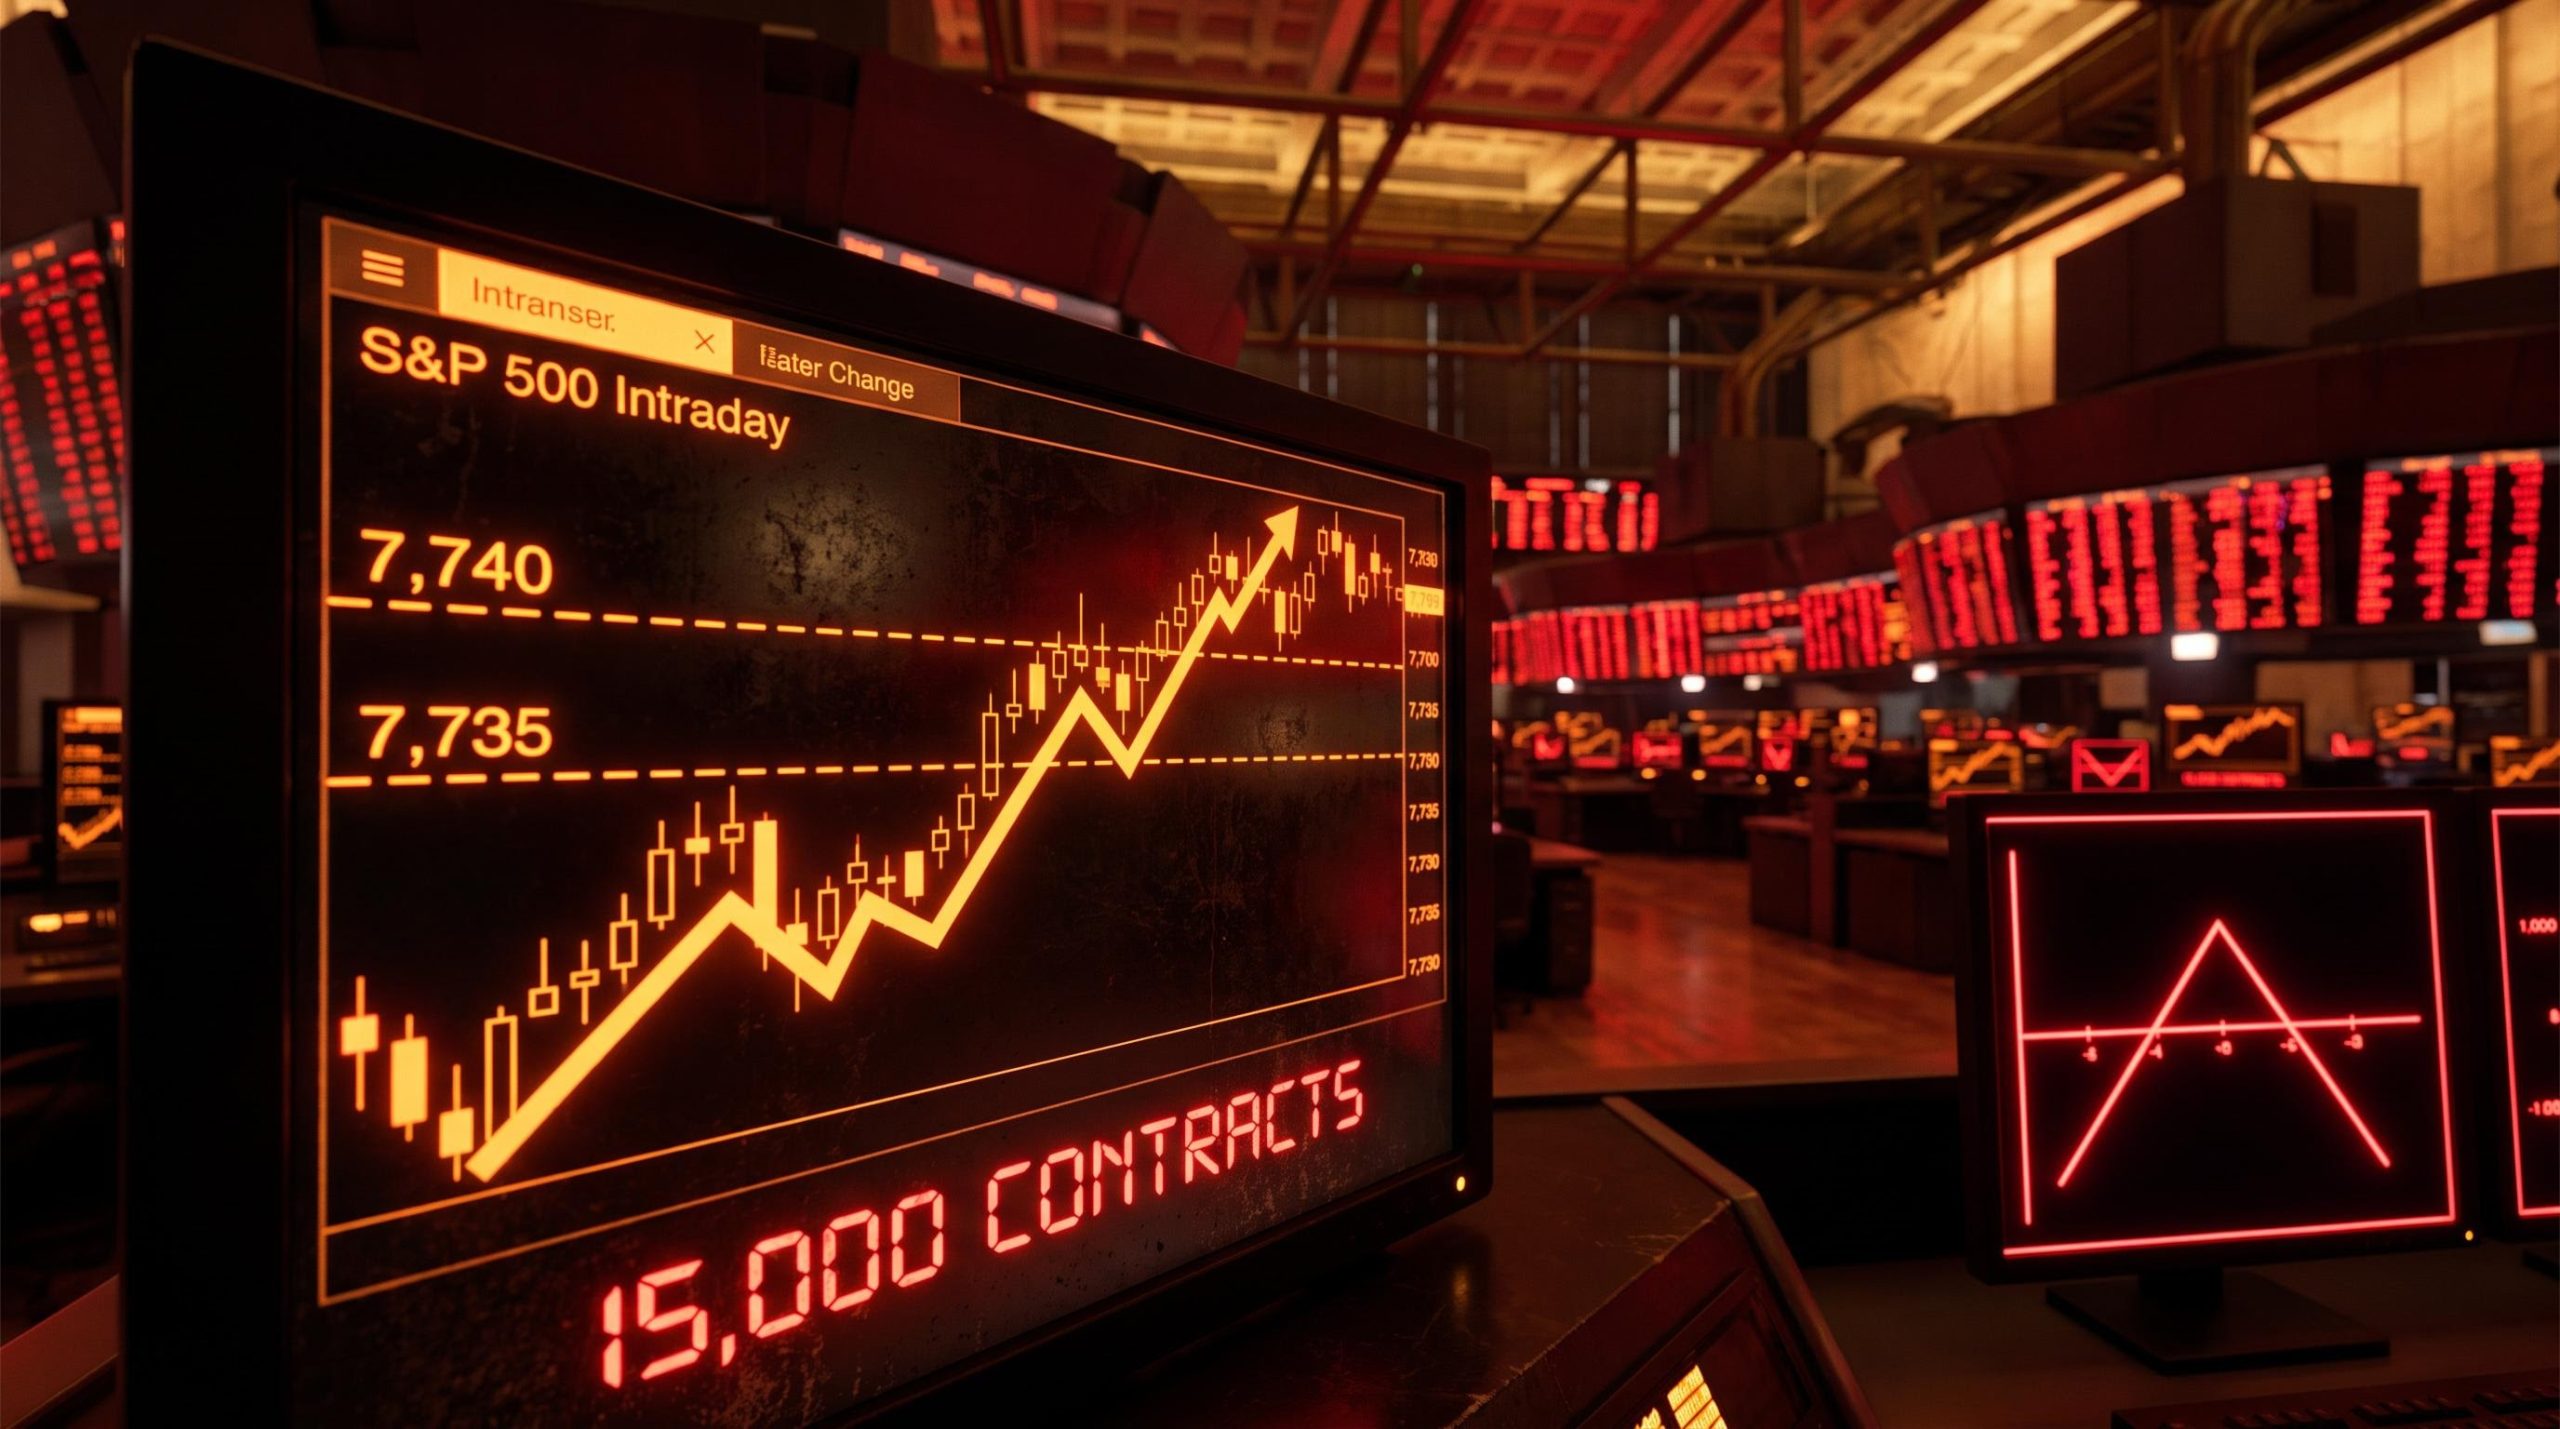
On Christmas Eve 2025, it stopped being theoretical for one very large trader. A 15,000-contract position held by a participant that flow analysts had nicknamed “Captain Condor” hit its breaking point during a sharp S&P 500 rally, and the account appears to have been effectively wiped out.
A zero DTE options blowup does not look like a slow bleed. It looks like a sudden, mathematical collapse where a defined-risk trade quietly turns into an unlimited-risk one. Here is the framework for understanding exactly how that happens, why it accelerates so fast, and how to keep it from happening to you.
Understanding the anatomy of a major institutional wipeout
The trader in question had been showing up in the flow data like clockwork. According to real-time options flow analysis by Brent Kochuba, this participant entered large call spread and condor structures around 10:00 AM on most recent sessions, building the pattern over several weeks.
The sizing was aggressive. Individual strikes carried up to 10,000 to 15,000 contracts, enough to swing profit and loss by millions of dollars on a single index move.
Then the market moved the wrong way.
A sharp rally of roughly 2% pushed the S&P 500 straight through the strikes this trader had sold. Positions were clustered around the 7,735 and 7,740 levels, and once the index breached them, the losses began compounding rather than capping out. The reason they compounded, rather than simply hitting a defined maximum, comes down to the rolling strategy, which the next section unpacks in detail.
Delta polarisation near expiry is the mechanical force that converts a moderately out-of-the-money spread into a near-binary instrument in the final hours of a same-day contract, with net delta on a spread expanding by a factor of five or more from open to close as strikes transition from ambiguous to nearly certain to expire in or out of the money.
The most telling evidence came afterward. Here is what the flow showed:
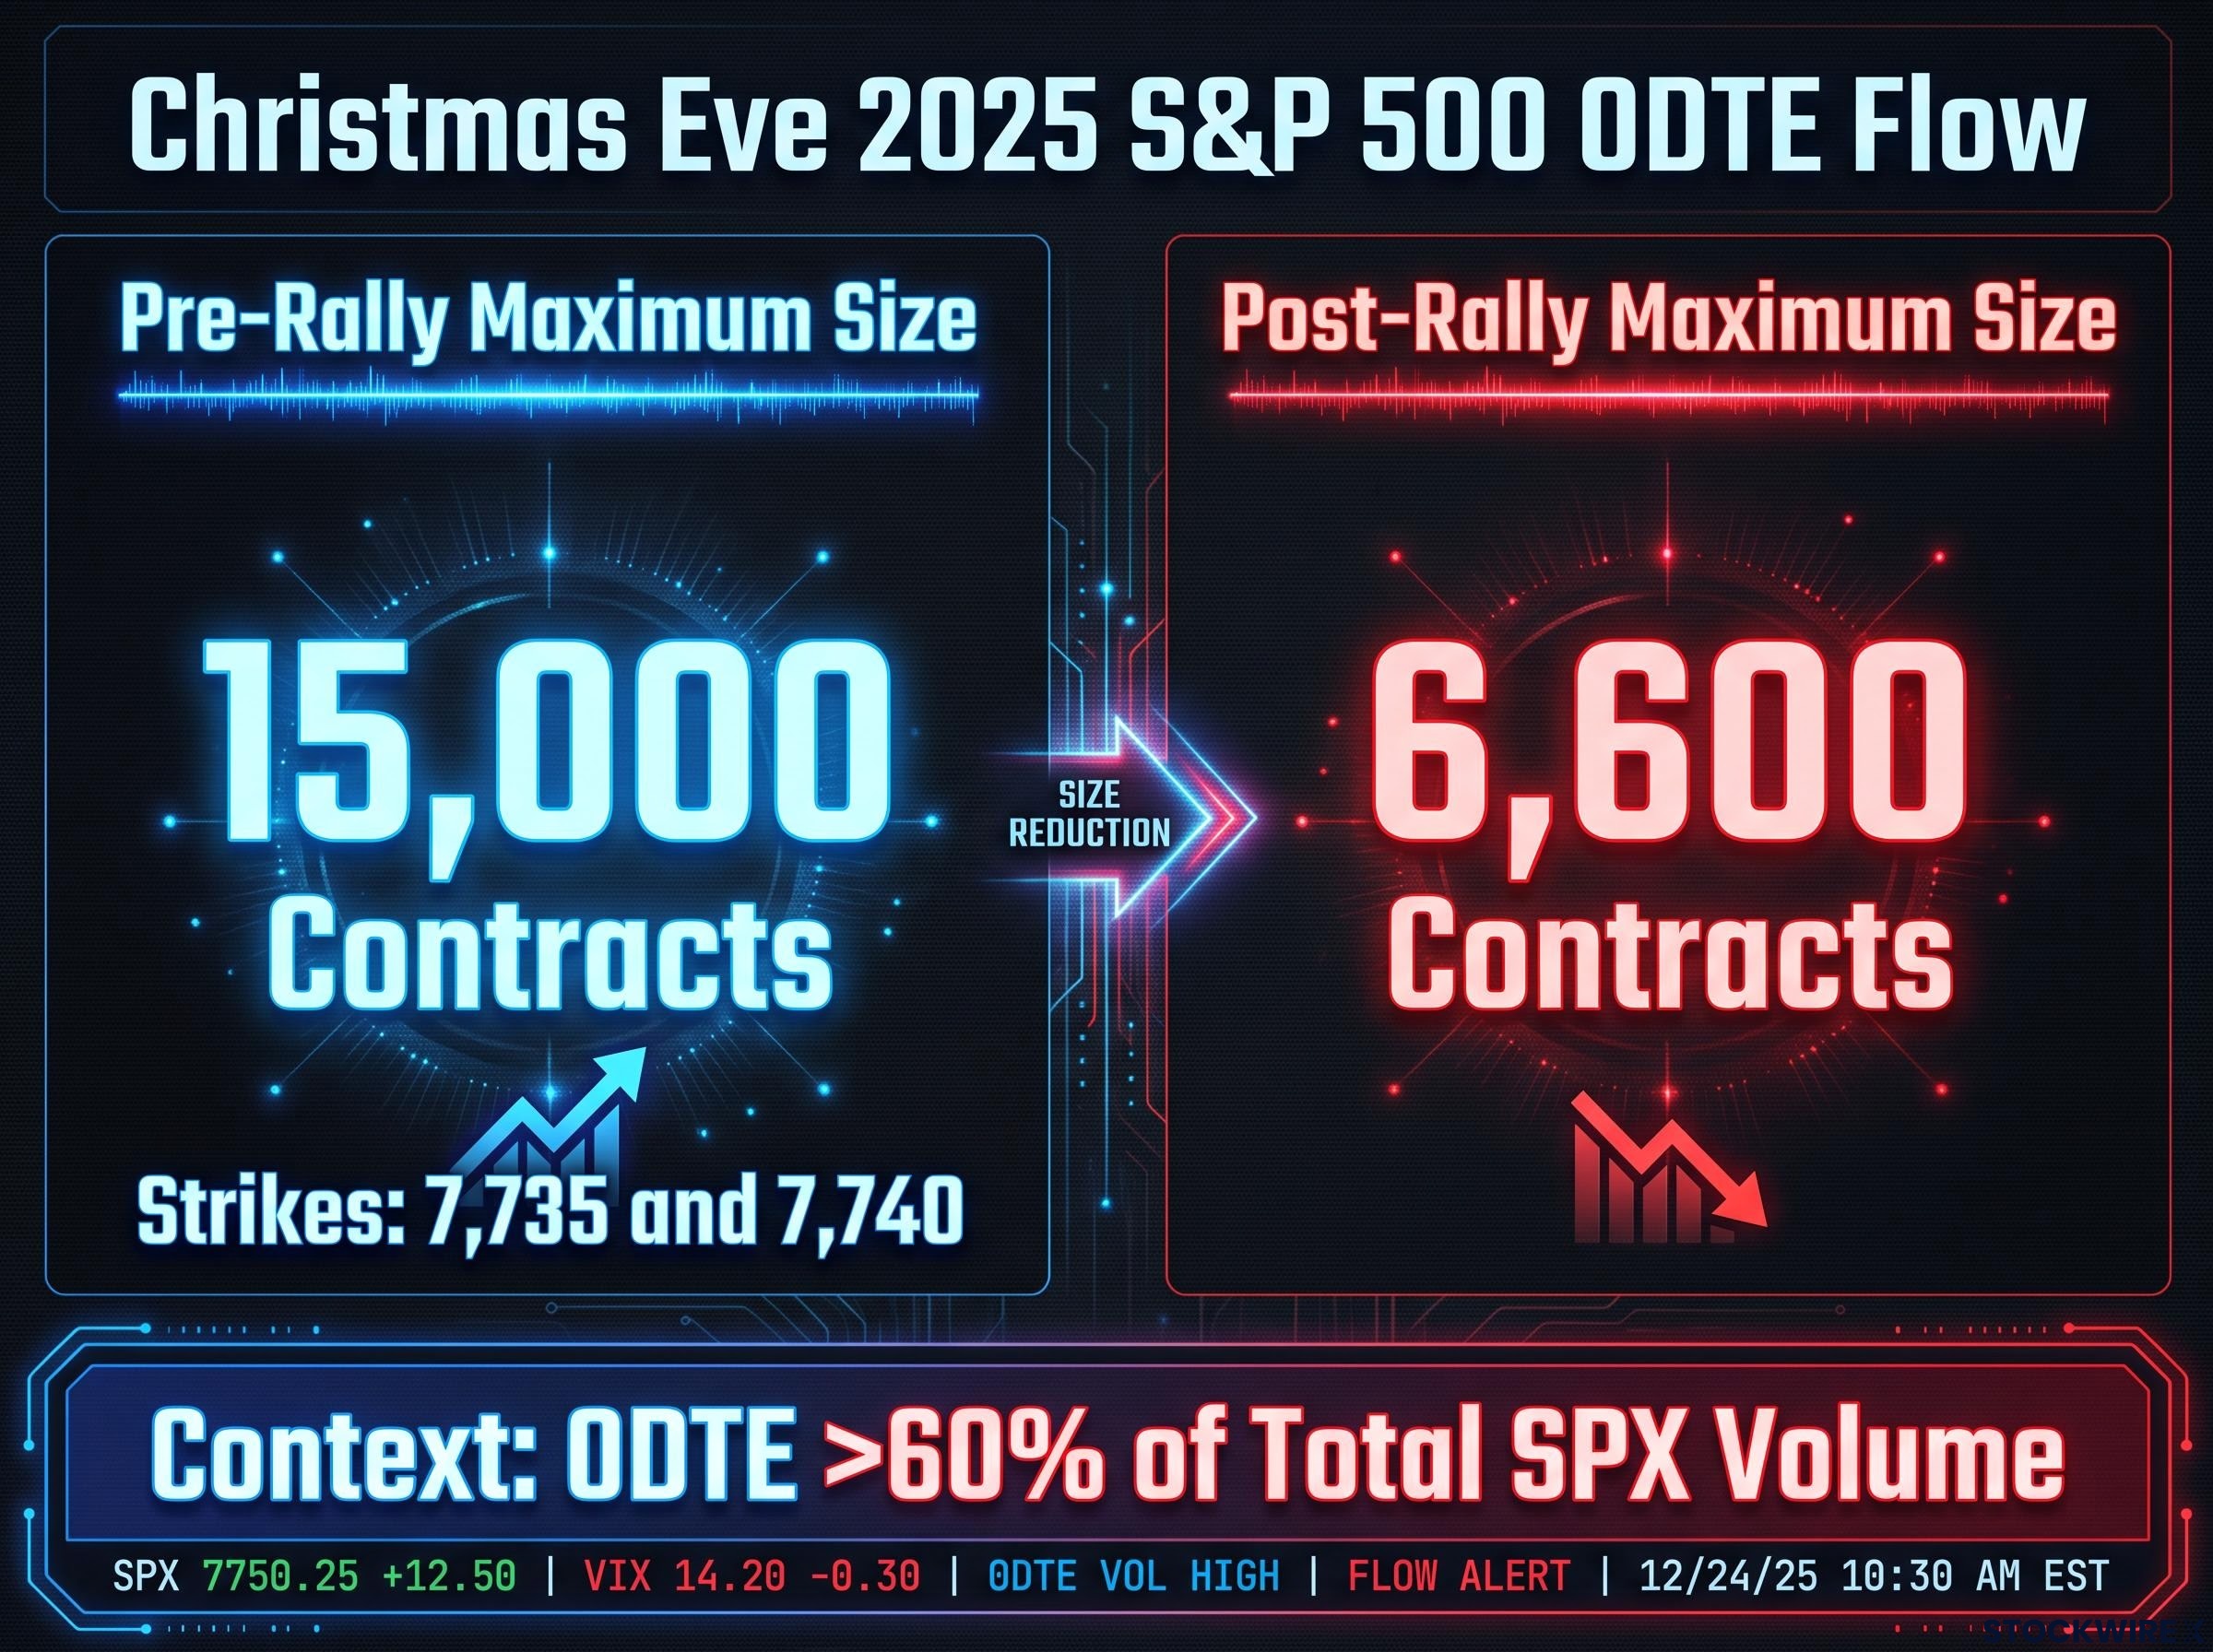
- Pre-rally short strikes concentrated around 7,735 and 7,740
- Maximum observed position size of roughly 15,000 contracts per strike
- Zero-day contracts running at over 60% of total SPX options volume, providing the liquidity to build a position this large
- In the session after the rally, no individual trade exceeded roughly 6,600 contracts
That last figure is the whole story. A trader who had been moving up to 15,000 contracts per strike suddenly could not, or would not, place anything above 6,600.
Tracking the vanished liquidity
Flow analysts track large participants by watching for distinctive contract blocks: the same size, the same time of day, the same strike structure repeating session after session. When that fingerprint appears daily and then abruptly halves, it points to a forced change in circumstances rather than a change of heart.
The disappearance signals one of two things: a broker-dealer risk limit slamming shut, or a forced liquidation that drained the capital needed to keep trading at scale.
The interpretive read for you is blunt. Even a highly capitalised participant cannot out-margin a mathematically flawed rolling strategy. Institutional sizing does not equal institutional safety, and if a 15,000-contract account can vanish in hours, your own intraday risk limits and stop-loss discipline are not optional extras. They are the only thing standing between you and the same outcome.
When big ASX news breaks, our subscribers know first
The defined-risk illusion and the martingale trap
Here is where a supposedly safe strategy turns into an account-killer. The trade that blew up was, on paper, defined-risk: every individual spread had a fixed maximum loss. The problem was never any single spread. It was what the trader did when each one started losing.
The mechanism is called rolling. When a short spread moves against you, you close it, take the loss, and open a new spread higher up, chasing the market. It feels like repair. It is actually accumulation.
The Options Clearing Corporation (OCC) warns directly about this in its standardised options risk disclosures: rolling short positions, closing losers and opening new short positions closer to the current price, can increase overall portfolio risk rather than reduce it. Here is the step-by-step progression that explains why:
- You sell a defined-risk spread with a fixed maximum loss.
- The index rallies against you, and the spread moves toward that maximum loss.
- You close the spread for a realised loss rather than letting it expire.
- You open a new spread higher up, which carries its own fresh maximum loss.
- The index keeps rallying, and you repeat, financing each roll with realised losses or more margin.
- A single large move pushes several of the stacked spreads toward their maximum loss at once, and the combined damage overwhelms your equity.
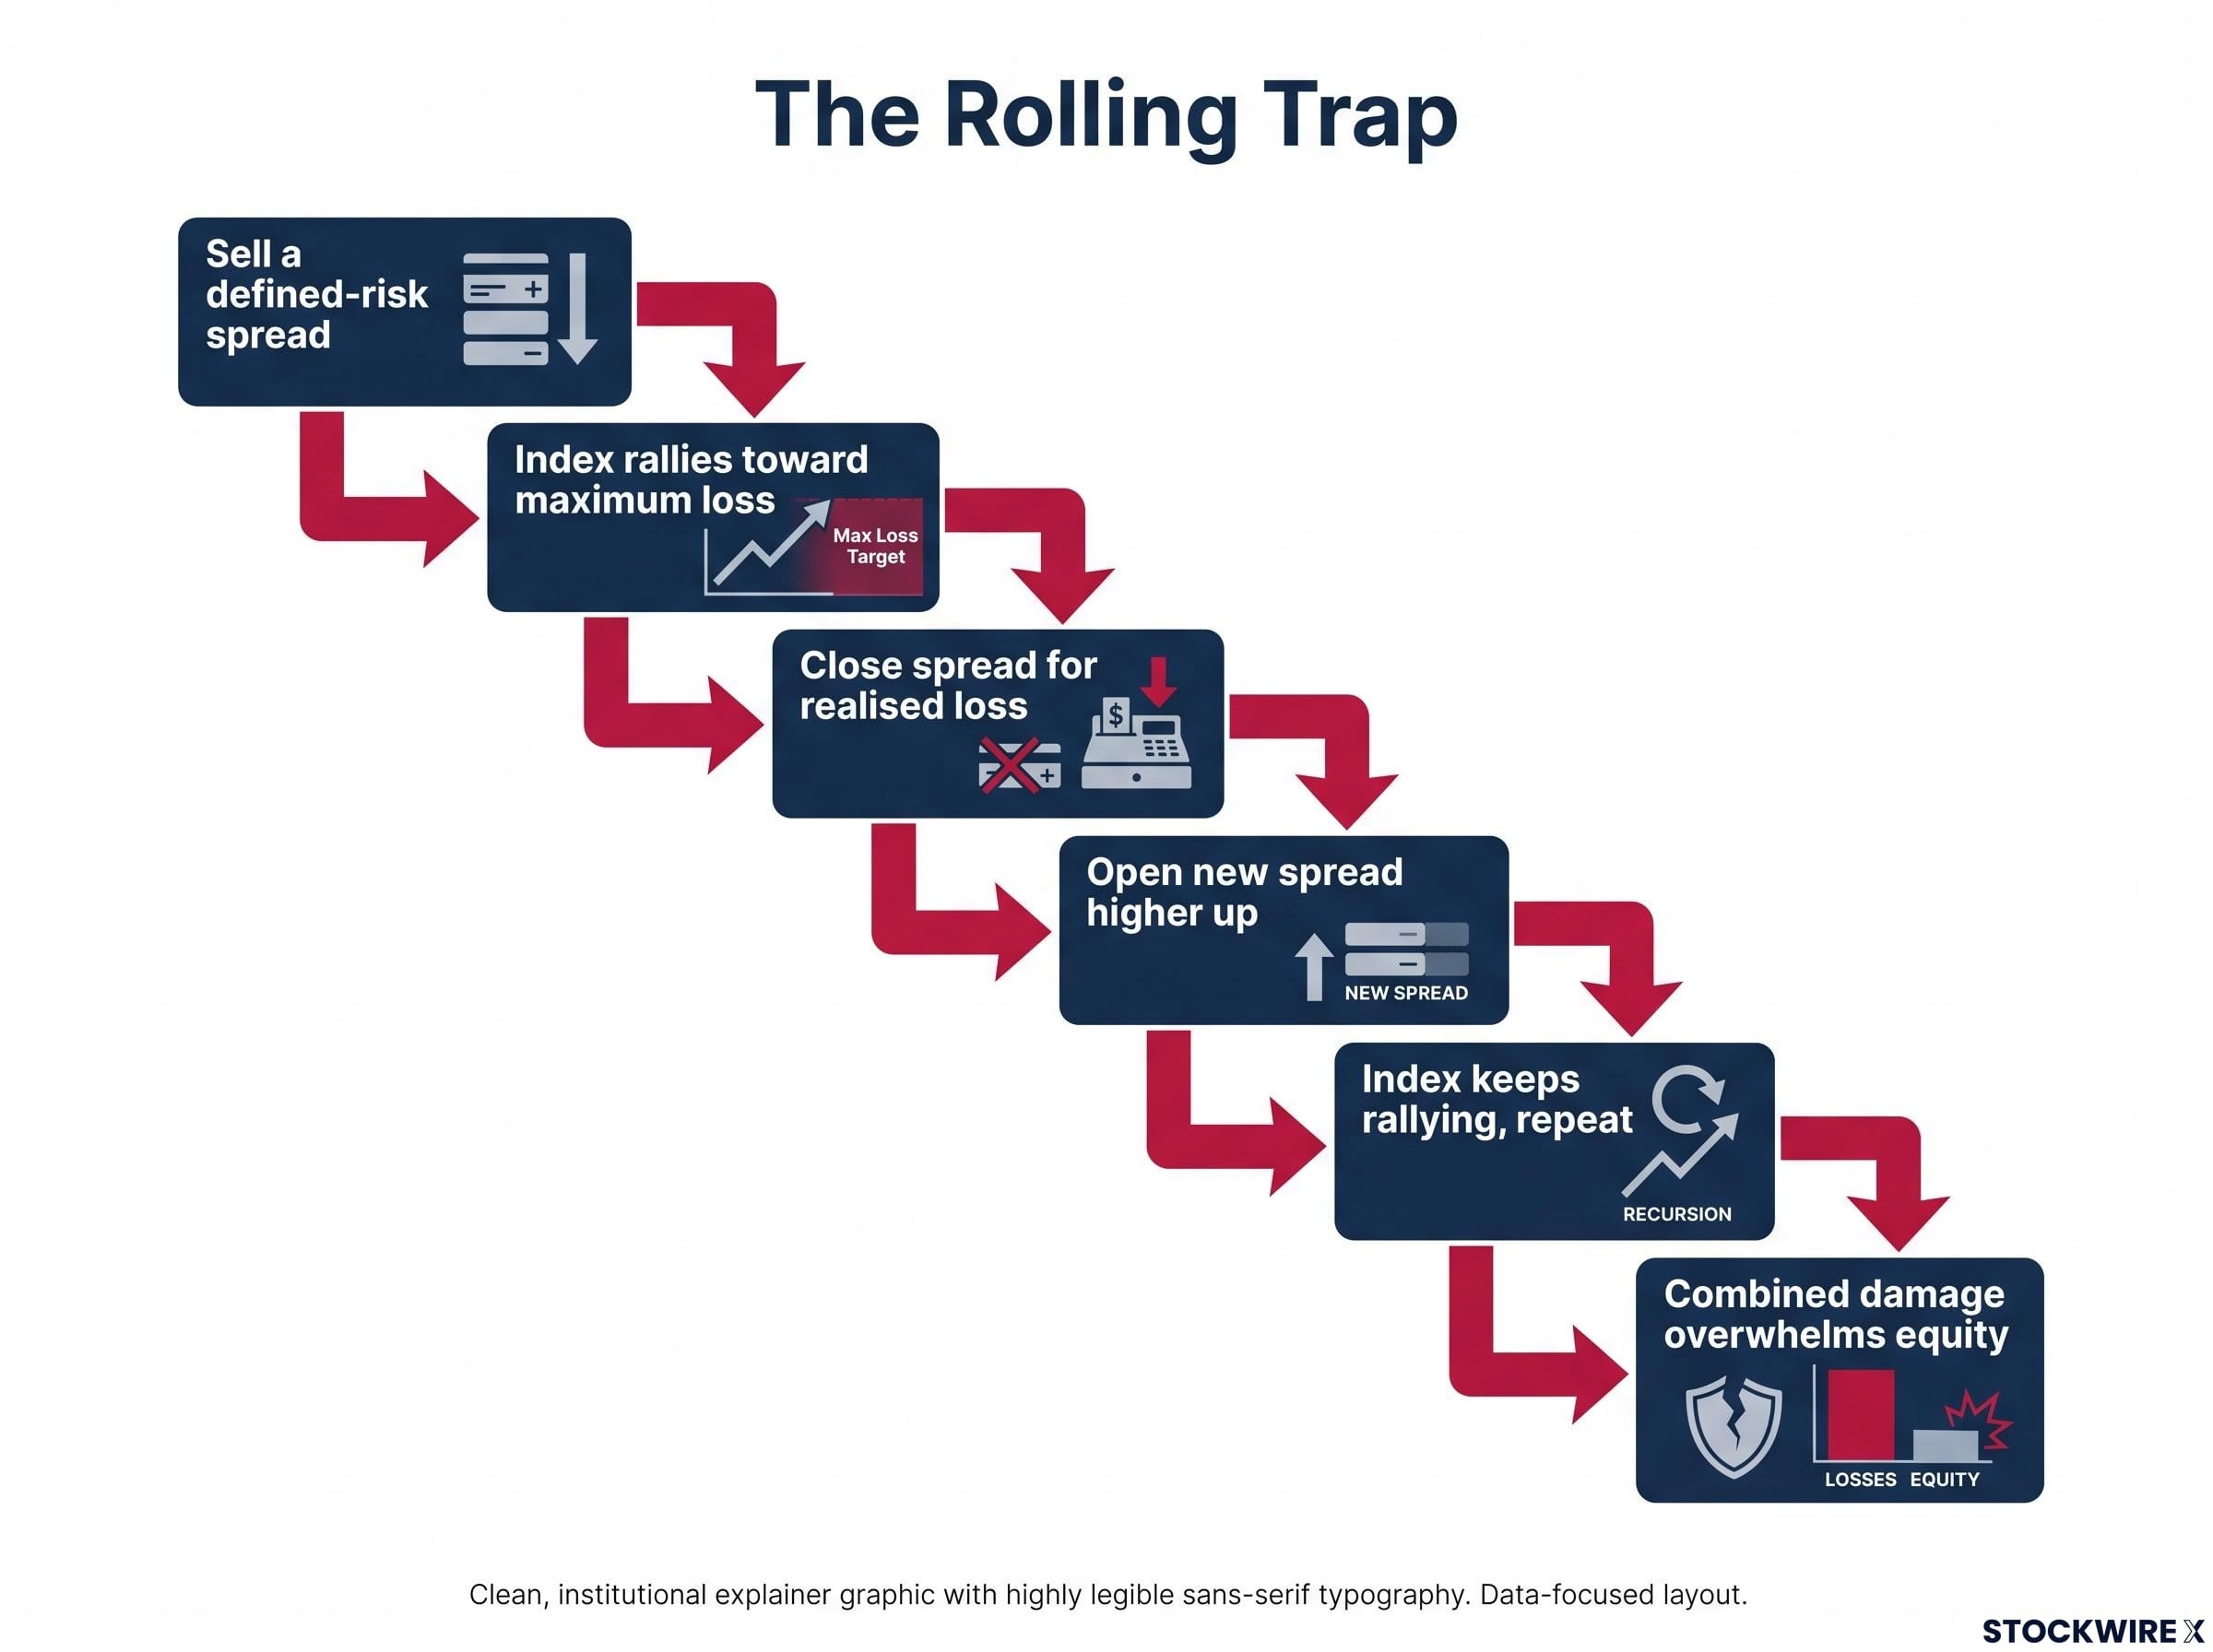
Each roll adds a new fixed loss to the pile. The word “defined” applies to each spread in isolation, but the portfolio built from all of them is anything but contained.
This is why risk educators compare the behaviour to a martingale betting system, where a gambler doubles the stake after every loss in the hope that one win recovers everything. The short-premium roller does the same thing: adds exposure as losses mount instead of cutting risk. On a trend day, when the index simply keeps going, there is no reversal to bail you out.
The academic evidence matches the warning. Research published by IBIMA Publishing on the profitability of short 0DTE index strategies found that average returns can be positive, yet the loss distribution is heavily skewed toward rare, severe losses. Translation: you collect small gains on most days and then hand back a fortune on the one day the market runs.
Premium-selling tail risk is not a theoretical concern: the Allianz Structured Alpha fund lost roughly $7 billion during March 2020 following the same pattern of collecting small gains across most sessions before a single violent move erased everything, and the $115 billion now sitting in option-based ETFs means the next event hits a larger, less experienced crowd.
For you, the lesson is precise. When you roll a losing credit spread for a debit, you are not saving the trade. You are converting a contained, planned loss into a compounding exposure that will eventually swallow your account equity. Accepting one maximum defined loss and walking away is not weakness. It is the only exit that keeps you solvent through a trend day.
When the VIX and the equity index rise together
The session that broke Captain Condor carried a second warning sign, and it was hiding in the volatility data. Normally, the Cboe Volatility Index (VIX), Wall Street’s gauge of expected 30-day S&P 500 volatility, falls when stocks rally. As the index climbs, the market rides down the skew curve and implied volatility eases.
That day, the S&P 500 and the VIX rose together. Kochuba flagged the combination as abnormal, and the mechanics behind it explain why it was dangerous.
The VIX is built from a wide set of SPX option prices, not from the index’s direction. When investors buy heavy upside calls to chase a rally while also buying puts for protection, premiums and implied volatilities can rise even as the index pushes higher. Dealers hedging all that call buying are forced to buy index exposure, driving the market up and lifting implied volatility at the same time.
Dealer gamma dynamics sit at the centre of why a calm VIX reading can precede a violent intraday spike: when a price shock flips dealer gamma from positive to negative, hedging flows accelerate in the same direction as the move, stripping the liquidity that short-premium traders need to exit at the precise moment margin calls are largest.
To see the true stress, analysts look past the headline VIX to fixed-strike implied volatility, which isolates what is happening at specific strikes rather than reflecting the skew-riding effect. The numbers from the event tell the story:
| Volatility metric | Reading | Context |
|---|---|---|
| ATM implied volatility (pre-rally) | 15.9% | At S&P near 7,400 |
| ATM implied volatility (post-rally) | 12.4% | After the 2% index move |
| Implied realised volatility (single-day move) | ~24% | Annualised from the session |
| Pre-event baseline realised volatility | ~9% | Annualised, prior conditions |
The gap between roughly 9% baseline realised volatility and the 24% implied realised volatility from that single session is the measure of how violent the day actually was. The headline at-the-money reading fell from 15.9% to 12.4%, which on its own would have looked calm.
What this means for you is a reading skill worth developing. When the VIX and the equity index climb together, dealers are scrambling to hedge huge directional flows, and that scramble makes violent intraday reversals far more likely. Learning to read the volatility surface beyond the single VIX number lets you spot structural stress before the broader crowd notices anything is wrong.
The systemic debate over same-day options flow
Zoom out, and Captain Condor stops looking like one trader’s bad day. It looks like a symptom of a market structure that a lot of serious people cannot agree on.
Cboe, the exchange that lists these contracts, takes the reassuring view. Its analysis argues that despite the vast notional volume, net dealer gamma attributable to same-day options runs at just 0.04% to 0.17% of daily S&P futures liquidity. On that reading, zero-day flow adds liquidity and flexibility without materially destabilising the broader market.
Commentators pushing the opposite case are less comforted. Firms such as SpotGamma and market outlets including EBC argue that concentrated same-day flow can pin prices around popular strikes or amplify moves once the index breaks through large open-interest clusters, creating feedback loops as dealers re-hedge. A third camp splits the difference, accepting that net dealer exposure is often modest while stressing that crowded, path-dependent positioning can still intensify moves.
Here is the uncomfortable part: the debate does not need to be settled for the danger to be real to you.
The XIV inverse-volatility note and the OptionSellers.com natural gas fund both carried defined structures and disciplined-sounding rules. Both were wiped out anyway when a single extreme move pushed clustered short positions to their limits at once. Defined termination rules do not protect you when the market moves faster than your ability to respond.
The precedents are worth remembering precisely. On 5 February 2018, the VIX spiked 115% in a single session and drove the XIV note down more than 90% before it was liquidated. That same year, OptionSellers.com rolled and adjusted short natural gas options rather than cutting exposure, and when prices spiked, multiple positions moved deep in-the-money simultaneously, margin exploded, and client accounts were effectively destroyed. The structural parallel to a rolled zero-day condor is exact.
The competing views mean you cannot rely on any institution’s assurance that the system is sound. Prepare your portfolio for sudden, unexplainable intraday volatility spikes regardless of who turns out to be right. The traders who survive these events are the ones who refuse to collect pennies in front of a steamroller.
Surviving the new era of hyper-accelerated options decay
The core lesson from Captain Condor is not complicated, but it is unforgiving. Shorting intraday premium can work for weeks, then erase everything in hours, and the only defence is emotionless discipline in taking a planned loss the moment your trade thesis breaks.
Structural change has made this permanent. With same-day contracts now dominating SPX options volume, rapid intraday margin calls on rolling strategies are not a freak event. They are a feature of the current market.
So audit your own rules before you trade another same-day expiry. Set a maximum defined loss per position and honour it. Above all, prohibit the rolling of a losing short strike, because that single habit is what turns a contained loss into an account-level wipeout.
For readers wanting to explore defined-risk alternatives to naked short spreads, our dedicated guide to butterfly and calendar spreads walks through exactly how these structures cap maximum loss at the net debit paid, with worked examples using real NDX and SPX contracts.
This article is for informational purposes only and should not be considered financial advice. Investors should conduct their own research and consult with financial professionals before making investment decisions.
Past performance does not guarantee future results. The market dynamics described here are subject to change based on conditions and various risk factors, and any forward-looking interpretation is speculative.