The traders who blew up in March 2020 were not degenerate gamblers making reckless bets. Many were running disciplined premium-selling programmes with historical win rates above 70%, collecting steady income month after month until the month that erased it all.
That gap between a strategy’s normal-regime record and its worst-case behaviour is the whole story of selling options and tail risk, and it is a story more traders are exposed to than ever before.
More than $115 billion now sits in option-based and option-overwriting ETFs, and a large cohort of retail traders entered markets only after the COVID crash. The population of short-volatility participants with no lived experience of a genuine tail event is at a historical high.
The machinery can still break. On 5 August 2024, the VIX spiked to an intraday 65.73, its largest one-day move on record, before markets steadied within days.
This piece gives you a clear-eyed account of how tail risk actually transmits through premium-selling strategies, what the historical record shows about worst-case outcomes, and what that means for how you should size and structure positions today.
Why selling options feels safe until it suddenly is not
The appeal is obvious the moment you start. You sell an option, collect the premium, and if nothing dramatic happens, you keep it. Do that consistently and the equity curve climbs in a gentle, satisfying line.
The win rates back it up. Across various market conditions, premium-selling strategies have historically posted win rates in the 65% to 75% range. That is a genuinely high hit rate, and it is exactly what lures traders in.
But a win rate tells you how often you win, not how much you lose when you lose. Premium-selling losses are not spread evenly across your losing trades. One bad month can wipe out years of accumulated gains, which means the average outcome hides a distribution where the tail does all the damage.
Here is the structural truth underneath the calm: the strategy profits from time decay and from volatility contracting. That makes it short volatility whether you frame it that way or not.
The relationship between implied vs realised volatility is the structural foundation of every premium-selling edge: sellers collect a risk premium because implied consistently exceeds realised, but that premium can invert sharply during slow-moving crises that options markets are too calm to price in advance.
Three structural features define that exposure:
- Negative gamma: as the underlying moves against you, your losses accelerate rather than growing in a straight line.
- Volatility-sensitive margin: the capital your broker demands expands precisely when volatility spikes and your position is already hurting.
- No natural loss ceiling: an undefined-risk position, such as a naked short call or put, has no floor on how large the loss can grow.
The trap is that the calm which makes the strategy look safe is the same condition that quietly pushes your position sizing toward maximum exposure. As volatility compresses, margin requirements shrink, so the same account can carry more contracts. You are most exposed exactly when the market feels least threatening.
Scale amplifies all of this. Option-based ETF assets have grown by over 600% in three years to around $115-120 billion, and major dealers have absorbed risk onto their balance sheets, suppressing volatility. Low volatility encourages more short-volatility positioning, which suppresses volatility further, until the loop breaks.
Regulators have noticed how badly this can go at the retail level.
India’s securities regulator SEBI now requires trading platforms to display a stark warning: “9 out of 10 traders are losing money in options.”
That is not a comment on premium-selling specifically, but it is a real regulatory signal of how the mechanics play out across a large population.
When big ASX news breaks, our subscribers know first
What negative gamma actually does to a position when volatility spikes
On your screen, the spike starts as something small. A position that was quietly decaying in your favour ticks red. Then the red deepens faster than the underlying’s move seems to justify. That acceleration is negative gamma at work, and understanding it is the difference between managing risk and being managed by it.
Negative gamma means your position’s delta, its sensitivity to the underlying’s price, worsens as the market moves against you. Sell a call and the stock rallies, and you become progressively shorter as it climbs. Your losses do not grow in a straight line; they compound.
The negative gamma dynamics that accelerate losses during a spike are the same mechanics that cause liquidity to collapse at concentrated strikes, as dealer hedging flows in the same direction as the market move rather than absorbing it, removing the exit capacity sellers need most.
The danger sharpens when the position is undefined-risk. A naked short call has no ceiling on its loss. If a stock you sold calls against runs from $100 to $150, a single 100-share contract produces a $5,000 loss (an illustrative figure) against a premium that was only a fraction of that.
Market microstructure makes it worse. When short-dated open interest is large relative to average daily volume, thin liquidity at concentrated strikes amplifies directional moves, so the very positioning that felt crowded and safe becomes the accelerant.
The margin call as a tail-risk amplifier
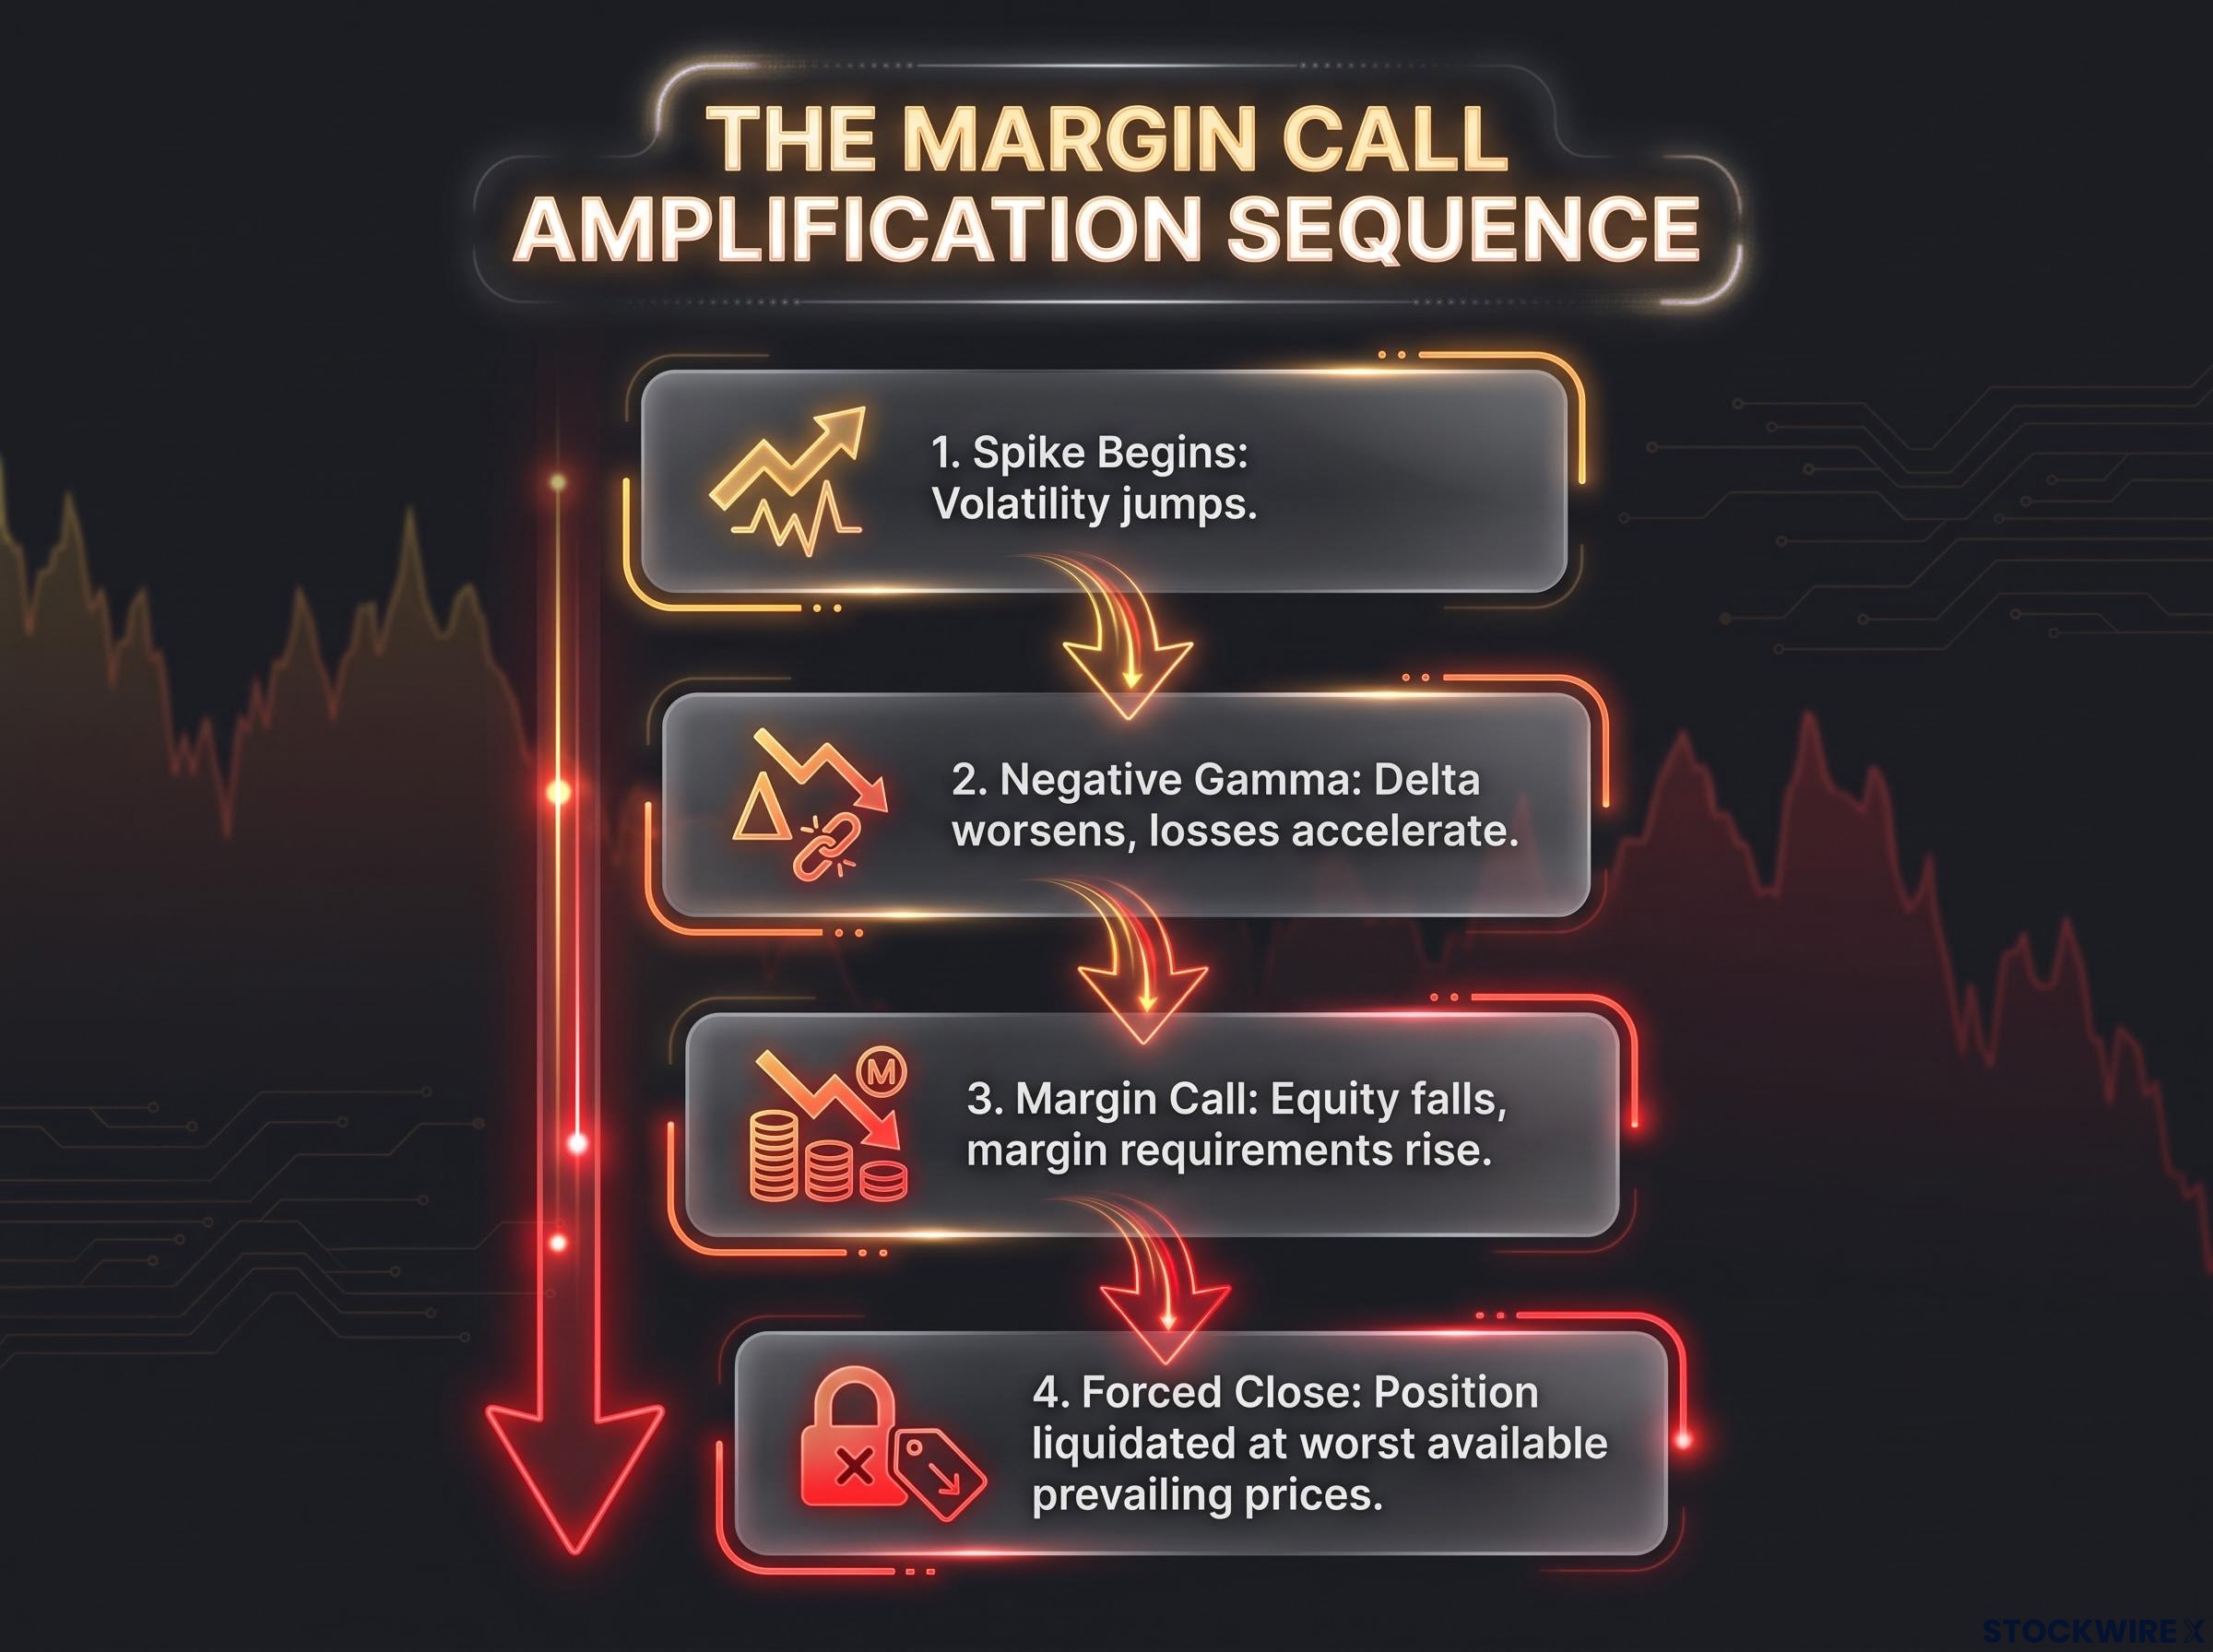
The second layer is the feedback loop between losses and margin. It runs in a predictable sequence:
- The spike begins, and volatility jumps.
- Negative gamma worsens your delta, and losses accelerate.
- Those losses reduce your account equity while margin requirements on the surviving position rise, and a margin call is issued.
- The position is force-closed at prevailing prices, which in a fast market are the worst available.
The important detail is that a margin call does not wait for a rational exit. It executes at whatever the market is offering, and during a spike that is the trough. This is how paper losses become permanent losses: the forced close locks in the maximum drawdown at the exact moment you would most want to hold on.
For you, this reframes the entire risk picture. Your worst-case outcome is not fixed at entry. It is decided at the moment you are forced to close, and that moment is chosen by your broker, not by you. Once you internalise that, you stop measuring risk by the credit you collected and start measuring it by the maximum damage a forced close could inflict on your account.
Three volatility events, three lessons about what tail risk looks like in practice
The blow-ups look like separate disasters until you line them up. Viewed together, three events reveal not random bad luck but a recurring mechanical sequence, each one adding a dimension to what tail risk actually looks like.
February 2018, remembered as Volmageddon, was the foundational case. On 5 February 2018 the VIX more than doubled in a single session, and inverse-VIX products such as XIV and SVXY lost more than 90% in that one day. It proved that short-vol positioning and VIX futures buying form a real, self-reinforcing feedback loop that can break the liquidity of the futures curve.
March 2020 was the institutional-scale lesson. This was not amateurs. Allianz Structured Alpha, a professionally managed short-volatility programme with risk teams and stress tests, suffered roughly $7 billion in investor losses because its short put spreads carried insufficient hedges when implied volatility ran far beyond anything the models had stressed.
Alberta’s public fund AIMCo lost about C$2.1 billion trading volatility and subsequently shut down its aggressive volatility unit.
The Canada Pension Plan Investment Board lost around C$700 million on its volatility strategy in the same episode. And a retail trader short $10,000 of UVXY at $18 faced an unrealised loss above $34,000 when UVXY hit $80, with margin calls forcing many out at the worst prices. Tail risk did not discriminate by sophistication.
August 2024 was the warning shot, and arguably the most dangerous kind of event because of how it ended.
| Event | Date | Peak VIX / Key Metric | Notable Loss Outcome |
|---|---|---|---|
| Volmageddon | 5 February 2018 | VIX more than doubled in one session | XIV and SVXY lost over 90% in a single day |
| COVID crash | March 2020 | Sustained volatility expansion | Allianz Structured Alpha lost ~$7B; AIMCo lost ~C$2.1B |
| Yen carry unwind | 5 August 2024 | Intraday VIX 65.73, close 38.57 | $4.1B erased from short-vol ETFs; SVIX fell 56.35% |
On that August day the VIX printed an intraday high of 65.73 and closed at 38.57. Investors in the 10 largest short-volatility ETFs saw $4.1 billion of returns erased from year-to-date highs, with SVIX falling 56.35%, SVXY falling 34.81%, and ZIVB falling 23.97%. Then markets recovered quickly.
That fast recovery is precisely the problem for you. It does not mean tail risk is fading. It means the next spike will find an even larger population of short-volatility participants who have only ever seen losses that reversed within days, and that untested crowd is what makes the next event more dangerous, not less.
Does entering after a spike make the strategy safer?
Here is the natural next question. If being caught short before a spike is the disaster scenario, surely selling into elevated volatility is safer? The premiums are richer, so you collect more credit and enjoy a bigger buffer before the position turns to a net loss.
The logic is sound as far as it goes. A larger credit genuinely does push the break-even point further out.
But the timing is more complicated than the premium alone suggests. Historically, a large single-day market move is frequently followed by another significant move within roughly two weeks. Open a fresh position into that window and you can face a second-leg shock almost immediately.
Practitioners converge on a clear view of when the risk is worst.
- Already short when the spike begins: the most dangerous position of all, because you absorb compounding gamma losses and margin pressure with no chance to reprice.
- Entering while the VIX is still rising: high-risk, because you are selling into a move that may still be accelerating.
- Entering after the VIX peaks and begins declining: the practitioner-preferred window, though a second leg can still catch you.
One common heuristic for spotting the turn is waiting for the VIX to close below its 10-day moving average, though this is a rule of thumb rather than a guaranteed signal.
The VIX futures curve provides a forward-looking dimension the spot VIX number cannot: a curve in contango signals that the volatility market is not pricing an imminent systemic event, while backwardation magnitude historically tracks crash severity directly, with the COVID crash producing roughly 15 points of inversion against only 4-5 points during tariff-related scares.
The post-COVID calm as a risk factor in its own right
There is a further complication that works against you quietly. Since 2020, very large down days have been less frequent, which has partially restored the intuitive link between higher-volatility entry and better outcomes. That is a regime observation, not a structural guarantee.
The trouble is what that calm trains. A generation of traders has learned to expect volatility spikes to reverse fast, and that expectation is exactly the bias that gets them positioned for the second leg. They enter too early, confident the worst has passed.
The 600% growth in option-based ETF assets over three years compounds the danger. More capital short volatility means more forced buying when a spike hits, which deepens the spike. The benign regime does not shrink tail risk; it enlarges the crowd standing in front of it.
Building a framework for tail risk that survives the event you did not model
Enough about what went wrong. The useful question is what you do differently, and the honest answer is that surviving tail risk is less about prediction than about a handful of structural decisions made before any spike arrives.
Start with the one variable fully in your control: how much notional exposure you carry. The most common structural error is sizing to your broker’s margin requirement rather than to the maximum loss the position could actually produce. Margin can evaporate in a crisis; the loss cannot.
Consider a three-part framework:
- Size to maximum potential loss, not margin. Ask what the position loses in a genuine tail move, and size so your account survives that number.
- Prefer defined-risk structures. A spread, unlike a naked position, caps your loss ceiling the moment you open it. The structural point is that undefined-risk positions demand far higher margin and carry an unbounded loss, whereas a spread fixes the worst case in advance and removes the broker-controlled forced close from the sequence entirely.
- Stress-test against the event you cannot model. Assume a spike lands on the worst possible day, when your positions sit at maximum negative delta, and ask whether the account still stands.
The structural case for put spreads vs naked short puts is most visible in drawdown episodes: during the April 2025 selloff, naked short put positions produced approximately 1.7 times the losses of comparable spread structures, and a win-rate differential of just 2% was sufficient to erase the entire multi-year performance advantage of the naked strategy.
That third point is where even the professionals failed. Allianz Structured Alpha ran modelled stress tests and still carried insufficient hedges when volatility exceeded every scenario it had prepared for.
The Allianz Structured Alpha outcome, roughly $7 billion in investor losses, is the cost of trusting a modelled stress test that underestimated how severe volatility could become.
August 2024 confirmed the point in the present tense. The system can still generate a VIX above 65 in the supposedly calm post-COVID era, which means pre-2020 tail events are not obsolete history.
For you, the takeaway is direct. Sizing to maximum potential loss rather than to margin is the single most important tail-risk decision available, because it is the one that strips the broker-controlled forced close out of the sequence before it can ever begin.
What the historical record actually tells traders about selling options in a world that has already surprised once
The record does not say premium-selling is broken. It says the strategy’s risk profile is regime-dependent and left-tail-heavy in a way that neither a 65-75% win rate nor a few years of recent performance will ever reveal to you.
A win rate measures how often you win. It is silent on how much you lose in the sessions that matter, and those sessions are where the entire distribution lives.
The structural context makes the point urgent. The population of short-volatility participants who entered after 2020 has only experienced one side of the distribution, so their intuitions about worst-case outcomes are calibrated on incomplete evidence. They know the recoveries. They have never sat through the version that did not recover.
Size compounds this. At roughly $115-120 billion in option-based ETF assets, the system is larger than it has ever been, and scale amplifies the forced-buying cascade when a spike hits.
J.P. Morgan’s ETF research tracks the scale of this growth directly: assets in U.S. options-based ETF strategies rose roughly 50% year over year to approximately $280 billion as of mid-2026, a figure that underscores how much additional forced-buying pressure now sits behind any future spike.
August 2024 is the most useful recent signal precisely because of how it resolved. The intraday VIX of 65.73 approximately 25 months ago was large enough to be a genuine warning, but brief enough that most traders absorbed it without reconsidering their architecture. That combination, a real shock quickly forgotten, is the exact condition that tends to precede a more damaging event.
The decision that determines whether you survive a spike is made before it arrives: sizing to your maximum potential loss rather than to your margin requirement.
The question is not whether a tail event will occur. It is whether your current position architecture would survive one, and that answer is fixed before the spike, not during it.
This article is for informational purposes only and should not be considered financial advice. Investors should conduct their own research and consult with financial professionals before making investment decisions.
Past performance does not guarantee future results. Financial projections are subject to market conditions and various risk factors.