What Social Media Stock Promotions Actually Do to Prices
2 hrs ago
HUB24 has grown revenue at a compound annual rate of 44.4% over three years and nearly quintupled its net profit from $10 million to $47 million between FY21 and FY24. Its share price, at approximately $80.71 as of 15 May 2026, sits 33.7% below the 52-week high of roughly $122. So is it cheap, or still expensive? The answer depends entirely on which valuation metrics an investor uses to assess it. Many Australian investors reach for the same toolkit they apply to banks and blue chips: dividend yield, a single year of return on equity (ROE), and a trailing price-to-earnings (PE) ratio. For a company like HUB24, those tools produce a distorted picture. The stock either looks dangerously overpriced on a static PE basis or gets filtered out entirely because the dividend yield is negligible. This article explains why the standard metrics mislead when applied to growth-oriented wealth technology platforms, and walks through the trend-based framework better suited to evaluating them. HUB24’s actual financials serve as the live case study throughout.
The numbers tell two stories at once. HUB24’s trailing twelve-month (TTM) PE ratio is approximately 62.6x, nearly double the peer average of roughly 34.1x. Its five-year trailing dividend yield is minimal. On those screens, the stock looks either unaffordable or uninvestable.
Then the operational data arrives. A three-year revenue compound annual growth rate (CAGR) of 44.4%. Net profit expanding from $10 million to $47 million over the same period to FY24. A share price that has fallen 33.7% from its 52-week high despite those growth metrics remaining intact.
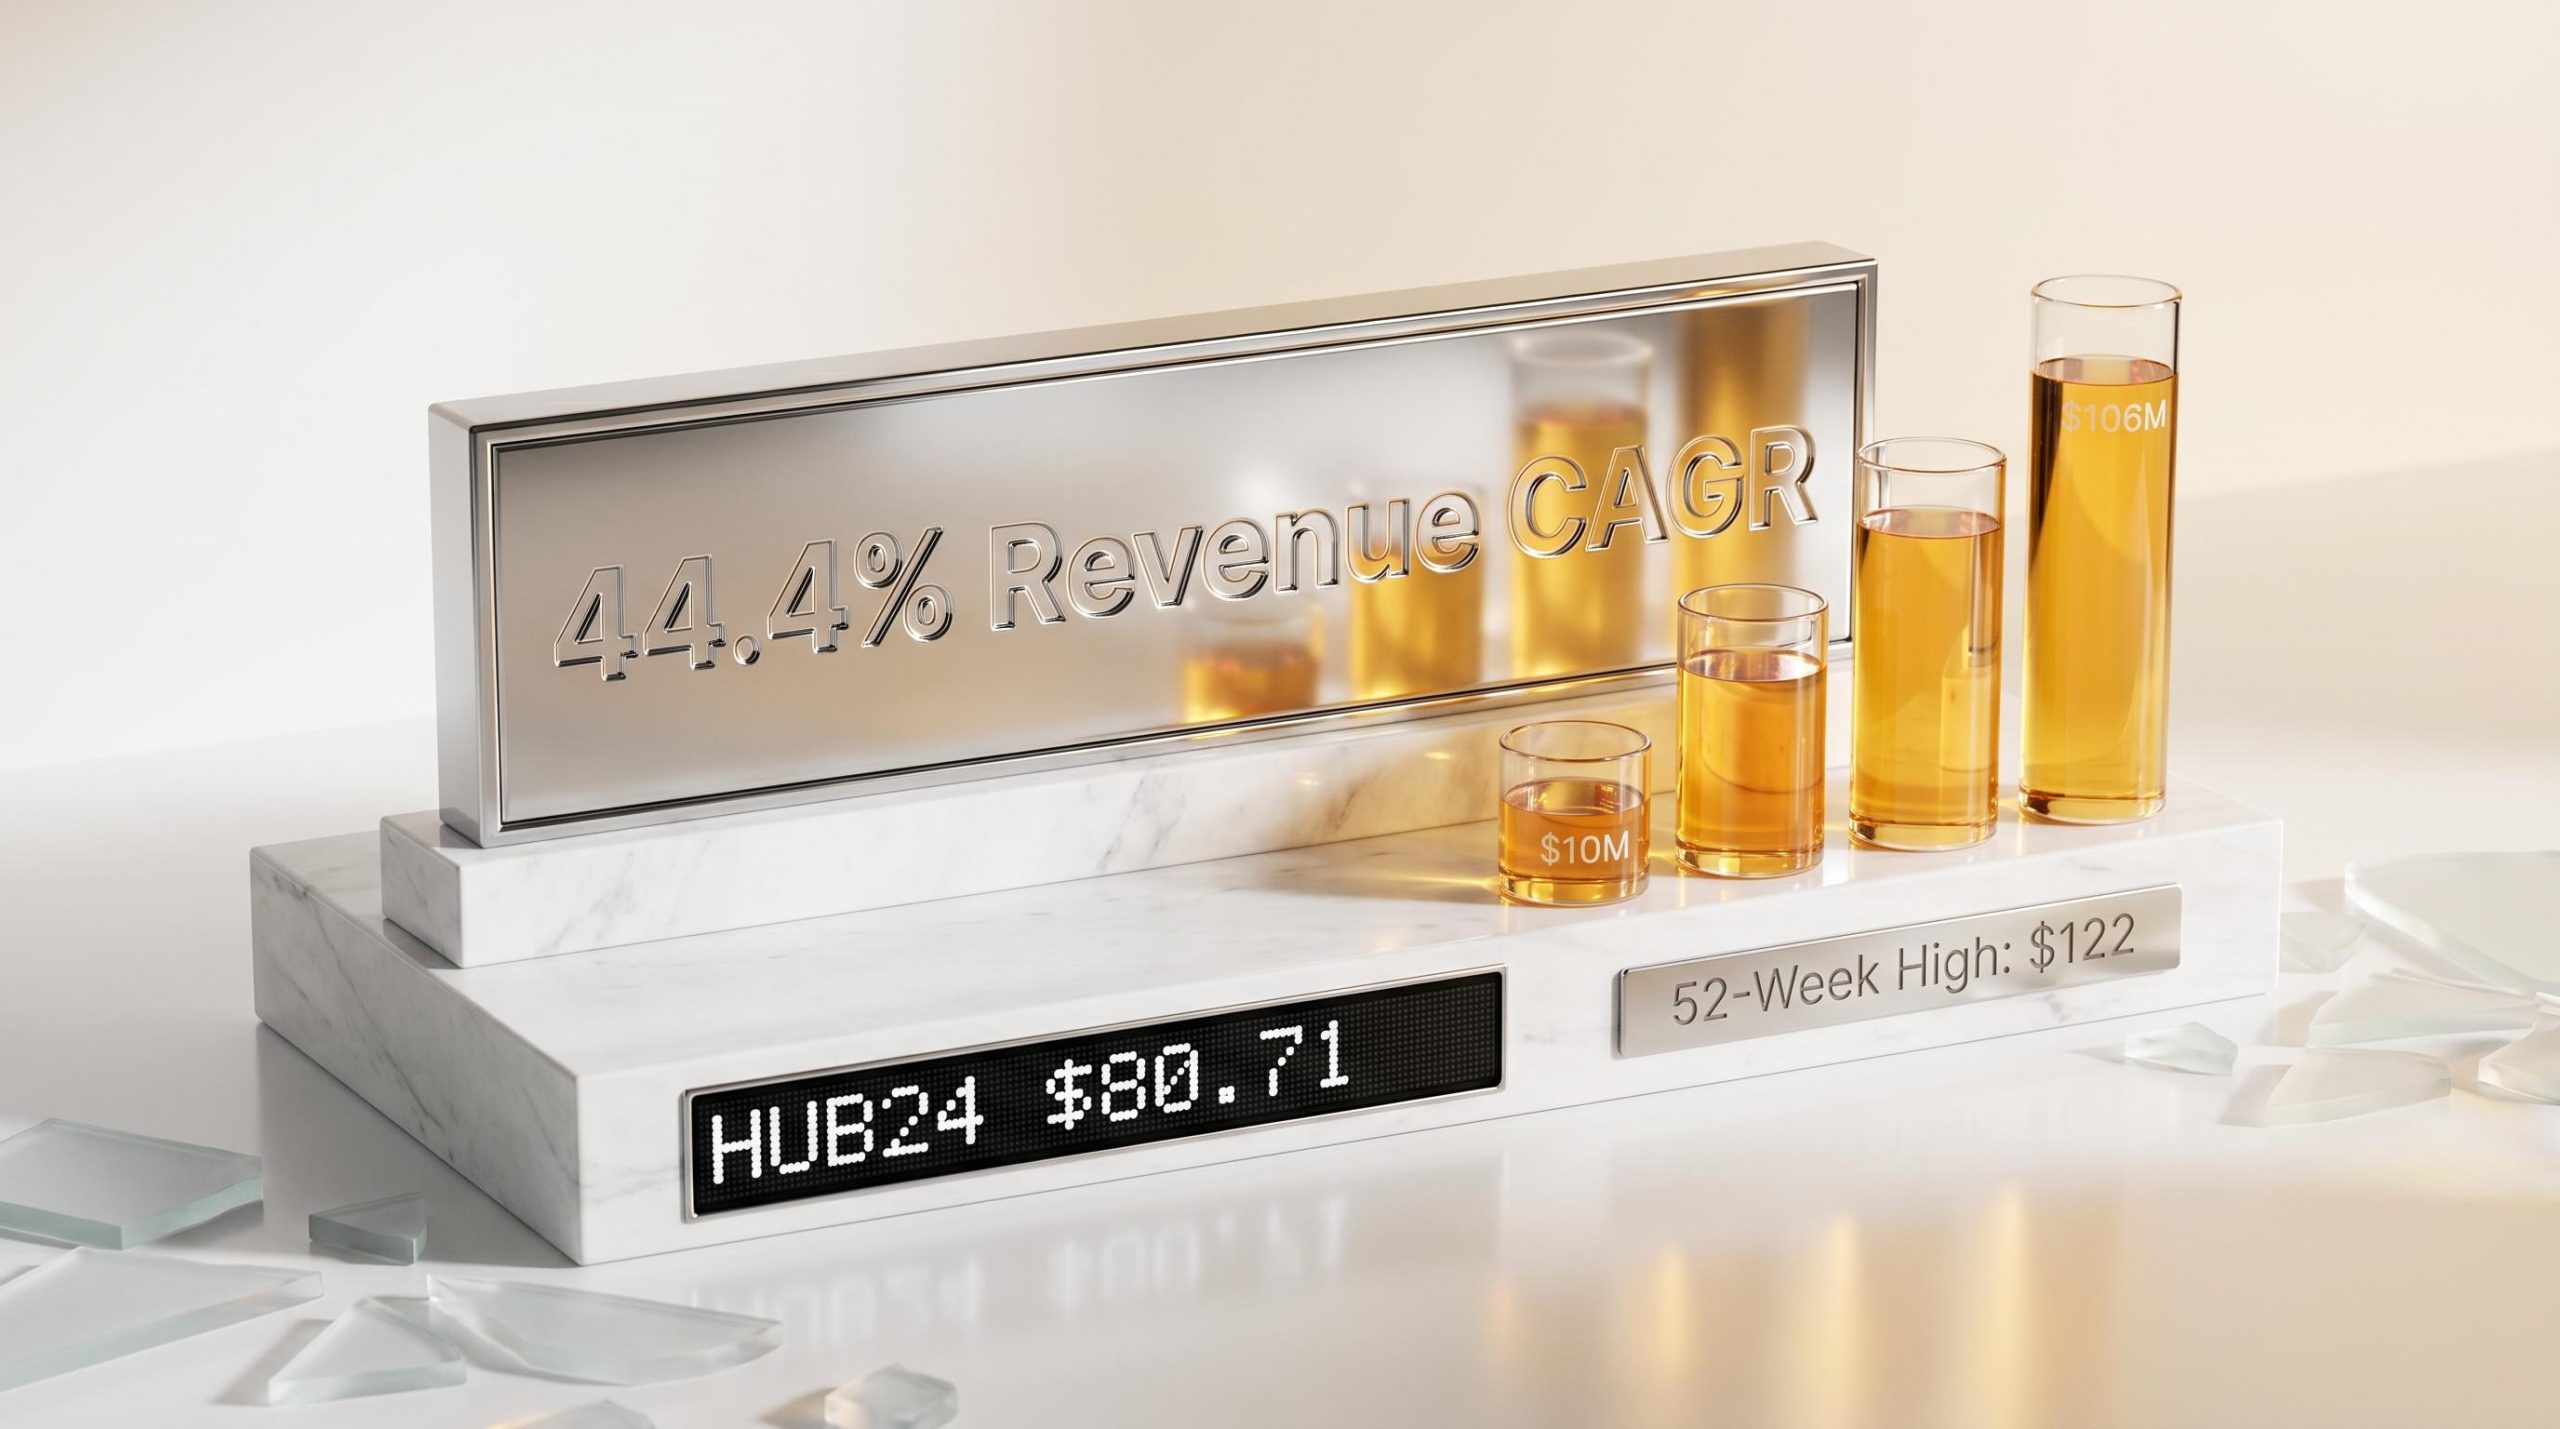
44.4% revenue CAGR over three years to FY24, with net profit nearly quintupling across the same window.
The confusion is not a business problem. It is a methodology problem. The three metrics most commonly used to screen Australian equities each systematically misrepresent companies at this stage of their growth cycle:
The P/E ratio limitations that distort HUB24’s apparent expensiveness are not unique to wealth technology: P/E completely breaks down for any business where reported earnings lag behind the underlying economics, including companies with heavy capitalised development costs or accelerating reinvestment cycles.
The result is a stock that traditional screens routinely dismiss or misprice, not because the business is flawed, but because the tools were designed for a different type of company.
HUB24 operates a platform model where value compounds over time rather than arriving in a single year’s earnings. Understanding how the model works explains why today’s profit figure is the wrong place to anchor a valuation.
The mechanics follow a predictable sequence:
HUB24’s Q3 FY26 net inflows of approximately $4 billion illustrate the flywheel in action. Each quarter of positive net inflows adds to the recurring revenue base, compounding future earnings without proportionally increasing costs.
Platform migration flows illustrate the flywheel in concrete terms: Generation Development Group’s transfer of AU$1.8 billion in managed discretionary account portfolios onto HUB24 pushed its Implemented Portfolios service past AU$4 billion in total funds under management, a single transaction that added directly to HUB24’s recurring revenue base.
The first-half FY26 result confirmed the operating leverage: platform revenue rose 30% versus the prior corresponding period, while platform EBITDA grew 40% over the same half. Revenue grew at 30%; profits grew faster.
HUB24’s three-product ecosystem, the HUB24 platform for advisers, Class for self-managed super fund (SMSF) administration, and myprosperity for client engagement, increases adviser switching costs and revenue per relationship. Industry recognition supports the competitive position: HUB24 was named Best Platform Overall in the Adviser Ratings Financial Advice Landscape Report 2024 and ranked first for Overall Satisfaction in the 2024 Wealth Insights Platform Service Level Report.
Three structural tailwinds reinforce the growth trajectory:
The Quality of Advice Review reforms, as published by the Australian Treasury, are designed to reduce the compliance burden on financial advisers and broaden the delivery of personal advice, changes that structurally favour technology-driven platforms able to service a larger adviser base at lower unit cost.
The framework that replaces the traditional toolkit has four components. Each one directly addresses a specific blind spot in the standard approach, and each is anchored in HUB24’s actual numbers.
| Traditional Metric | Why It Misleads for Growth Stocks | Better Alternative | HUB24 Example |
|---|---|---|---|
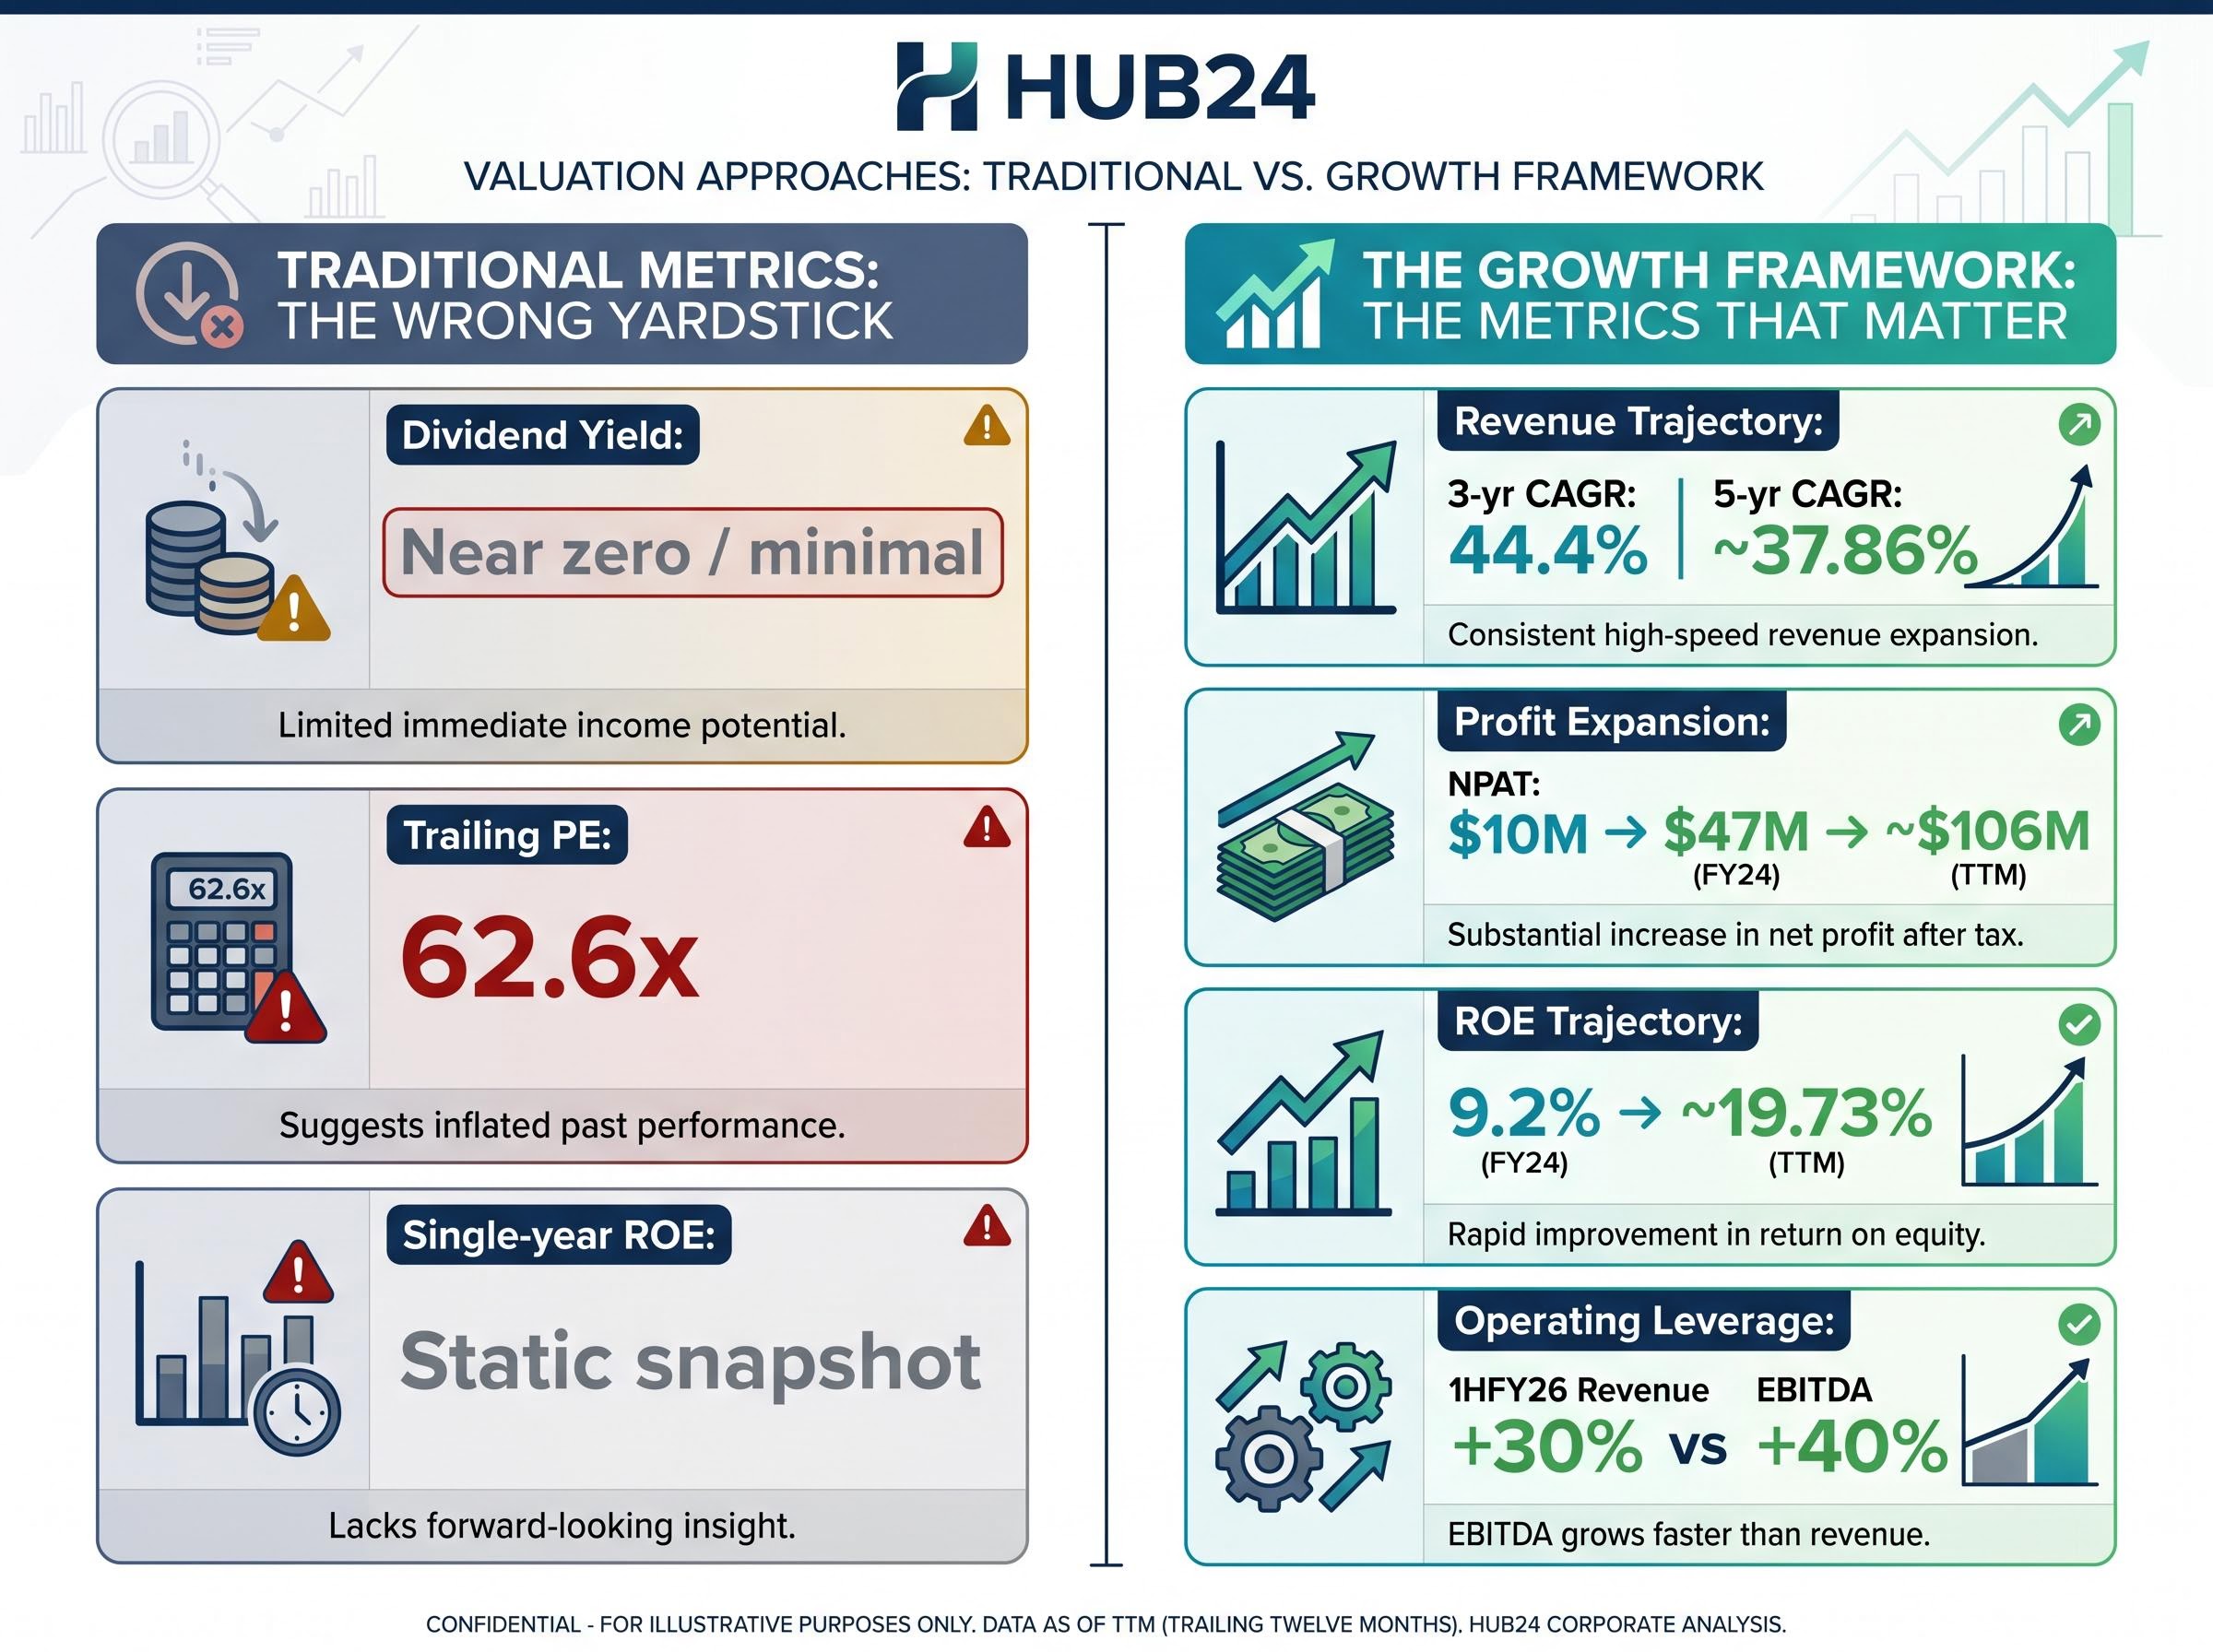
| Dividend yield | Low by design during growth phase; excludes reinvesting businesses | Revenue trajectory (multi-year CAGR) | 3-year revenue CAGR of 44.4%; 5-year CAGR of ~37.86% |
| Trailing PE | Compares today’s price to yesterday’s earnings; ignores growth path | Profit expansion trend | NPAT grew from $10M to $47M (FY24), then to ~$106M TTM |
| Single-year ROE | Snapshot that conceals whether returns are rising or falling | ROE trajectory over 3-5 years | FY24 ROE of 9.2% rising to ~19.73% on a TTM basis |
| Static EPS | Does not capture whether costs are scaling slower than revenue | Operating leverage (EBITDA vs revenue growth) | 1HFY26: revenue +30%, EBITDA +40% |
No single metric in this framework is sufficient on its own. The four work together because they triangulate one another: revenue trajectory confirms top-line momentum, profit expansion confirms that growth is converting to earnings, ROE trajectory confirms that returns on capital are improving, and operating leverage confirms that the margin structure is scaling.
ROE trajectory: from 9.2% to approximately 19.73% across the FY24-to-TTM window. The direction matters more than the number.
The TTM revenue of approximately $453 million and TTM NPAT of approximately $106 million show a business where all four metrics are currently pointing in the same direction. That alignment is the signal growth investors look for.
Even with the correct framework, the question of price remains. Three valuation tools attempt to bridge the gap between growth assessment and fair value:
HUB24’s PEG ratio, calculated as a TTM PE of approximately 62.6x divided by analyst consensus earnings per share (EPS) growth of approximately 16.7%, comes to roughly 3.8x. Growth investors often accept PEG ratios up to 1.5x-2.0x for high-quality platforms. A PEG of 3.8x signals that meaningful optimism is already priced into the stock.
Analyst 12-month price targets range from $66 to $132 across approximately 16 covering analysts, with a consensus average of roughly $94.14.
That spread is not confusion. It reflects genuinely different assumptions about HUB24’s future. Morningstar assigned a fair value of $48 in March 2026, implying approximately 69% overvaluation at the current price, based on a DCF model with a no-moat rating. Some broker DCFs, using more optimistic FUA growth and margin expansion inputs, imply fair values between $90 and $110.
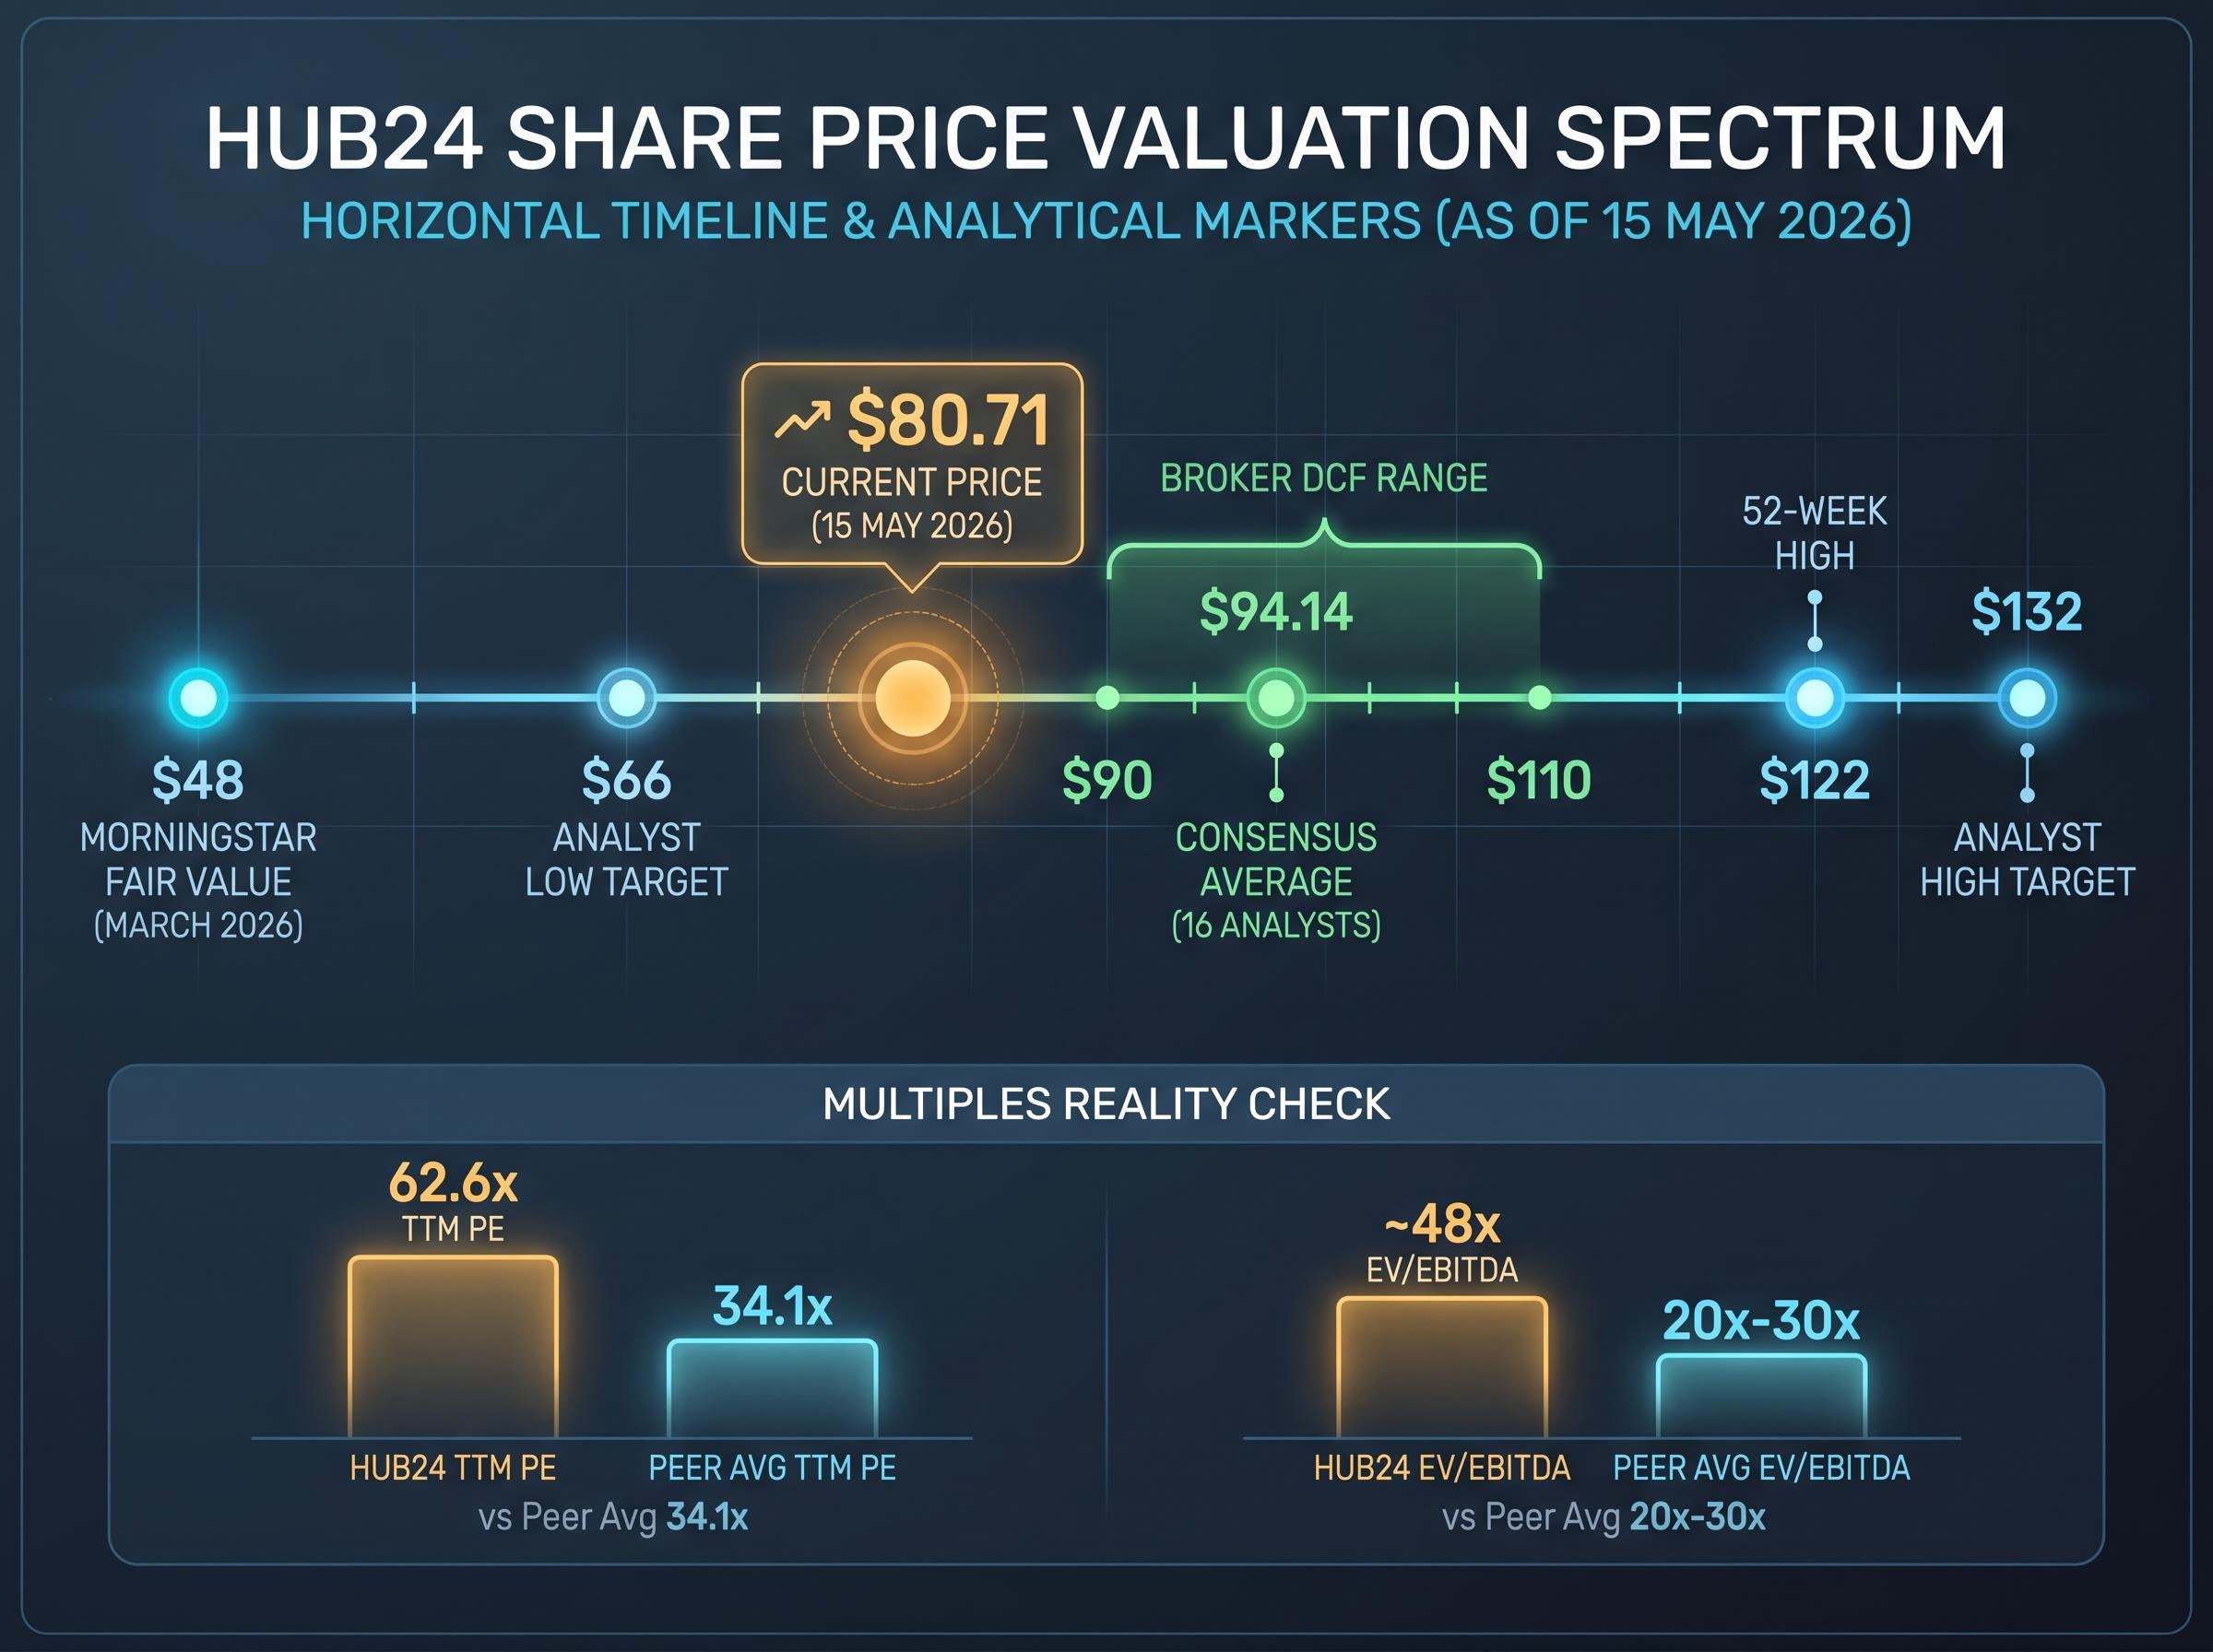
HUB24’s EV/EBITDA of approximately 48x sits well above the peer average of roughly 20x-30x, confirming the premium the market assigns to the growth trajectory.
None of these tools resolves the uncertainty. A reasonable analyst can arrive at $48 or $110 depending on their growth assumptions. That range is itself information about the risk profile of the investment.
Investors wanting to build the full multi-method toolkit before applying it to individual positions will find our dedicated guide to ASX share valuation methods covers P/S screening, DCF construction, EV/EBITDA benchmarking, and DDM in a structured five-step sequence with worked examples drawn from ASX-listed companies.
Applied to HUB24’s current data, the four-metric framework paints a consistent picture. Revenue trajectory remains strong across multiple timeframes. Profit expansion is accelerating: TTM NPAT of approximately $106 million represents more than double the $47 million reported at FY24. ROE has trended upward from 9.2% to approximately 19.73%. Operating leverage is confirmed by the 1HFY26 result, where costs grew materially slower than revenue.
NPAT grew from $47 million at FY24 to approximately $106 million on a TTM basis, more than doubling in roughly two years.
The first-half FY26 statutory NPAT of $59.7 million alone suggests the full-year FY26 result is likely to extend the profit expansion trend further.
The framework does not, however, resolve the price question. At approximately $80.71, the stock sits 33.7% below its 52-week high. Whether that discount represents an opportunity or an incomplete de-rating depends on assumptions about the next five to seven years that no backward-looking metric can answer.
The framework establishes whether the underlying business is performing in line with a growth thesis. It does not generate a buy or sell signal. It generates a better-informed question: given these specific growth metrics and this specific level of uncertainty, is the risk-reward at the current price consistent with a given investment horizon?
The four-metric framework, revenue trajectory, profit expansion, ROE trend, and operating leverage, is not specific to HUB24. It applies to any Australian growth company where the business model involves reinvesting aggressively into a growing addressable market.
Within wealth technology, Netwealth (ASX: NWL) and Praemium (ASX: PPS) are sector peers where the same FUA and net inflow metrics serve as the primary growth drivers. Insignia Financial (ASX: IFL) provides a useful contrast: it holds large legacy FUA but has experienced ongoing outflows, demonstrating that scale alone does not validate the growth framework. The direction of flows matters as much as the stock of assets.
Netwealth’s valuation presents an instructive parallel: the platform reported AU$125.8 billion in funds under administration and AU$7.6 billion in quarterly net inflows as of March 2026, yet its trailing PE of 109.6x against a sector average of 18.4x raises the same question about embedded growth assumptions that HUB24 investors are weighing at 62.6x.
The key adaptation when applying the framework to other sectors is to identify the business-specific growth driver that plays the same role as FUA:
The framework’s purpose is to replace a binary yes-or-no valuation judgment with a more useful question: is this growth compounding in a way that justifies the premium, and what specific metrics would signal if it stopped doing so?
Traditional blue-chip metrics are not wrong in general. They are wrong for this specific type of business at this specific stage of its growth cycle. Dividend yield, trailing PE, and single-year ROE were designed for companies with stable, mature earnings profiles. Applied to a compounding platform like HUB24, they produce conclusions that are technically accurate and practically useless.
The four-metric framework, revenue trajectory across multiple years, profit expansion trend, ROE direction over three to five years, and operating leverage, provides a more complete picture. Together, these metrics answer whether growth is genuine, scalable, and converting into higher returns on capital over time.
The investor’s task is to use this framework to confirm whether a growth thesis is intact, then make a separate judgment about whether the price on offer today reflects an acceptable risk-reward for their time horizon. The framework provides clarity on the business. The price decision remains the investor’s own.
This article is for informational purposes only and should not be considered financial advice. Investors should conduct their own research and consult with financial professionals before making investment decisions. Past performance does not guarantee future results. Financial projections are subject to market conditions and various risk factors.
The PEG ratio divides a stock's price-to-earnings ratio by its expected earnings growth rate, adjusting the PE figure for growth pace. Growth investors often consider PEG ratios up to 1.5x-2.0x acceptable for high-quality platforms, while a PEG above that level suggests meaningful optimism is already priced in.
The trailing PE ratio compares today's share price to yesterday's earnings, completely ignoring the trajectory of profit growth that defines the investment case for a high-growth company. For a business like HUB24, where net profit has grown from $10 million to over $106 million on a TTM basis, a static PE snapshot produces a distorted and practically useless valuation conclusion.
Investors should focus on four alternative metrics: multi-year revenue CAGR to confirm top-line momentum, profit expansion trend to verify growth is converting to earnings, ROE trajectory over three to five years to assess improving returns on capital, and operating leverage to confirm that costs are scaling slower than revenue.
Funds under administration (FUA) is the total value of client assets held on a wealth platform, and it is the primary driver of recurring platform fee revenue. As FUA grows through positive net inflows and market appreciation, platform revenue scales with the asset base while costs grow at a slower rate, expanding margins and accelerating profit.
Operating leverage occurs when a platform's revenue grows faster than its costs, causing profit to expand at a faster rate than revenue. HUB24's first-half FY26 result illustrates this: platform revenue grew 30% while platform EBITDA grew 40% over the same period, confirming the margin structure is scaling as the business matures.