10 Approved Rivals, Yet S&P Global’s Moat Keeps Compounding
50 mins ago
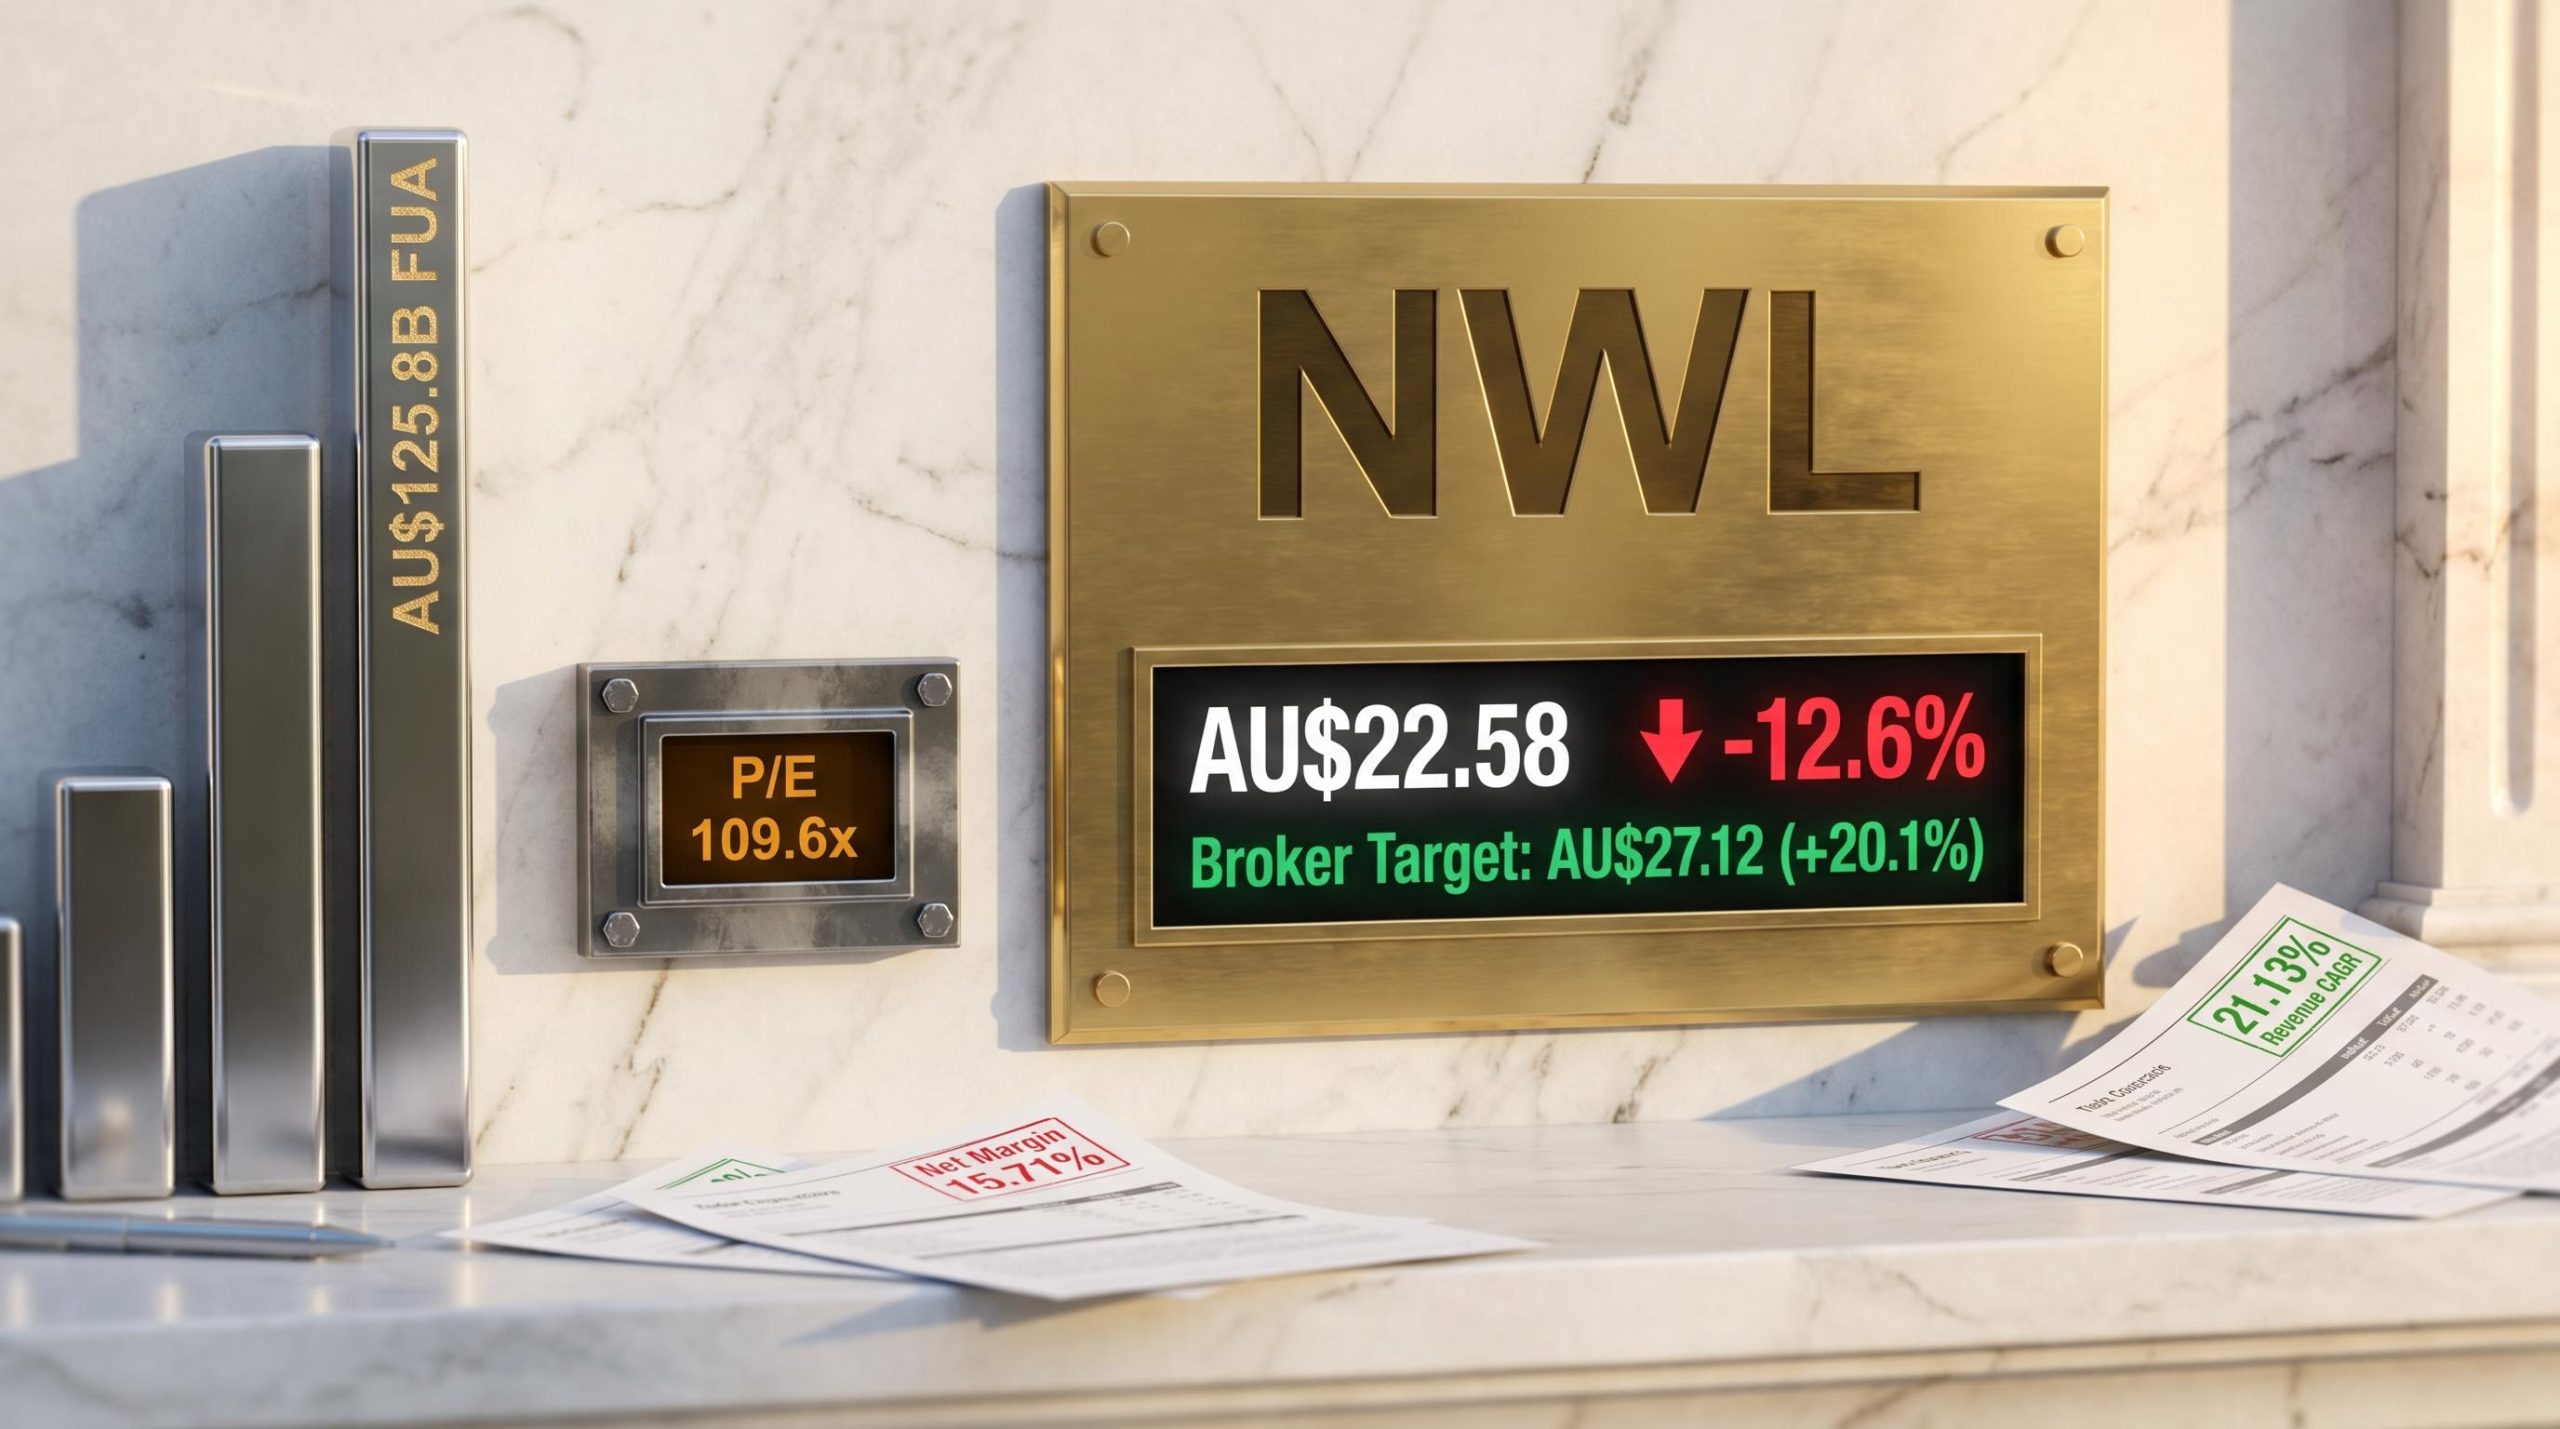
Netwealth’s share price has shed roughly 12.6% since the start of 2025, yet the consensus analyst price target from 16 brokers sits at AU$27.12, implying more than 20% upside from current levels. That gap between market pricing and analyst conviction deserves scrutiny. NWL has been one of the ASX’s most-watched wealth platform stocks for years, riding a 21.13% revenue CAGR since 2021 and growing funds under administration (FUA) to AU$125.8 billion as of March 2026. But its trailing price-to-earnings ratio now sits at 109.6x against a sector average of 18.4x, and its net profit margin has compressed from 35.4% to 15.71% in a single year. For investors trying to determine whether the pullback represents a signal or a trap, the numbers point in different directions. This analysis walks through Netwealth’s operating fundamentals, margin dynamics, peer positioning, and valuation framework to help investors form a clear view on whether the current Netwealth share price represents opportunity or overvaluation.
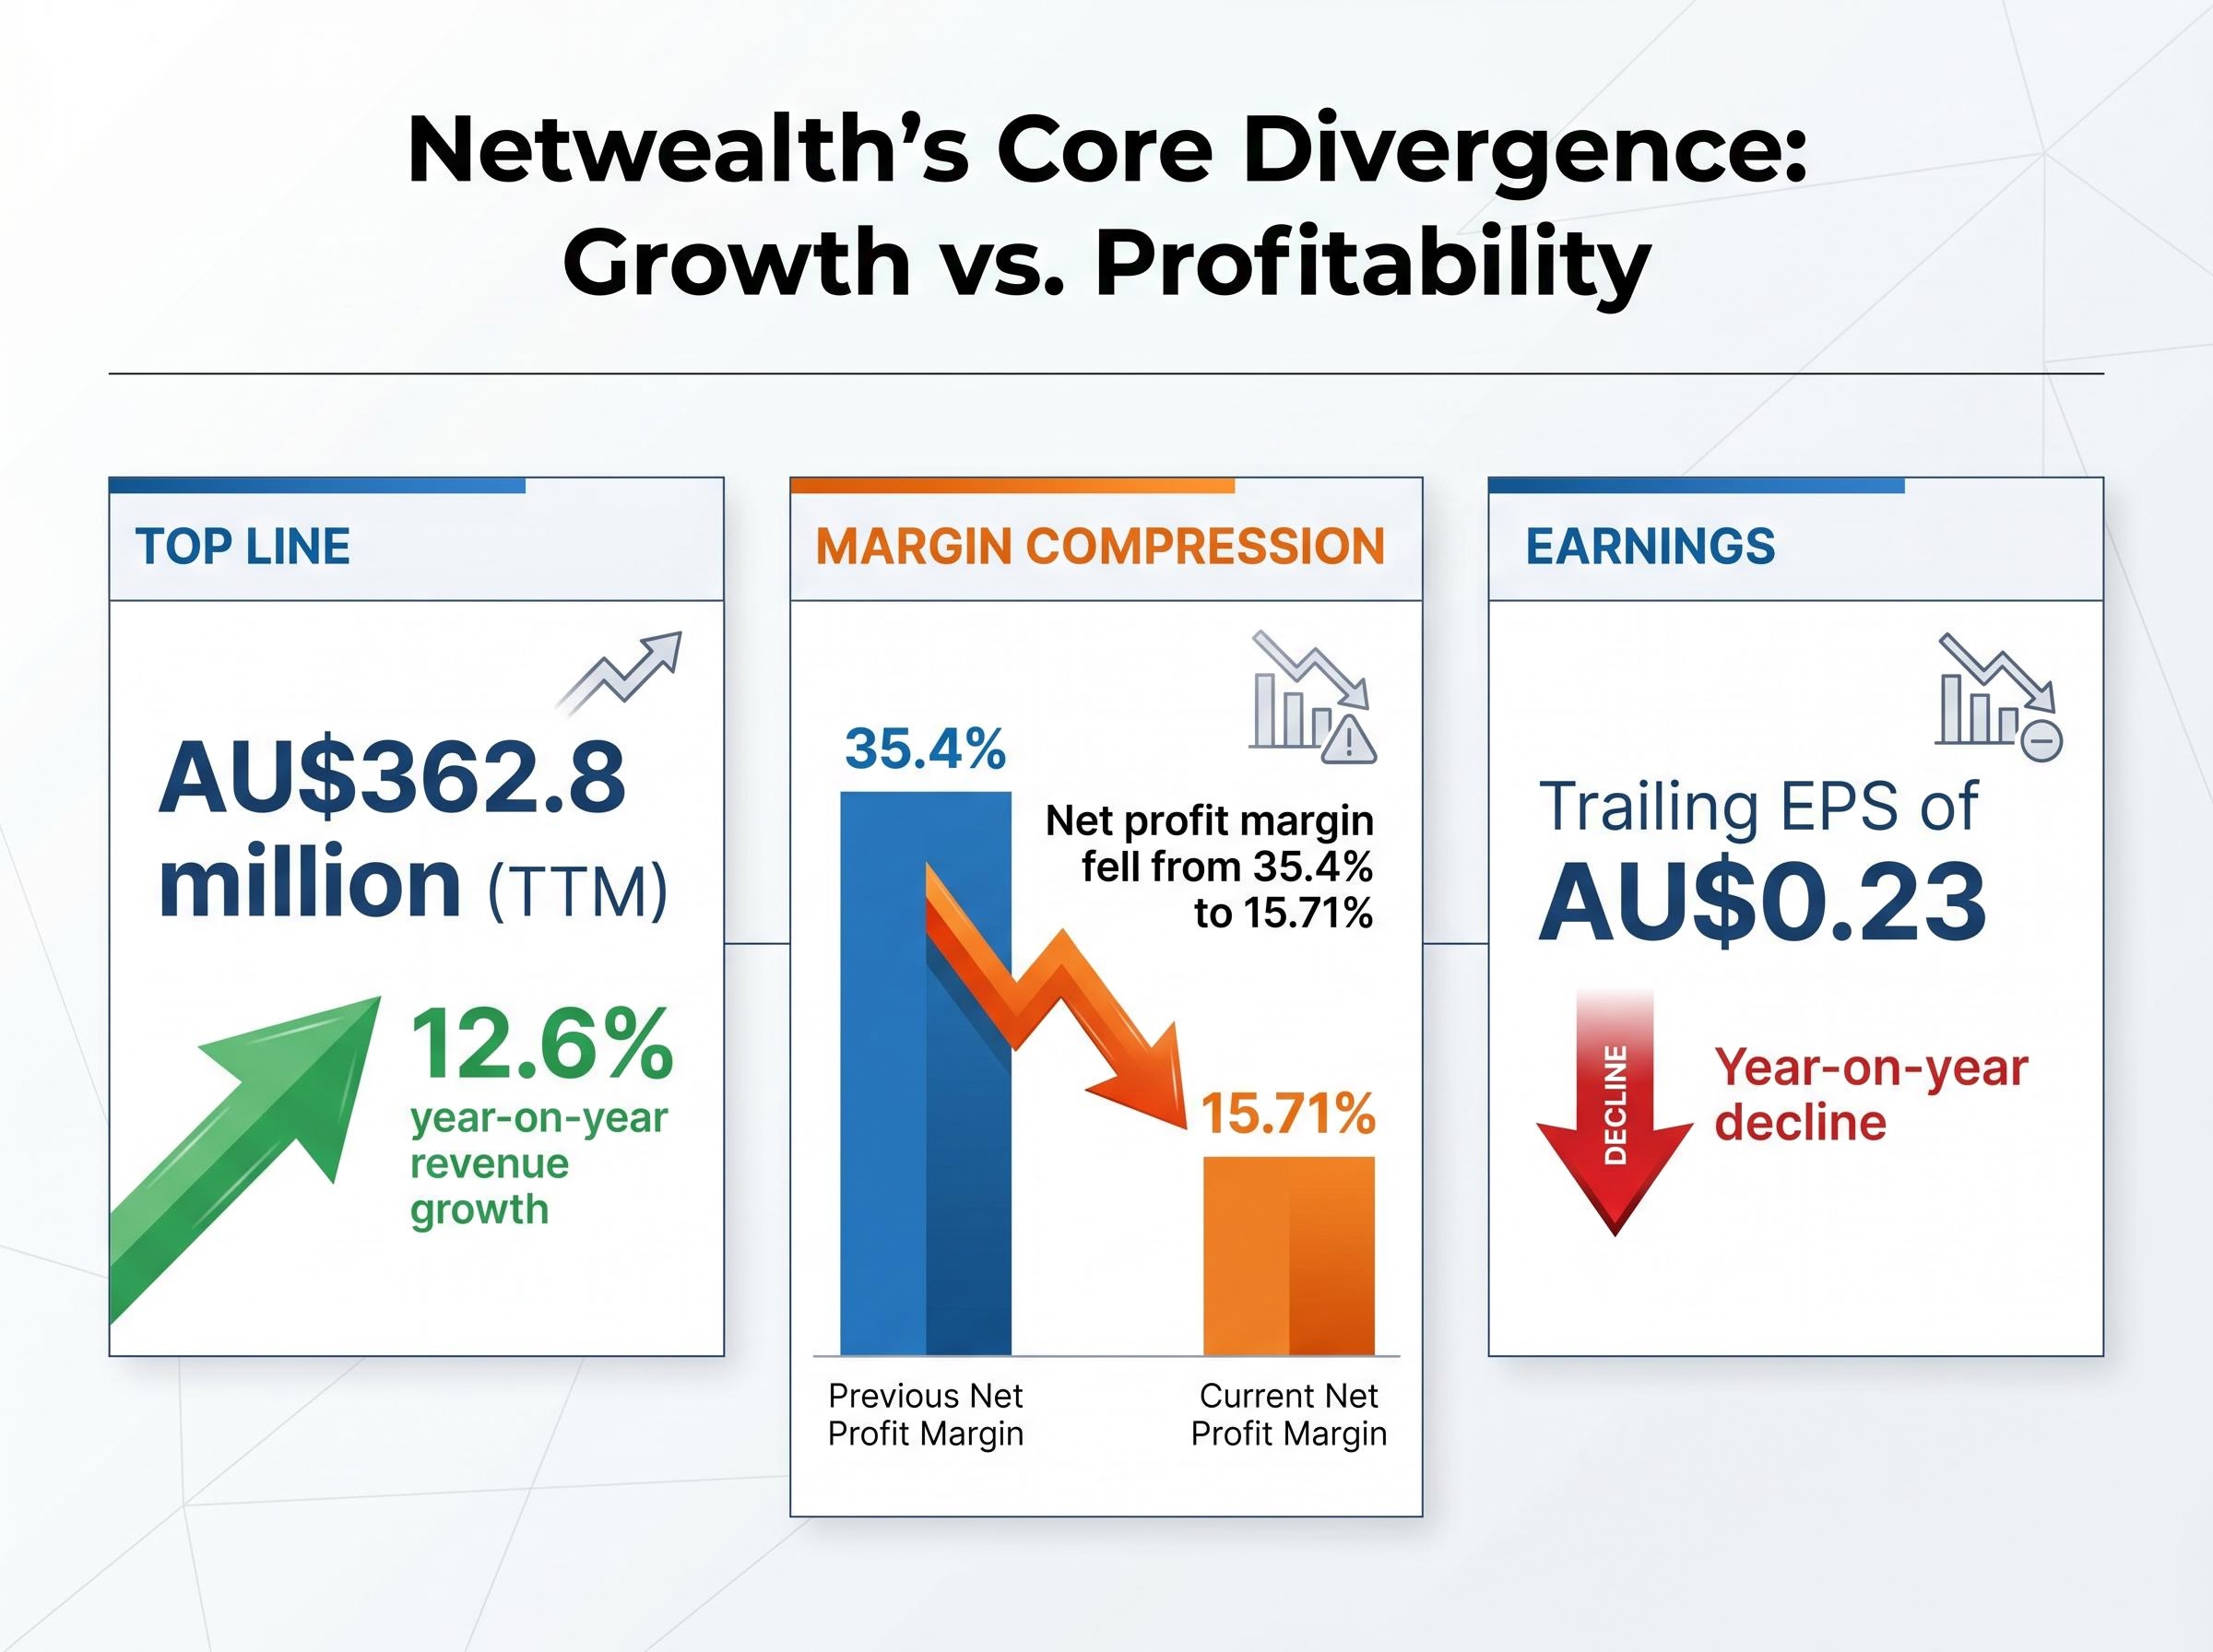
The most damaging number in Netwealth’s recent reporting is not revenue. Revenue grew 12.6% year-on-year to AU$362.8 million on a trailing 12-month basis. The problem is what happened beneath that top line.
Net profit margin fell from 35.4% to 15.71% in one year, despite continued revenue growth, meaning costs are rising materially faster than sales.
That compression translated directly into earnings. Trailing 12-month earnings per share came in at AU$0.23, a year-on-year decline that reset the market’s earnings-based valuation anchor. A business growing revenue at double digits but delivering less profit per share is precisely the combination that forces institutional investors to reprice.
The divergence between earnings quality versus headline growth is precisely the dynamic compressing NWL’s share price: revenue expanding at double digits while earnings per share decline is the signature pattern of a business whose cost base is growing faster than its operating leverage can absorb.
The share price, at AU$22.58 as of 9 May 2026, reflects that repricing across three dimensions:
The pullback is not irrational. It is the market recognising that revenue growth and earnings quality are two different things, and that Netwealth is currently delivering only one of them.
Strip away the margin compression and the platform story remains genuinely strong. FUA reached AU$125.8 billion as of 31 March 2026, representing 23.6% growth in H1 FY2026. Quarterly net inflows for the most recent quarter stood at AU$7.6 billion, a figure that confirms advisers and institutional allocators continue migrating assets onto the platform at scale.
This is not a business losing competitive relevance. It is a business investing heavily, and the cost of that investment is currently overwhelming the profit line.
| Metric | FY2024 Baseline | Current (March 2026) |
|---|---|---|
| Funds Under Administration | AU$88+ billion | AU$125.8 billion |
| Revenue (Annual / Run-Rate) | ~AU$322 million | AU$362.8 million (TTM) |
| Quarterly Net Inflows | Not specified | AU$7.6 billion |
| Return on Equity | Not specified | 62.3% |
The long-run revenue compounding record anchors the bull case. Netwealth has delivered a 21.13% revenue CAGR since 2021, with FY2026 revenue forecast at AU$393.52 million and FY2027 at AU$454.3 million. H1 FY2026 revenue came in at AU$169.0 million, with H1 FY2026 basic EPS of AU$0.24.
Return on equity of 62.3% is unusually high for a platform business of this scale. For context, 10% is generally considered acceptable for established businesses. A figure above 60% signals that Netwealth generates substantial earnings relative to the equity capital deployed, a hallmark of asset-light technology platforms with strong recurring revenue streams.
Return on equity signals of this magnitude, where a business exceeds 60% while simultaneously compressing its net profit margin, require investors to separate the efficiency of the underlying capital model from the near-term cost cycle that is temporarily suppressing the profit line.
Net profit grew from AU$54 million in 2021 to AU$83 million in FY2024, providing the historical earnings arc before the current compression phase. The question is whether the current margin decline represents a temporary investment cycle or a structural shift in the business’s cost base.
A trailing P/E ratio of 109.6x looks alarming in isolation. But applying traditional earnings-based analysis to a high-growth fintech platform in an active investment phase can produce misleading conclusions. The evaluative lens matters as much as the data itself.
For growth-stage platform businesses like NWL, three metrics carry more analytical weight than a point-in-time P/E:
Certain metrics, while valid for mature businesses, are less useful as primary signals for Netwealth at this stage:
Investors who apply the wrong evaluative lens to a business like NWL will draw incorrect conclusions regardless of how accurate their data is.
Investors wanting a complementary lens for evaluating platform businesses where growth and margin trade off against each other will find our full explainer on the Rule of 40 framework useful, as it examines how combining revenue growth rate with profit margin into a single score helps investors compare businesses like NWL across different investment phases without being misled by a point-in-time P/E reading.
HUB24 has made the competitive pressure on Netwealth impossible to ignore. Over the past 12 months, HUB24 delivered a share price return of approximately +47%, posted record H1 FY2026 net inflows of AU$10.7 billion, and grew H1 FY2026 revenue by 26%. Each of those figures exceeds Netwealth’s comparable metric.
| Metric | NWL | HUB24 |
|---|---|---|
| 1-Year Share Price Return | -9.45% | +47% |
| H1 FY2026 Revenue Growth | Not separately disclosed | +26% |
| Recent Net Inflows | AU$7.6 billion (quarterly) | AU$10.7 billion (H1 FY2026, record) |
| Trailing P/E | 109.6x | Not available |
The broader wealth platform sector appreciated approximately 49.33% over the past year. The ASX 200 rose approximately 56.35% over the same period. Against both benchmarks, Netwealth’s -9.45% return makes it the notable laggard, not an outlier in a weak sector but a company-specific underperformer in a strong one.
That distinction matters. If the entire platform sector were struggling, NWL’s pullback could be attributed to macro headwinds. HUB24’s outperformance on both inflows and share price suggests the issue is largely specific to Netwealth’s current cost and margin dynamics. Verifiable FUA comparisons for Praemium and Insignia Financial are not available in current data, so the peer comparison is appropriately confined to HUB24 where figures are confirmed.
Investment Trends platform market research published in February 2026 confirmed that adviser adoption and platform switching activity remained elevated across the Australian wealth management sector, with HUB24 and Netwealth both identified as primary beneficiaries of ongoing adviser migration away from legacy institutional platforms.
NWL trades at 109.6x trailing earnings, roughly five to six times the sector average, a premium that requires both margin recovery and sustained FUA growth to be justified.
The trailing P/E of 109.6x and EV/EBITDA of 75.1x (as of 8 May 2026) are not simply red flags. They are measures of expectation. At these multiples, the market is pricing in a scenario where Netwealth recovers its margin, maintains above-market FUA growth, and translates both into materially higher earnings per share within the next 12-24 months. Whether that scenario is plausible is the question that determines whether the stock is fairly valued or dangerously stretched.
| Valuation Reference | Price (AU$) | Implied Move from AU$22.58 |
|---|---|---|
| Current Share Price | $22.58 | — |
| Consensus Broker Target (16 analysts) | $27.12 | +20.1% upside |
| DCF Fair Value (Simply Wall St) | $14.66 | -35.1% downside |
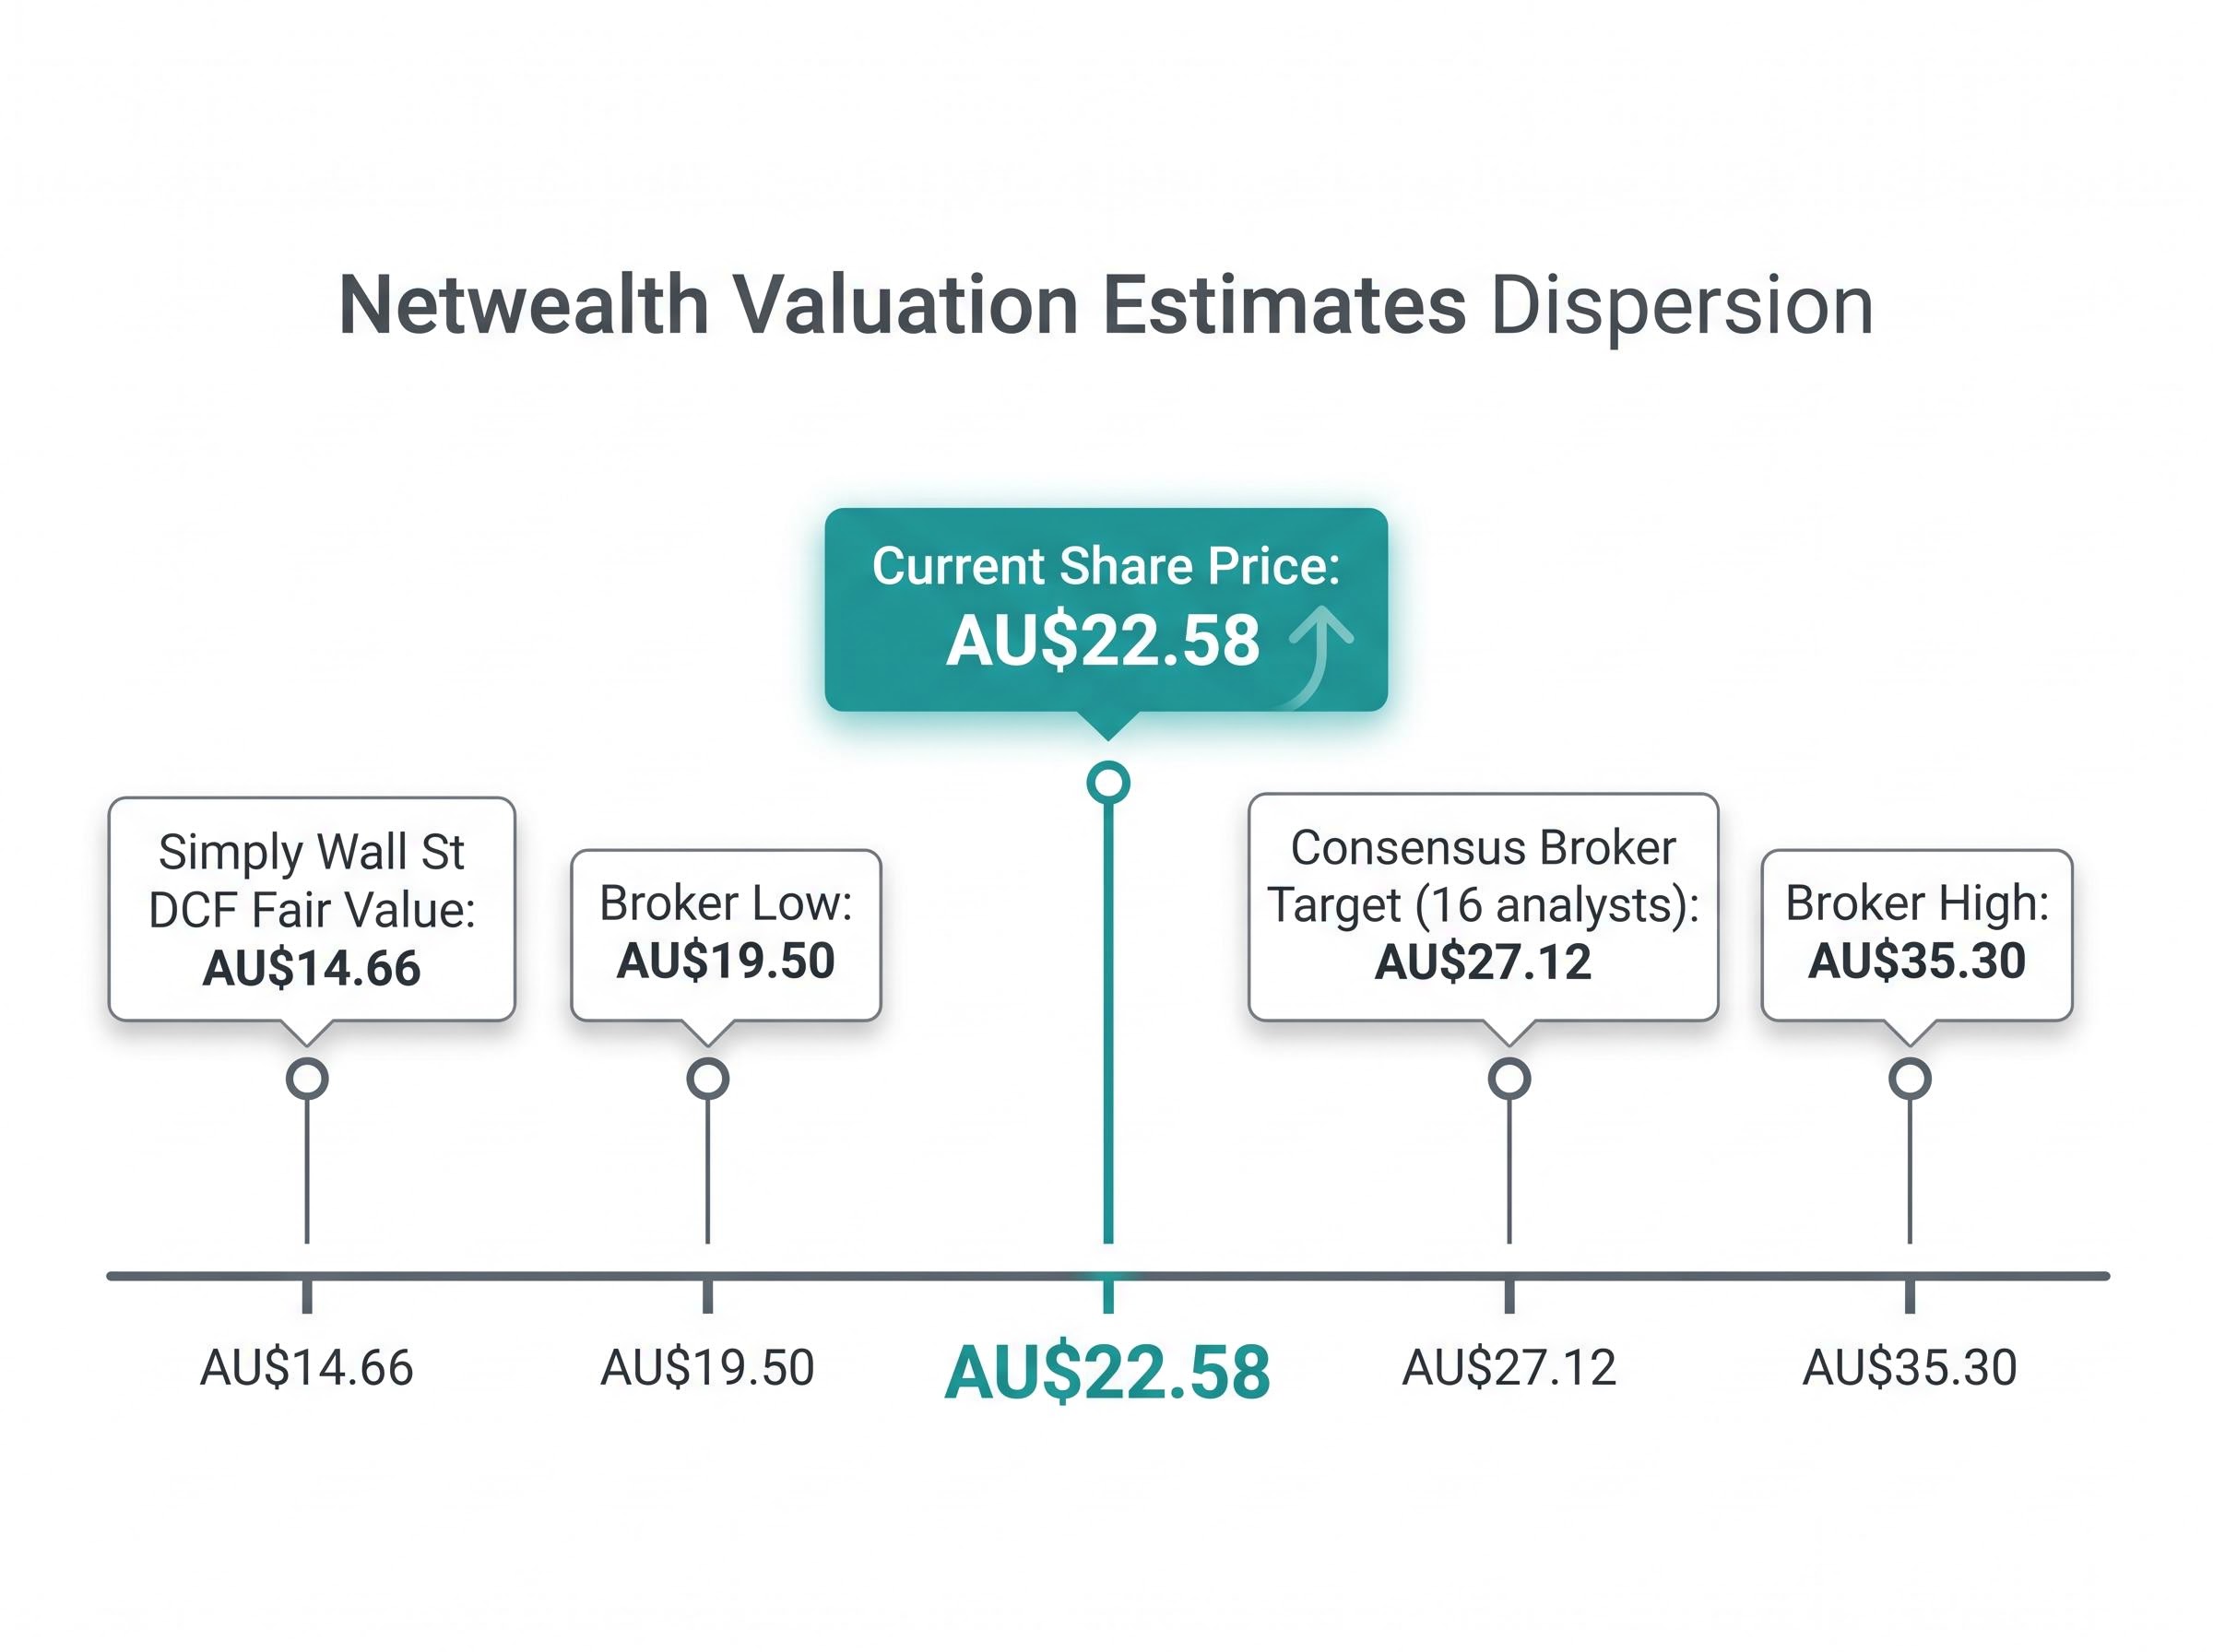
The broker consensus target of AU$27.12 (average of 16 analysts, with a high of AU$35.30 and a low of AU$19.50) implies confidence in margin recovery. An alternative consensus from 12 analysts places the target at AU$28.18. By contrast, Simply Wall St’s DCF-derived fair value of AU$14.66 implies the stock remains expensive even after the pullback. That figure represents a single-source estimate and should be treated as one data point rather than a definitive floor.
Analyst price target dispersion of this magnitude, with a spread from AU$19.50 to AU$35.30 on a single stock, reflects fundamentally different assumptions about which version of the business is being modelled, not disagreement about the facts themselves; each target embeds distinct forecasts for margin recovery speed and the durability of FUA inflow momentum.
The wide dispersion between AU$14.66 and AU$35.30 reflects fundamentally different assumptions about margin recovery timing and durability. The single most important near-term re-rating catalyst is the net profit margin trajectory in upcoming half-year results. A return toward the prior 35.4% level would materially change the earnings picture underlying the current multiples.
Past performance does not guarantee future results. Financial projections are subject to market conditions and various risk factors.
Bull case:
Bear case:
Neither case is speculative. Both are grounded in the same data set, weighted differently.
The single most important indicator to watch is the net profit margin trajectory in the next half-year result. The gap between the prior year’s 35.4% margin and the current 15.71% is the variable that determines which thesis plays out. A recovery toward the 30%+ range would likely close the gap between the current share price and broker consensus targets, validating the bull case. Continued compression would confirm the bear case and suggest the premium multiple is unsustainable.
The 12.6% share price decline has improved the risk-reward profile relative to earlier 2025 levels, but NWL still prices in significant earnings recovery and continued above-market FUA growth. Investors paying today’s price are buying the recovery thesis rather than current earnings, and should be clear-eyed about what that means for position sizing and entry timing.
The data points to watch in future reporting are straightforward: net profit margin trajectory, quarterly FUA net inflows relative to HUB24, and whether forward EPS estimates hold at current forecast levels. Each will either confirm or challenge the recovery narrative that the current valuation embeds.
This article is for informational purposes only and should not be considered financial advice. Investors should conduct their own research and consult with financial professionals before making investment decisions.
Netwealth's share price has declined roughly 12.6% since the start of 2025 primarily because its net profit margin compressed from 35.4% to 15.71% in a single year, with costs rising faster than revenue growth, which caused trailing earnings per share to fall and forced institutional investors to reprice the stock.
Funds under administration (FUA) is the total value of client assets held on Netwealth's platform, which reached AU$125.8 billion as of March 2026 with AU$7.6 billion in quarterly net inflows, serving as a key indicator of platform demand and the future revenue base that underpins margin recovery expectations.
Over the past 12 months HUB24 delivered approximately 47% share price growth, record H1 FY2026 net inflows of AU$10.7 billion, and 26% revenue growth, outperforming Netwealth on every comparable metric while Netwealth posted a negative 9.45% one-year return.
The consensus price target from 16 brokers is AU$27.12, implying more than 20% upside from the current price of AU$22.58, though targets range widely from a low of AU$19.50 to a high of AU$35.30, reflecting materially different assumptions about margin recovery timing.
The single most important indicator is the net profit margin trajectory; a recovery toward the prior 35.4% level would likely validate the bull case and close the gap between the current share price and broker consensus targets, while continued compression would suggest the current premium multiple is unsustainable.