Not every line drawn across a price chart deserves your attention. Some are wishful thinking, dragged between two random points to justify a trade you already wanted to make. Others are genuine structural barriers where thousands of buy and sell decisions have collided, retreated, and collided again.
Knowing which is which separates a disciplined technical trader from someone reacting to shapes on a screen.
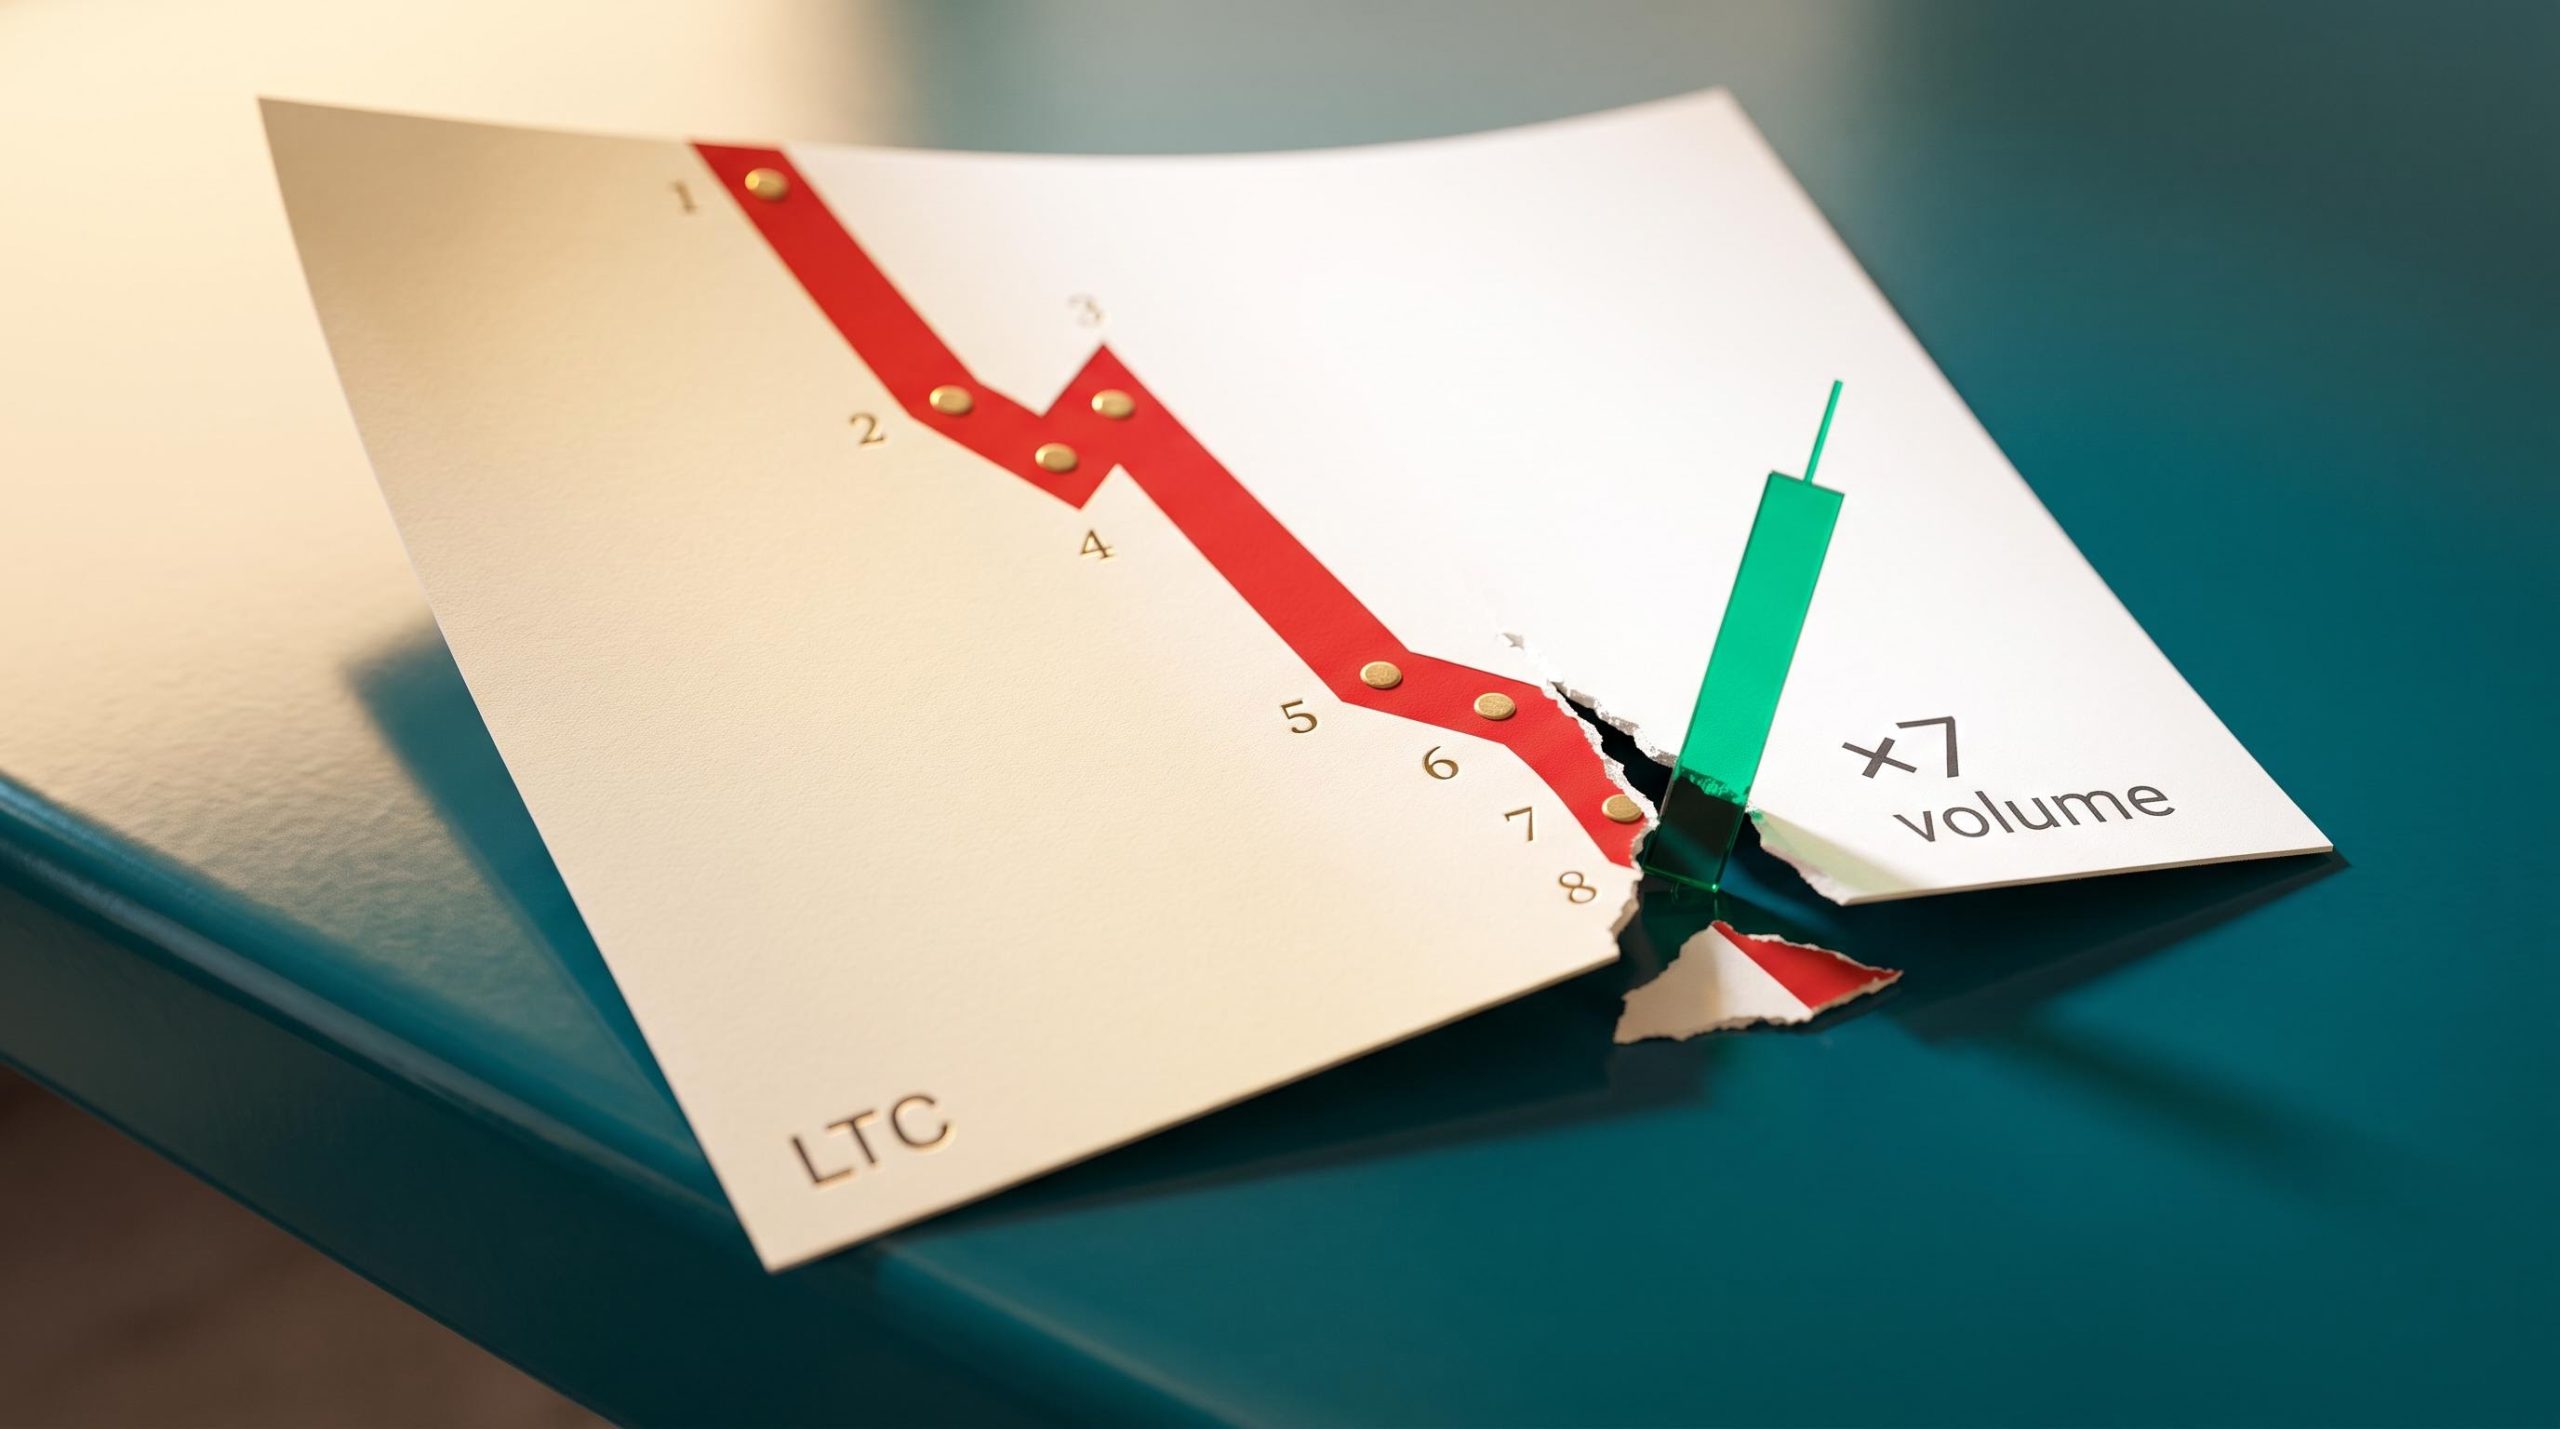
In late 2025, Litecoin (LTC) delivered a near-perfect example of the second kind. A descending trendline that had capped the price on seven separate occasions finally shattered on the eighth touch, driving an intraday gain of 20-25% on volume roughly seven times the norm. It was a case study in how pressure accumulates against a technical ceiling until it can no longer hold.
This piece gives you a working framework for a trendline breakout strategy: how to identify a line worth trusting, how to confirm a genuine break using volume, how broken resistance becomes new support, and how to filter out the false moves that trap impatient money.
Why multi-touch trendlines act as market coiled springs
A trendline is not just a diagonal drawn on a chart. It is a visible record of where buyers and sellers have repeatedly made decisions, a map of clustered orders that you can read and act on.
Every time price approaches the line and turns away, a fresh round of real money changes hands at that level. Traders anchor their expectations there. Stop-losses get placed just beyond it. Limit orders stack up around it. With each touch, the psychological weight of that line grows heavier.
This is why a two-touch line means very little. Two points connected on a chart can be pure coincidence; you can draw a line through almost any pair of highs or lows. A line respected four, five, or more times is a different animal entirely. TradingView’s Trend Lines indicator documentation reflects this directly, treating a line with five touches as one the market genuinely respects, and only generating a breakout signal when price closes decisively through it.
The logic runs like this: the more traders anchored to a level, the more meaningful it becomes when that level finally gives way. A decisive close through a heavily tested line signals a real shift in who controls the price, not random noise.
That said, this thinking has genuine critics, and ignoring them would leave you exposed. Academic research on technical analysis has long argued that many multi-touch lines are products of retrospective curve-fitting rather than real predictive structure.
A line that looks like a perfect four-touch trendline in hindsight can arise from random price clustering, particularly in noisy or low-liquidity markets. There is also a counterintuitive risk: the more times a level is tested, the more nearby orders get filled or cancelled, which can weaken the barrier rather than strengthen it.
The honest position sits in the middle. A multi-touch trendline is a heuristic, a useful rule of thumb, not a guarantee. Treat it as one strong input among several, and you avoid acting on visually appealing lines that carry no real statistical edge.
Peer-reviewed research on technical analysis validity in cryptocurrency markets confirms that even well-constructed chart patterns carry error margins, and absolute profitability cannot be guaranteed, which is precisely why treating multi-touch trendlines as heuristics rather than certainties is the disciplined approach.
When big ASX news breaks, our subscribers know first
Dissecting Litecoin’s eighth-touch breakout and volume precursors
The Litecoin move works so well as a teaching example because the warning arrived before the fireworks did.
According to analysis from Jake Sweeny, a professional trader at Verified Investing, the descending trendline in question had contained Litecoin’s price through seven prior touches. Each rejection reinforced the ceiling. By the eighth approach, the setup was fully loaded.
The first real clue was not price. It was volume. A preliminary surge in trading volume appeared around 21 September, ahead of the actual price breach. That early expansion is your genuine advantage, because it shows accumulating interest before the wider retail crowd even registers that something is happening.
When the break came, it was emphatic. Litecoin traded near $74 with an intraday gain of roughly 20-25%, and volume on the breakout day reached approximately 700,000 units, about seven times the typical level.
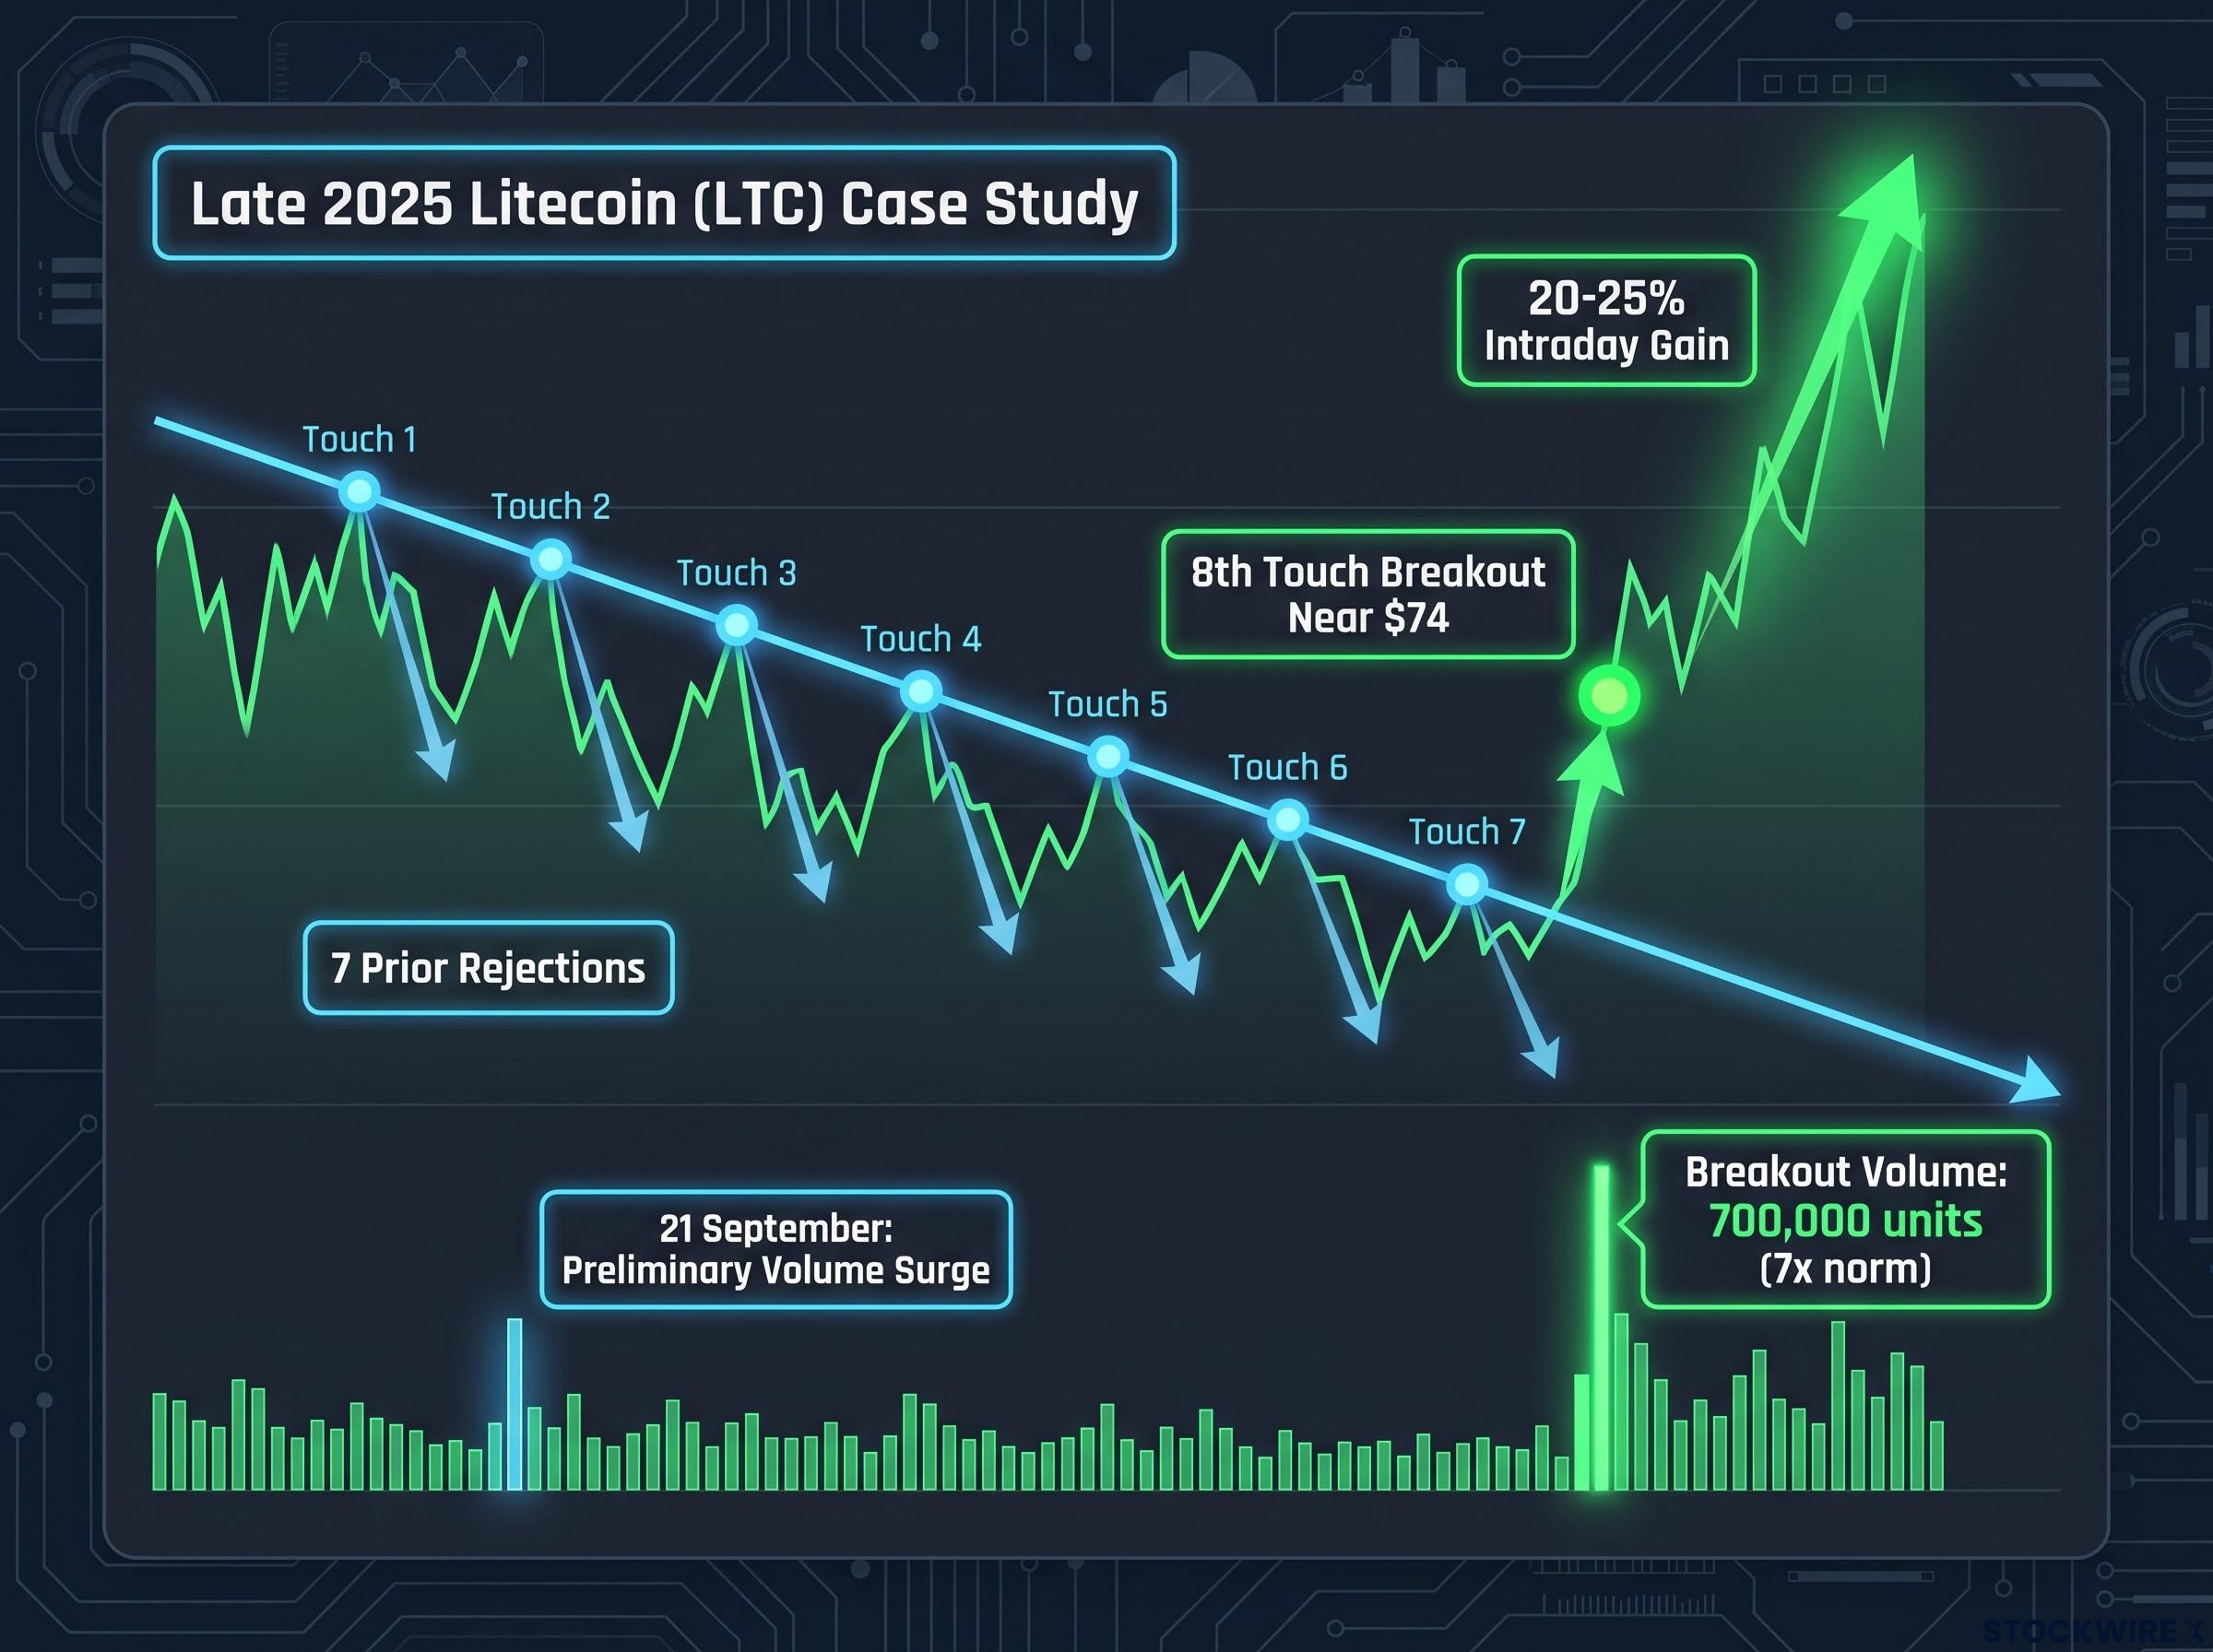
That volume figure is the point. A breakout on thin participation is a whisper; a breakout on seven times normal volume is a statement. The surge told traders that real conviction, not a single large order or a fluke, was driving the move through the line.
Volume confirmation is what separates a real breakout from a headfake; valid breakouts typically require at least 1.5 to 2 times the 20-day average volume on the breakout bar, a threshold that Litecoin’s seven-times-normal session cleared with room to spare.
With the break confirmed, the levels that mattered came into focus.
| Level type | Price zone (USD) |
|---|---|
| Primary pullback support | $64.00 – $64.80 |
| Secondary support (prior pivot low) | $71.73 |
| First resistance | $80.00 |
| Second resistance (prior pivot high) | $84.84 |
| Upside target | $90.00 – $100.00 |
These levels are what turn a breakout into a plan. They give you a defined support zone to lean on, a stop-loss reference just below it, and a measured target to aim for.
The role of the long-term resistance trendline
The $90-$100 target was not automatic. It carried a condition.
Sweeny identified a second, longer-term trendline originating from 6 August 2024. This line had first acted as support, then flipped to function as resistance, and had last been tested in that resistance role in January 2025.
Clearing that older, higher-timeframe hurdle was the required condition for the larger upside move. The shorter-term breakout opened the door; the long-term line was the gate to the bigger target. Understanding that distinction stops you from expecting a full run when only the first obstacle has been cleared.
The polarity principle in action post-breakout
The euphoria of a breakout is exactly when discipline matters most. Because what happens next is mechanical, and it usually rewards patience over adrenaline.
The polarity principle describes it simply: once price convincingly breaks through resistance, that former ceiling frequently flips to become a support floor on the next pullback. In Litecoin’s case, the longer-term trendline that had originally acted as support and later became resistance demonstrated exactly this kind of role reversal.
Why trapped traders create the new floor
The flip is driven by human behaviour on both sides of the trade.
Short-sellers who bet against the breakout are now trapped, sitting on losses, and they buy back to exit as price returns toward the broken line. At the same time, buyers who missed the initial spike have been waiting for a second chance, and the pullback to the old resistance is the entry they wanted.
Both groups concentrate their orders around the same zone. That clustering of exit-buying and fresh entry-buying is what physically creates the new support floor.
Order flow analysis adds a layer beneath trendline structure by revealing where institutional participants are actually placing size, including iceberg orders and liquidity sweeps that concentrate around heavily tested levels and can signal a breakout before price confirms it on the chart.
This is why Sweeny’s stated preference was to wait for a pullback toward the $64 breakout zone rather than chase the 20-25% intraday spike. Waiting for the retest gives you a far better entry price and a clean, logical place to set a stop-loss, just beneath the new support.
The pattern is not a one-off. Roughly a year later, on 24 September 2026, Invezz reported Litecoin breaking through a resistance area that had repeatedly capped its earlier recovery attempts, this time on spot volume near $948 million and a strong Average Directional Index (ADX) reading around 46. The ADX measures how strong a trend is, and a reading near that level signals genuine momentum rather than aimless drift. Once cleared on that kind of volume, the same prior resistance sets up as a potential new support floor.
The lesson repeats across cycles: the disciplined pullback entry is almost always safer for your capital than chasing the first candle.
Filtering the noise to avoid false breakouts
The fear of missing out is what makes false breakouts so expensive. A single green candle wicking above a line can feel like the start of something, right up until it slams shut and leaves latecomers holding losses.
Bearish chart patterns follow the same structural logic in reverse: descending triangles and head-and-shoulders tops accumulate selling pressure across multiple tests of a support floor until a high-volume close beneath the line flips it into resistance, with false breakouts on thin volume producing fakeout probabilities exceeding 60%.
Sitting out an unconfirmed move is not weakness. It is capital preservation, and it protects you far better than gambling on an isolated intraday spike.
The most common trap is the single-bar poke: price briefly pierces the trendline but fails to close above it. TradingView’s mechanical rule exists precisely to filter this out, requiring a definitive close beyond the line rather than a mere intraday touch.
A second trap is distribution disguised as momentum. Price presses repeatedly into an upper resistance band without ever closing through it. Blockchain.News, in a September 2026 Litecoin outlook, flagged exactly this risk around an upper band near $58.29 just below a resistance cluster around $59.30, warning that pressing into such a band is not yet a breakout and can precede a sharp reversal as stronger hands sell into eager buyers.
A third trap is conflicting timeframes. StockTradersDaily’s 24 September 2026 LTCUSD note described strong near-term momentum sitting against a weaker long-term bias, a reminder that a short-term break can still be fighting a dominant longer-term downtrend, which raises the odds of failure.
Before committing capital to any breakout, run it through a simple checklist:
- Close confirmation: Wait for a decisive close beyond the trendline, ideally more than one, not just an intraday wick.
- Volume expansion: Demand a clear surge in volume, the way Litecoin’s seven-times-normal day confirmed real conviction.
- Timeframe alignment: Check that the short-term signal is not fighting the dominant higher-timeframe trend.
- Absence of rejection shadows: Watch for long upper shadows or a rapid slide back under the line, both signs the break did not hold.
When structure, volume, and closing data all line up, you have a signal worth acting on. When they do not, sitting on your hands is the trade.
Building a systematic approach to technical triggers
The distance between a random diagonal line and a genuine trading signal is measured in touches, volume, and confirmation. Litecoin’s eighth-touch break carried all three: a heavily tested ceiling, a volume surge that arrived days early, and a decisive close that opened the path toward higher levels.
That is the whole framework in one event. Read the line for its history, wait for volume to confirm the intent, respect the polarity flip on the pullback, and filter ruthlessly for false moves.
The inverted head-and-shoulders is another pattern where multi-touch structure accumulates pressure before a decisive neckline break; Bitcoin’s August 2026 completion of the pattern drove a nearly $4,000 single-session move on volume confirmation, demonstrating that the same breakout logic applies across asset classes and timeframes.
No chart pattern offers a guarantee. Multi-touch trendlines are heuristics, not certainties, which is why risk management, position sizing, stop placement, and patience remains the only genuine edge you fully control.
Your next step is practical. Open your own charts, find the lines that have been respected four or more times, and study the volume profile around each one. The setups worth trading announce themselves in the data before the crowd ever notices.
This article is for informational purposes only and should not be considered financial advice. Investors should conduct their own research and consult with financial professionals before making investment decisions. Past performance does not guarantee future results, and financial projections are subject to market conditions and various risk factors.