
Bitcoin surged nearly $4,000 in a single session to approach $84,000, and the structure behind that move was not random. It was the completion of an inverted head-and-shoulders pattern, one of the more reliable reversal formations in technical analysis.
The $84,000 level is not an arbitrary number pulled from a round-figure instinct. It sits at the confluence of a 38.2% Fibonacci retracement zone, a prior structural high, and a cost-basis cluster for over a million BTC, and the same breakout transmitted directly into double-digit gains across crypto-linked equities on the same session.
That makes this a cross-asset event worth examining carefully. After reading this, you will understand what the pattern actually signals about continuation probability, where the specific risk levels sit that would invalidate the bullish thesis, and why crypto equities moved so much harder than Bitcoin itself. Consider it pattern literacy applied to a live example.
How the bitcoin inverted head-and-shoulders pattern formed, and what the breakout confirmed
The structure that produced this move built itself in three phases, each visible only once the whole thing was complete.
The left shoulder formed during a late-June consolidation while Bitcoin traded in the $60,000 range. The head printed the cycle low beneath it, the point of maximum pessimism where sellers exhausted themselves. The right shoulder then recovered to roughly match the height of the left, and the horizontal line connecting the two shoulder peaks became the neckline, the trigger level that everything hinged on.
Here is the anatomy in plain terms:
- Left shoulder: late-June consolidation base around the $60,000 range
- Head: the cycle low, the deepest point of the formation
- Right shoulder: recovery back toward the left shoulder’s level, completing the symmetry
- Neckline: the horizontal line across both shoulder peaks, acting as the breakout trigger
A confirmed breakout above that neckline occurred around 19 August 2026, and the follow-through was fast.
Valid breakouts typically require volume confirmation at 1.5 to 2 times the 20-day average on the breakout bar; without that participation threshold, neckline pierces carry a materially higher probability of reversing before the measured move is achieved.
Bitcoin moved from approximately $62,000 to nearly $82,000 within days of clearing the neckline.
What happened next matters as much as the breakout itself. Bitcoin pulled back only modestly before resuming its advance, and that behaviour is bullish in its own right. A shallow pullback suggests weaker holders were already flushed out during the head’s formation, leaving fewer sellers to cap the move.
Reading the neckline confirmation
Not every touch of the neckline counts. A valid signal requires a decisive candlestick close above the line, meaning the price settles above it at the end of a session rather than simply spiking through it on an intraday wick and falling back.
That distinction is non-negotiable for reliability. An intraday pierce that fails to close above the neckline is exactly the kind of false signal that traps buyers.
Post-breakout retests of the neckline are common, and they are considered highly encouraging when the former resistance flips to support and holds. The measured move, taken from the depth of the head up to the neckline and projected upward from the breakout, gives you a target range to anchor against. Understanding that projection is what separates informed pattern reading from chasing price after the fact.
When big ASX news breaks, our subscribers know first
What history says about inverted head-and-shoulders reliability
The statistical record for this pattern is stronger than most chart formations, which is precisely why it deserves scrutiny rather than blind faith.
Bulkowski-derived datasets and broader studies cite target achievement rates between 71% and 83%. The outright failure rate is estimated as low as 3-4%. In bull market conditions, target achievement rises to roughly 74%, compared to around 51% for topping patterns, meaning bottoming reversals like this one tend to deliver on their promise more consistently than their inverse.
| Metric | Rate / Figure |
|---|---|
| Target achievement (general) | 71%-83% |
| Target achievement (bull market) | ~74% |
| Topping pattern comparison | ~51% |
| Outright failure rate | 3-4% |
| Crypto false breakout rate (general environment) | 60%-80% |
That last figure looks alarming next to the others, but it does not contradict them. The 60%-80% false breakout rate applies to crypto markets generally, across every setup and pattern. The inverted head-and-shoulders works precisely because it imposes structural conditions, confirmed closes, symmetry, volume, that filter out many of the low-quality setups inflating that broad number.
This is not the first time the pattern has underpinned a major Bitcoin move. Documented formations in 2025 featured necklines at $110,000-$113,000, with measured targets extending to $140,000-$170,000. Binance Square detailed breakouts above $73,000 and $112,000 in that cycle, mapping near-term targets around $120,000.
The 2025 cycle projection reached as high as $360,000, a 217% gain from the neckline, the upper bound of the historical analogue.
Confidence, though, has to be calibrated against failure conditions. Veteran trader Peter Brandt and others flag specific precursors that turn a promising setup into a bull trap: downward-sloping necklines that signal weakening buying pressure, divergence on momentum indicators, weak volume on the breakout bar, and intraday pierces that never produce a confirmed close.
What this gives you is a probabilistic framework rather than a chart curiosity. You can measure the current setup against objective criteria, the volume, the neckline slope, the quality of the close, instead of reacting to sentiment.
Why crypto equities moved harder than bitcoin, and what that tells you
The dispersion on the session told its own story. Bitcoin rose, but the equities built to track it ran far harder.
BitMine Immersion Technologies (BMNR) climbed roughly 14-15% on the session, closing near $26.37-$26.45. Bull (BULL) gained nearly 11%. American Bitcoin (ABTC) posted an approximate 20% move on the commentary date, though a separate reading showed an 8.6% pre-market gain on 20 August 2026 that extended a 12.8% surge from the prior session. Bullish Inc. (BLSH) rose over 11%, having also logged a 13% jump on strong late-August earnings that delivered EPS of $0.10 against $0.09 consensus. Circle Internet Group advanced over 15%.
| Company / Ticker | Reported Session Gain | Notes |
|---|---|---|
| BitMine Immersion (BMNR) | ~14-15% | Closed near $26.37-$26.45 |
| Bull (BULL) | ~11% | Session move |
| American Bitcoin (ABTC) | ~20% | 8.6% pre-market on 20 Aug extended a 12.8% prior surge |
| Bullish Inc. (BLSH) | Over 11% | Separate 13% jump on Q2 EPS beat ($0.10 vs $0.09) |
| Circle Internet Group | Over 15% | Broke into a recent chart pattern |
These outsized moves are mechanical, not speculative excess. Three transmission mechanisms explain why:
Bitcoin’s cross-asset transmission operates through risk-sentiment channels as much as through technical structure, and the August 2026 Hormuz resolution illustrated this directly: a single geopolitical clearance simultaneously drove oil lower, unwound gold’s safe-haven premium, and pushed Bitcoin above $80,000 as broad risk appetite returned.
- Treasury proxies: firms holding BTC directly on the balance sheet see price appreciation flow through to book value and earnings under fair-value accounting rules.
- Mining operating leverage: fixed costs measured against floating block rewards mean margin expansion is non-linear as the price rises.
- Earnings-catalyst compounding: company-specific beats, like the Bullish EPS surprise, stack on top of the Bitcoin-driven move.
The data confirms the amplification is structural. Research indicates treasury-heavy firms exhibit correlation coefficients of 0.52 to 0.8+ with Bitcoin, rolling betas ranging from 1.31 to 1.77, and daily volatility up to 1.57 times that of Bitcoin.
The leverage mechanism explained
Fair-value accounting is the specific link between Bitcoin’s price and a treasury-proxy’s reported earnings. Because these rules mandate that Bitcoin price changes flow directly through income, a holding of meaningful size means every $1,000 move in Bitcoin lands in reported profit or loss.
Miners face a different version of the same dynamic. Power, hardware, and staff are largely fixed costs, while block rewards float with the market, so the entire marginal revenue from a higher Bitcoin price drops toward the bottom line. That makes mining earnings extremely sensitive to price levels.
For anyone weighing crypto equity exposure, the beta and volatility figures are not abstract. They mean a treasury-heavy crypto stock will fall materially harder than Bitcoin itself during a drawdown, and that asymmetry has to be priced into position sizing before the next move, not discovered after it. These stocks are leveraged expressions of Bitcoin, not substitutes for it, and the amplification cuts both ways.
Position sizing for crypto equity exposure requires accounting for both the underlying Bitcoin beta and the additional company-specific leverage layer; Bitcoin’s annualised volatility already runs 3-4 times that of US equities, and treasury-heavy crypto stocks compound that by applying operating leverage on top, meaning a dollar allocation that appears modest can carry outsized portfolio-level risk.
The macro conditions that could interrupt the pattern’s measured move
A clean chart does not exist in a vacuum. The macro backdrop supplies the external variables that operate independently of pattern structure, and they can override even a well-formed breakout.
Three headwinds stand out:
- Fed policy and real yields: higher real Treasury yields, cited in a 1.6%-2.1% range, alongside ongoing balance sheet contraction of roughly $300 billion in additional quantitative tightening, reduce the appeal of assets that pay no yield. Bitcoin is one of them.
- Dollar strength: a strong US dollar contracts global money supply and has historically weighed on Bitcoin, because much of the incremental demand originates outside the United States in currencies that weaken against the dollar.
- Risk-asset correlation: because Bitcoin increasingly trades in step with US equities, a broad risk-off rotation can cap or reverse a technically valid breakout regardless of how clean the structure was.
Dollar strength has acted as a persistent headwind for Bitcoin across multiple cycles because a rising DXY contracts global money supply and compresses the purchasing power of the international buyer base that drives incremental demand; the August 2026 DXY pullback to three-month lows was one of the concurrent macro conditions that allowed the neckline breakout to gain traction.
OSL has warned that a failure to hold $84,000 could lead to a retest closer to $50,000, the downside scenario the current macro environment makes non-trivial.
That is not a base case, but it is the risk the technical picture alone does not show you.
The $84,000 confluence: why this level is decisive
Several factors converge to make $84,000 structurally significant rather than just a round number. XTB has highlighted it as aligning with the 38.2% Fibonacci retracement of the late-2025 decline, reinforced by a prior May high. Cointelegraph noted a CME gap at the level, though that gap is flagged as unverified in the underlying research, alongside a cost-basis distribution of roughly 1.1 million BTC held at an average cost near that price.
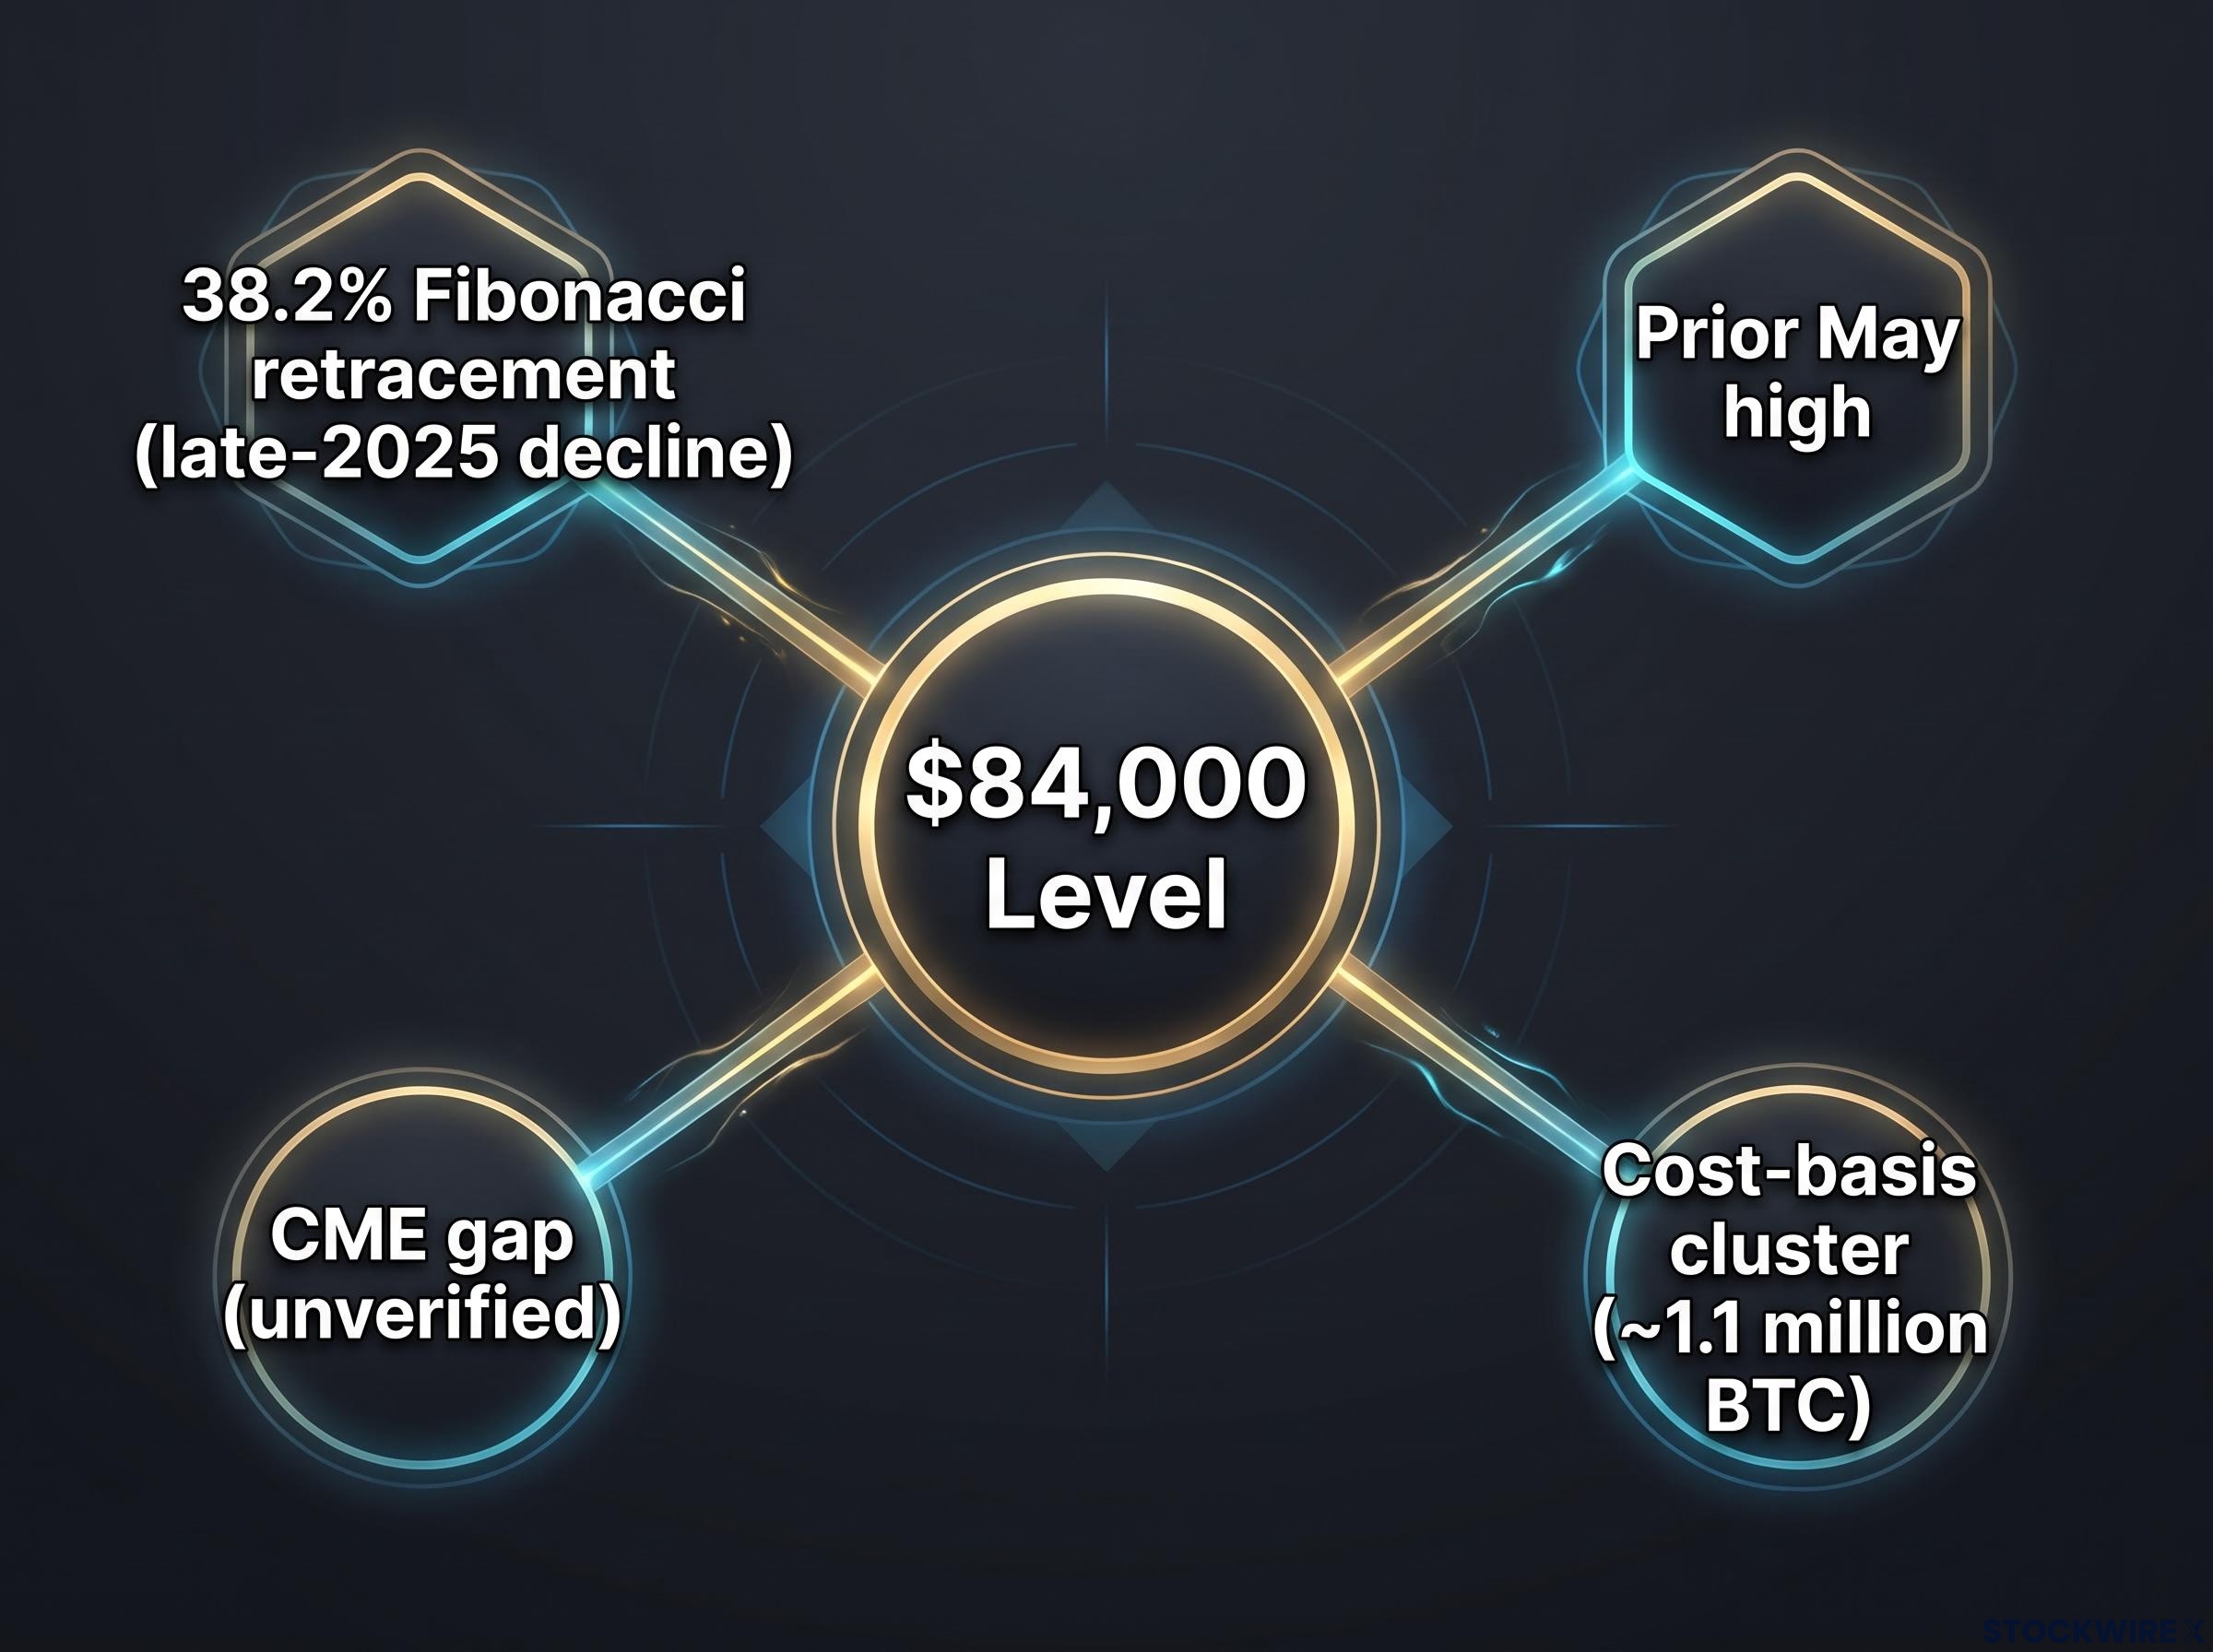
That cost-basis cluster is the practical hurdle. Holders sitting at breakeven have an incentive to sell into strength, which creates natural supply the market has to absorb for the breakout to hold.
If $84,000 clears and holds, the next upside targets cluster at $86,000-$90,000, with higher-timeframe objectives reaching $94,000-$118,000. This is the point where the technical and macro frameworks collide, which is why a confirmed close above it with sustained buying is the single most important data point for anyone watching this setup.
What the pattern completion changes, and what it does not
Pull the threads together and the verdict is calibrated rather than binary. The inverted head-and-shoulders breakout is structurally confirmed, and history favours continuation. The crypto equity performance on the session shows the cross-asset transmission mechanism is functioning. And $84,000 is where the technical odds meet the macro constraints in a single decisive test.
Two specific variables would upgrade this from probable to high-conviction:
- A confirmed weekly close above $84,000 on meaningful volume.
- A neckline retest, if one occurs, that holds as support rather than breaking down.
Clear those, and the upside cascade opens:
- The $86,000-$90,000 secondary zone first.
- Then the $94,000-$118,000 higher-timeframe objectives.
The failure scenario is worth holding in view without dramatising it. If Bitcoin cannot sustain a close above $84,000, the OSL-cited retest toward $50,000 is the structural risk. The pattern’s 3-4% historical failure rate is low, but the 60%-80% general crypto false-breakout environment is the reason confirmation, not extrapolation, is the discipline here.
Your practical takeaway is a framework, not a forecast: two checkpoints to watch, the weekly close and the neckline hold, that cleanly separate the continuation scenario from the failed breakout. That gives you something concrete to monitor in real time rather than a view to defend.
This article is for informational purposes only and should not be considered financial advice. Investors should conduct their own research and consult with financial professionals before making investment decisions.
Past performance does not guarantee future results. Financial projections are subject to market conditions and various risk factors, and the forward-looking scenarios described here are speculative and subject to change based on market developments.