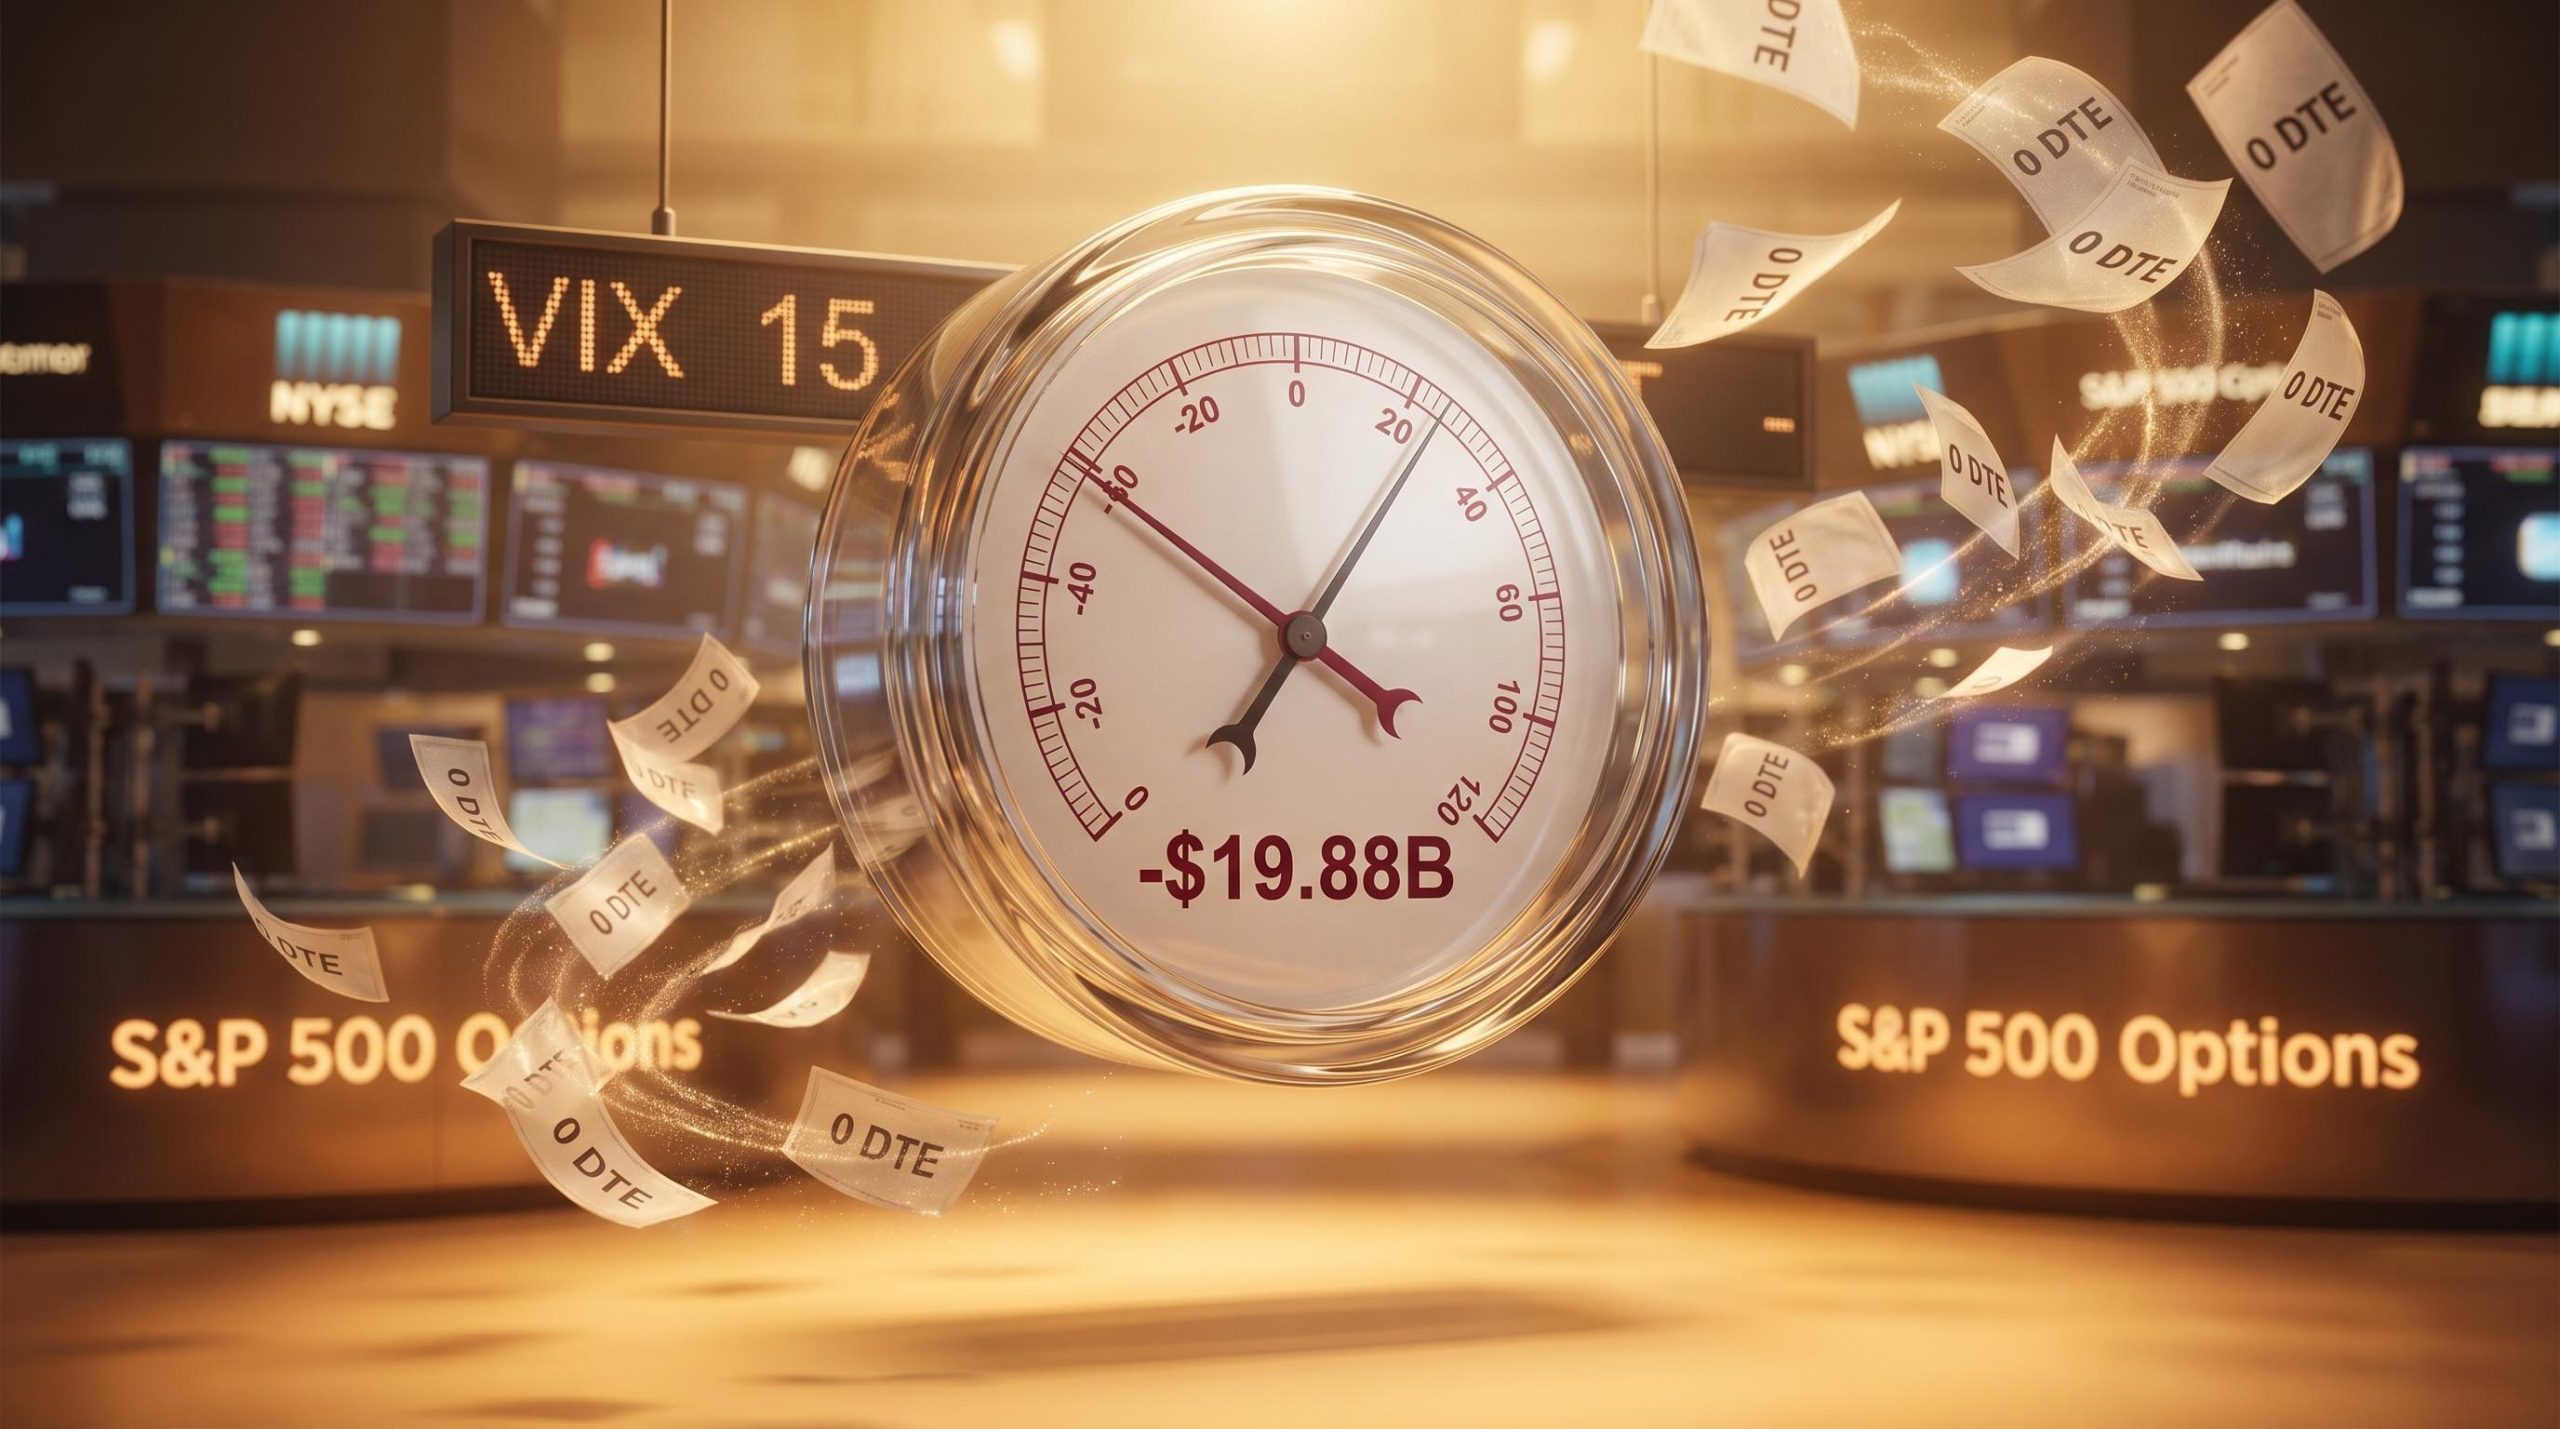
A metric built to measure options-driven selling pressure just hit its most extreme reading in four to five years of data. It registered negative $19.88 billion. On the same session, the S&P 500 fell roughly 75 basis points, less than one percent.
That gap is the whole story. A record signal that should have implied heavy, mechanical selling produced barely a scratch on the index. And the explanation is not that the metric is broken. It is that the metric measures something the market has structurally changed.
Here is what the data actually tells you about how intraday options flow does and does not move markets. You will understand what the HIRO metric measures, why roughly 99% of that record reading came from zero DTE activity, and why knowing the composition of a delta-flow reading matters far more than its headline size when you are trying to read what it means for prices.
What HIRO actually measures, and why it is not a futures-selling scoreboard
Picture a large negative dollar figure plotted intraday against the S&P 500’s price. That is how you encounter HIRO on a screen, and the instinct is to read the negative number as a running tally of futures being dumped. That instinct is exactly the mistake to avoid.
HIRO, short for Hedging Impact of Real-time Options, is a metric developed by Brent Kochuba of SpotGamma. It gauges aggregate delta flow in S&P 500 instruments, expressed as an estimated hedge impact in dollar terms.
Delta mechanics also explain why same-day and longer-dated contracts transmit pressure so differently: an out-of-the-money zero DTE put sees its delta compress toward zero as the session closes without a breach, while an equivalent put with 30 days remaining carries a far more persistent directional exposure that dealers must hedge continuously.
Delta flow is the directional pressure created by options trading. When traders buy puts or sell calls, that generates negative delta, which points toward selling pressure. HIRO sums all of that across the session and plots it against price.
The key word is aggregate. A negative HIRO reading represents net negative delta flow across every counterparty in the session. It is not a count of futures contracts that dealers actually sold.
Think of it as a barometer of buying and selling pressure, not a receipt for executed trades. Whether that pressure translates into real price movement depends entirely on who was on each side of the options. That distinction is what the rest of this article rests on.
The two record readings compared
The clearest evidence that raw magnitude does not predict price impact comes from comparing the record reading against the one before it. The prior largest HIRO reading was negative $18.3 billion, recorded around 10 October, according to SpotGamma. Readings of this size are rare, which makes the two data points worth setting side by side.
| Reading | Magnitude | S&P 500 response | Zero DTE attribution |
|---|---|---|---|
| Record session | -$19.88B | ~-75 basis points | ~99% |
| ~10 October session | -$18.3B | ~-2.75% | Not specified |
Notice what happened. The October reading was smaller, yet it produced a decline roughly 3.5 times larger. A large HIRO number, in other words, is a starting point for analysis, not a conclusion. Its size tells you how much delta flow occurred. It tells you nothing on its own about how much of that flow actually moved prices. Answering that question is where the composition of the flow comes in.
When big ASX news breaks, our subscribers know first
How zero DTE options came to dominate S&P 500 delta flow
To understand why the record reading barely dented the index, you need to understand what that reading was mostly made of. And to understand that, you need the growth story of one instrument: zero days-to-expiration options.
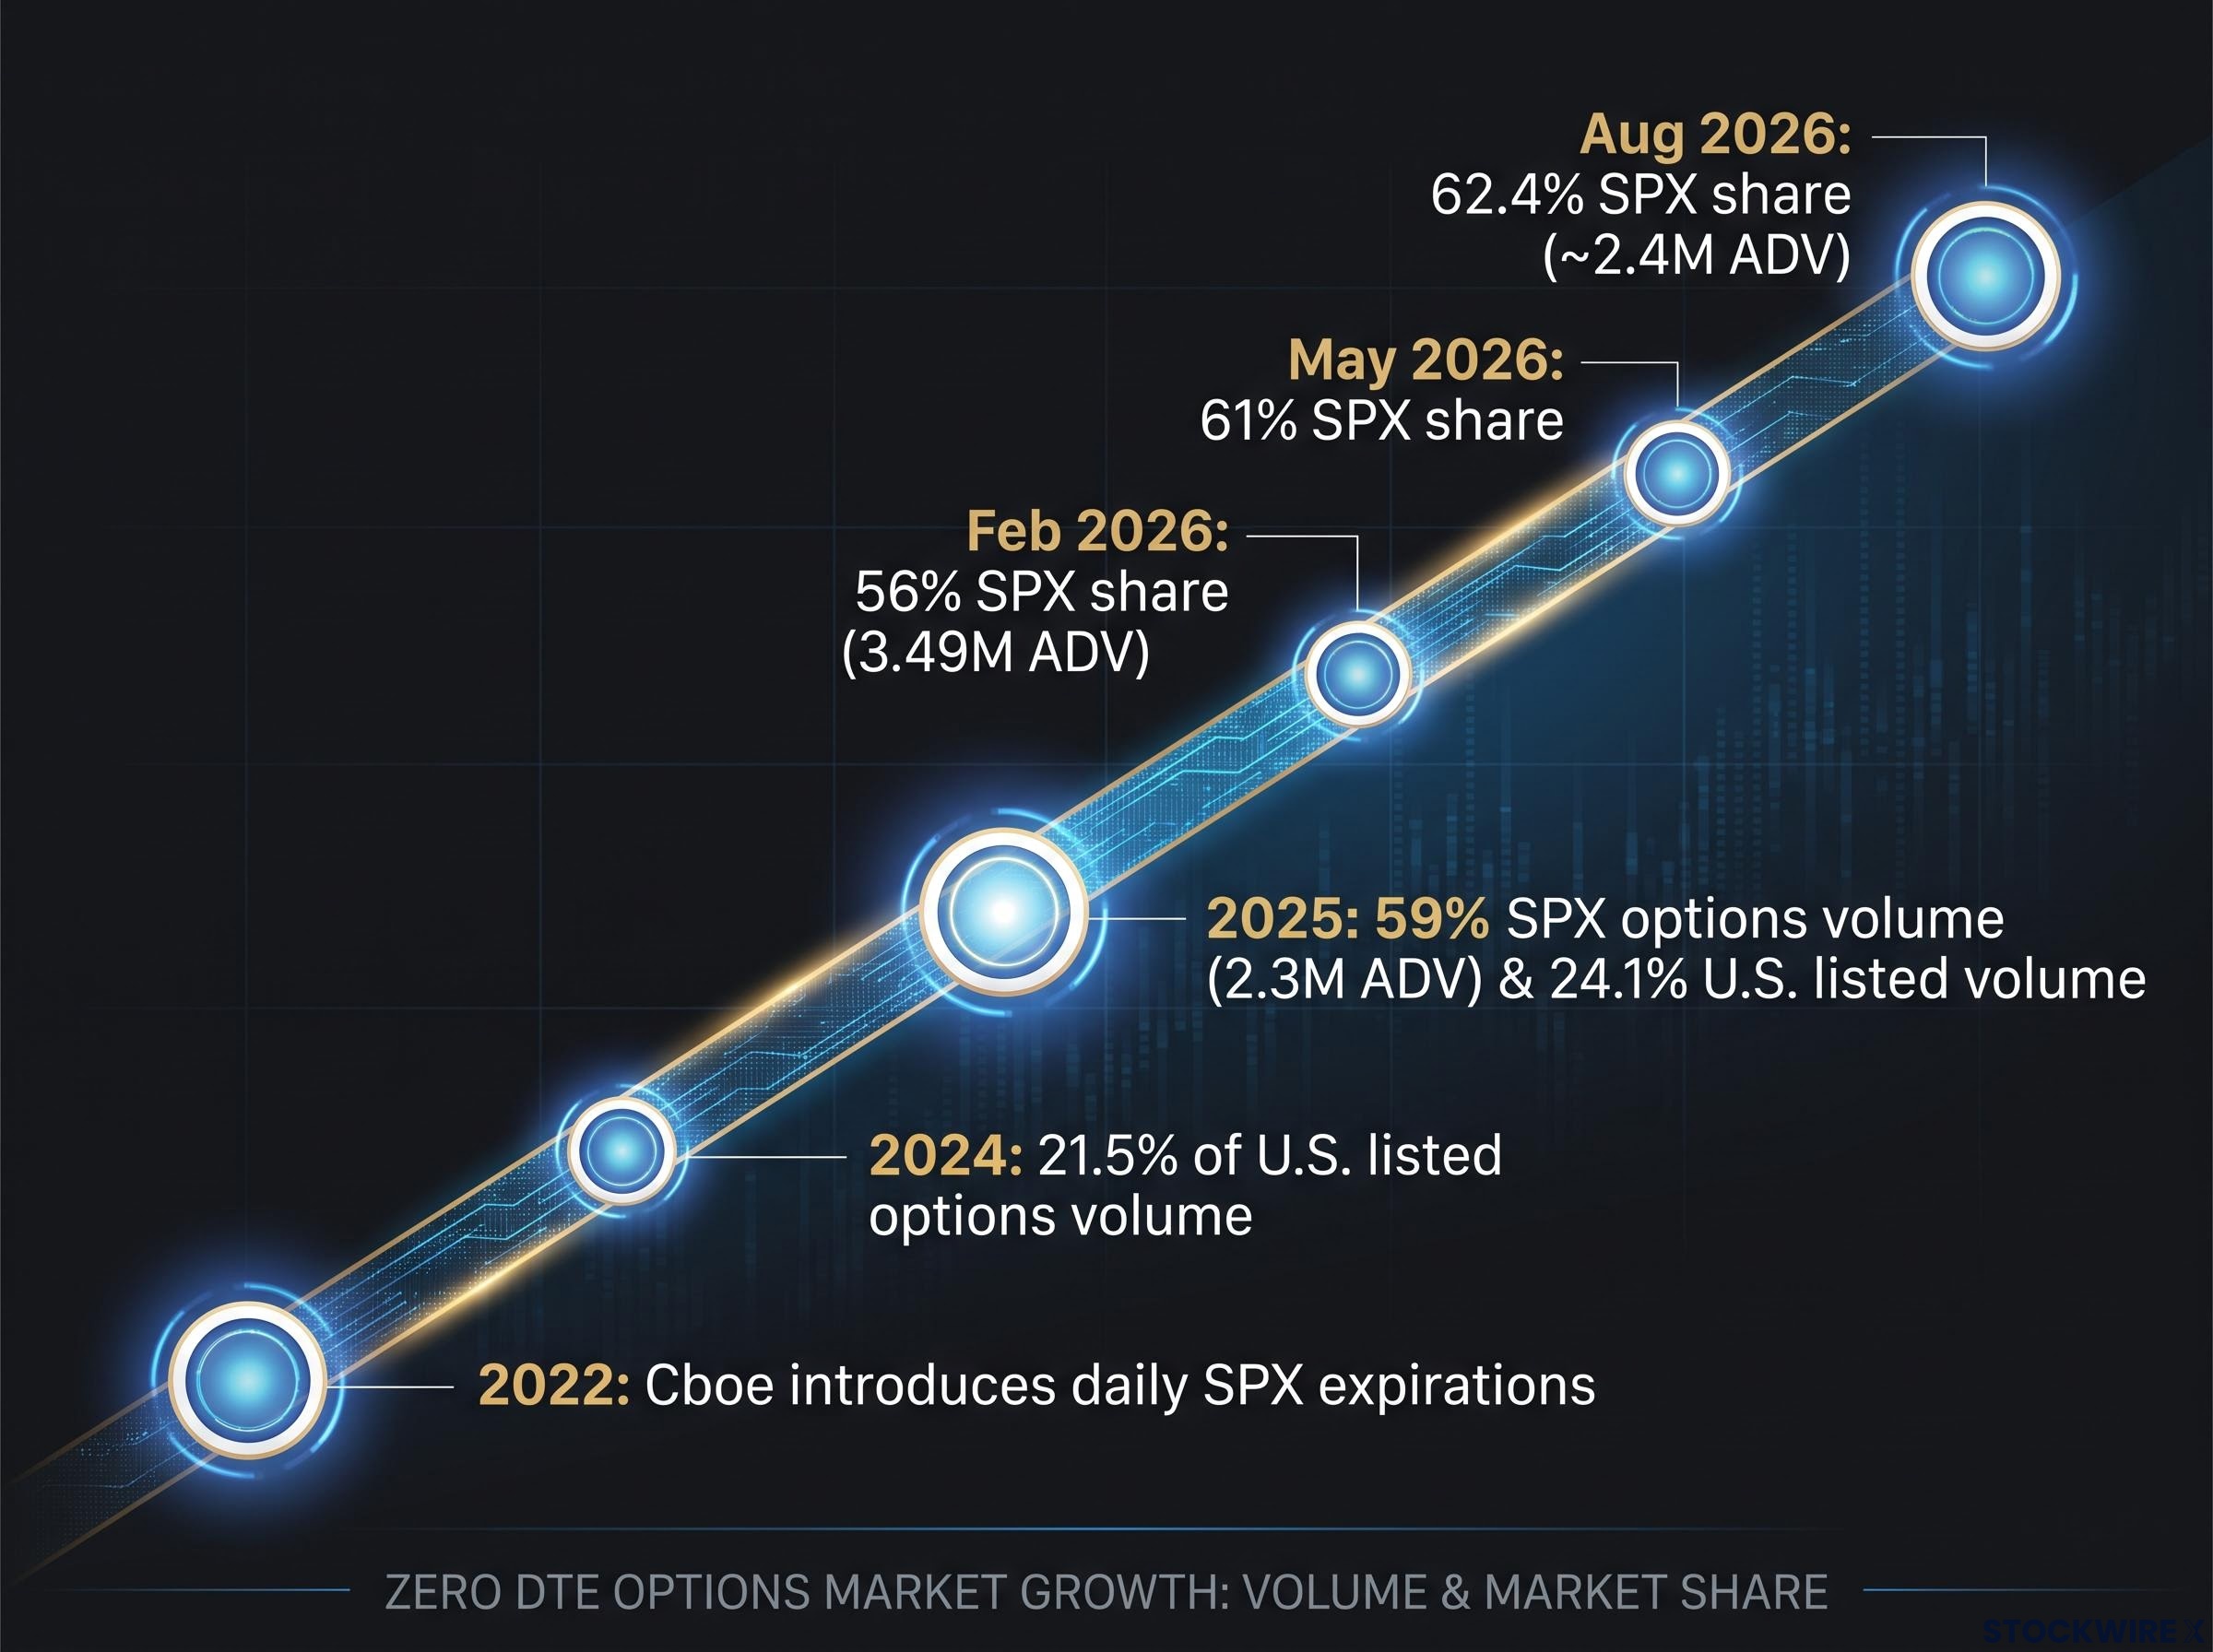
Zero DTE options are contracts that expire on the same day they are traded. Cboe made these available every trading day when it introduced daily SPX expirations in 2022. Since then, SPX zero DTE trading has grown more than five-fold over three years.
Cboe’s 2025 options industry report confirms that zero DTE contracts in SPX averaged 2.3 million contracts daily across the full year, comprising 59% of total SPX product volume, a scale that makes same-day flow the structural centre of any serious reading of daily delta mechanics.
The scale of that rise is easier to see as a sequence of milestones:
- 2022: Cboe introduces daily SPX expirations, making zero DTE available every session.
- Full-year 2025: Zero DTE reaches 59% of total SPX options volume, at an average daily volume of 2.3 million contracts (Cboe, January 2026).
- February 2026: Share settles at 56%, alongside a record monthly SPX options average daily volume of 3.49 million contracts.
- May 2026: Share pushes past 61%, a record at the time.
- August 2026: Share reaches 62.4%, a new record, at roughly 2.4 million contracts per day.
The trend extends beyond SPX. According to OCC and Cboe data cited by Traders Magazine, zero DTE options made up 24.1% of all U.S. listed options volume in 2025, up from 21.5% in 2024.
The appeal is straightforward for both retail and institutional traders. Zero DTE contracts allow intraday hedging with precision, define your risk to a single session, and let you take tactical exposure without carrying a position overnight. Cboe estimates retail activity accounts for 50-60% of SPX zero DTE volume, so this is not a purely professional phenomenon.
Now connect that to the record reading.
Of the -$19.88 billion total, roughly 99%, around $19.5 billion, came from zero DTE activity: put purchases or call sales expiring the same day.
That figure is not market trivia. When a single instrument class accounts for 62% of SPX options volume and generates 99% of a record delta-flow reading, any framework for reading daily S&P 500 options mechanics that does not centre zero DTE is structurally incomplete. It also reframes what a given day’s aggregate delta reading is actually measuring. It is predominantly a snapshot of intraday, same-session activity, not longer-dated hedging positioning that would carry weight over days or weeks.
Why the market barely moved despite a record negative signal
So how does a record negative reading translate into a decline you would barely notice? The answer is mechanical, not mysterious, and it starts with a single question: who was on the other side of those trades?
Here is the transmission gap. Not every zero DTE trade involves a market maker as the counterparty. Only the portion transacted against a dealer who then hedges by selling futures generates the mechanical selling pressure the headline number implies.
When a put is bought from or a call is sold to a dealer, that dealer typically sells S&P 500 futures to neutralise the risk. That hedging is the channel through which options flow actually pushes on prices.
Dealer gamma positioning is the mechanical bridge between zero DTE flow and actual index price movement: gamma on same-day contracts runs 2 to 5 times higher than equivalent weekly contracts and up to 10 times higher near the session close, meaning even modest price moves can force disproportionately large hedging adjustments.
But a large share of zero DTE flow never touches a dealer’s book in a way that requires hedging. Retail-to-retail or institutional-to-institutional matching happens directly between the two sides.
When that occurs, no dealer is left holding risk to hedge, so no futures selling follows. According to SpotGamma’s Kochuba, the market makers’ hedging response to this record flow did not produce anything close to the futures selling the raw delta figure might suggest. The HIRO number counted all the flow. Only a fraction of it converted into pressure on price.
The session conditions that mattered
The counterparty logic explains why the mechanical pressure was weaker than the number implied. The session context explains why it dissipated rather than compounded. These conditions were confirming, not coincidental:
- VIX around 15, despite a historically large move in Treasury yields the same day.
- QQQ up approximately 3%, driven by AI-related news.
- SPY and ES mini futures flows modestly positive on the session.
- Put-to-call open interest ratios near record lows, indicating a broadly under-hedged market.
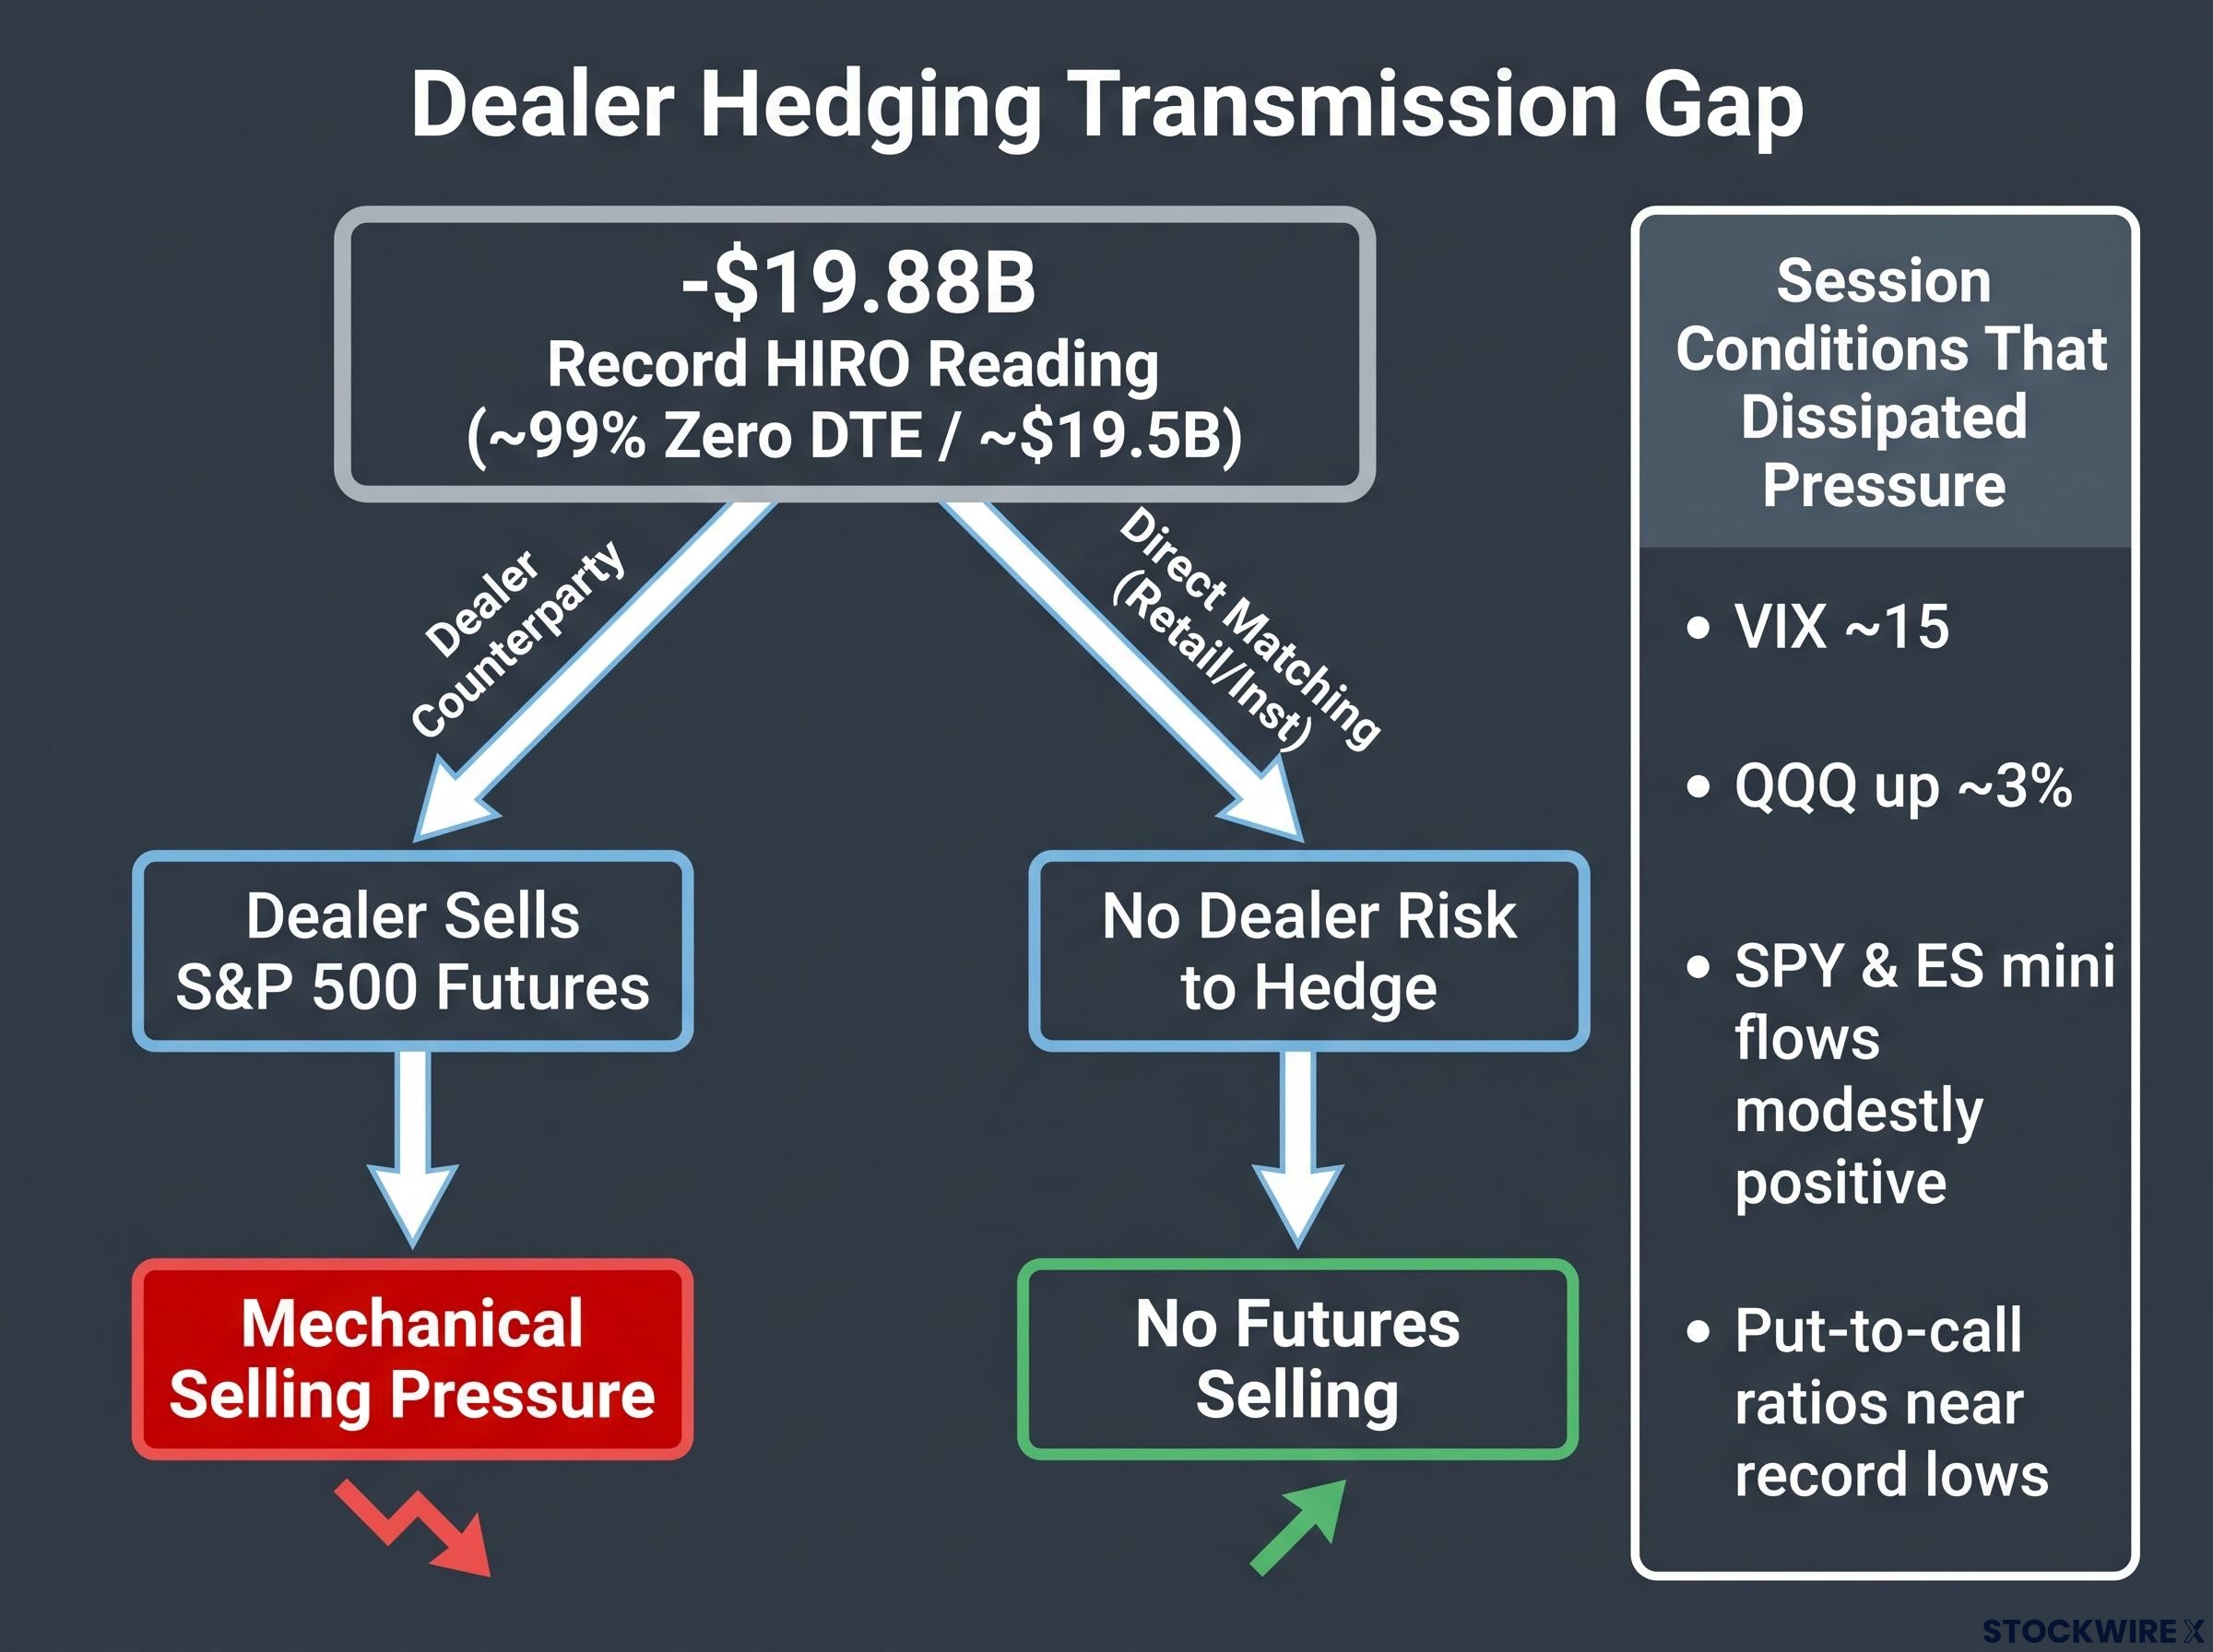
Read those together. A VIX of 15 signals calm. The VIX is the market’s expected volatility over the next 30 days, so a reading that low tells you traders were not pricing turbulence. A Nasdaq up 3% and modestly positive futures flows tell you the broader market was leaning the opposite way from the negative delta reading.
The put-to-call ratio detail is the sharpest one. When it sits near record lows, the market is structurally under-hedged, meaning few traders held protective positions that would force further selling on a downdraft.
There was also a directional pattern underneath it all. Realised volatility over the prior one to two months, the actual size of daily moves rather than expected size, had expressed itself more to the upside than the downside.
Put plainly: the negative delta reading landed inside a market with no structural appetite for downside follow-through. That is why the pressure faded instead of feeding on itself. Size alone was never the signal. Counterparty composition, the VIX level, cross-asset context, and positioning structure together decide whether a large number produces a large move.
What the HIRO reading reveals about using options flow as a market signal
The -$19.88 billion versus -$18.3 billion comparison is the best available evidence for a single practical claim: composition, not headline magnitude, is the variable that matters most when you assess a delta-flow reading’s likely price impact. The smaller reading produced the larger move, which is circumstantial evidence that its flow was composed differently, in a way that transmitted more effectively into futures selling.
When a record-large negative reading is almost entirely zero DTE flow, rather than longer-dated puts or VIX call accumulation, the mechanical futures-selling channel is structurally weaker. Longer-dated instruments signal more sustained bearish positioning with a more direct link to dealer hedging. Same-day contracts settle within the session and do not.
There is a structural reason this holds. According to Eco3min, drawing on Cboe data, zero DTE options primarily affect intraday hedging and gamma positioning rather than the 30-day expectation embedded in the VIX.
Because these contracts settle within the session, large zero DTE readings can occur without inflating the 30-day implied volatility that the VIX tracks. The intraday pressure and the 30-day fear gauge are measuring different things.
That is why a record delta reading and a VIX of 15 can coexist. They are not contradicting each other.
VIX signal interpretation has grown more complicated since 2017, when the index moved through structurally distinct regimes that make a routine mid-teens reading mean something different today than it did in earlier cycles, which is why treating the VIX as a simple fear gauge can mislead analysts who do not account for the options-market microstructure driving it.
Before you treat any large delta-flow reading as a directional signal, run it through three questions:
- What drove the reading? Zero DTE flow, or longer-dated puts and VIX calls? Same-day flow transmits weakly. Longer-dated positioning transmits with more force.
- Who were the likely counterparties? Dealer-intermediated flow generates hedging pressure. Flow matched directly between non-dealers does not.
- What does the cross-asset environment confirm or contradict? A VIX level, the Nasdaq’s direction, futures flows, and the put-to-call ratio will tell you whether the reading is aligned with broad positioning or fighting it.
Two honest limitations. No post-2024 public research provides a detailed delta-to-futures transmission model, so the mechanism above rests on SpotGamma’s commentary rather than a formal quantitative study. And the specific session behind the record reading has not been publicly corroborated beyond that commentary. As long-run context, the VIX has averaged roughly 3.2 percentage points above 30-day realised volatility since 1990, per Eco3min analysis, which is the baseline against which today’s low readings should be judged.
Making sense of zero DTE in a market that keeps shrugging off the signals
The record reading did not happen in isolation. Kochuba has described a pattern stretching back roughly six weeks before it: equity markets repeatedly resisting sell-offs despite multiple catalysts and large negative pressure indicators. Across macro, volatility, and options-flow methodologies, analysts struggled to fully explain the degree of support underneath prices.
The record HIRO reading fits that pattern rather than breaking it. When the dominant source of negative delta is same-day flow that does not mechanically convert into futures selling, the old assumption that a big negative reading forces a big decline simply stops holding.
Read charitably, this is a stabilising feature, not a puzzle. Multiple post-2024 sources, including Cboe, Traders Magazine, and Eco3min, frame zero DTE growth as expanding intraday hedging capacity and finer tail-risk management rather than as a destabilising force. Notably, no named post-2024 source in the reviewed literature argues that zero DTE activity structurally destabilises intraday S&P 500 pricing.
What remains genuinely uncertain is worth stating plainly. The specific session is not publicly corroborated. The delta-to-futures transmission model is not formally documented in post-2024 academic work, though a Cboe working paper from August 2025 is the closest available treatment of zero DTE’s volatility impact. And the 62.4% record share in August 2026 tells you the shift is still unfolding, not settled.
The takeaway is a reorientation rather than a verdict. Zero DTE’s dominance is not a temporary quirk to be read through old frameworks. It is the new baseline, and the tools you use to interpret options flow now need to weigh the composition of a reading as heavily as its size.
Investors exploring the specific ways zero DTE flow can turn against a trader rather than the market will find our full explainer on zero DTE position risk, which examines how rolling losing short spreads converts a defined-risk position into compounding losses across a single session.
This article is for informational purposes only and should not be considered financial advice. Investors should conduct their own research and consult with financial professionals before making investment decisions. Past performance does not guarantee future results, and figures cited derive from specific sources that may not be independently corroborated.