
Stock Valuation When the Price and Financials Tell Different Stories
just now

Tesla’s stock trades at roughly 181x forward price-to-earnings on a net profit margin of approximately 2%. By one reading, that is uninvestable. By another, it may be among the most rational bets in the market. Both conclusions can hold simultaneously, because each one depends entirely on which version of Tesla’s future the investor believes is most likely to materialise. The same stock, at the same price, represents either a deeply overvalued automaker or a fairly valued AI and robotics platform. That is not a disagreement about arithmetic. It is a disagreement about what kind of company Tesla is becoming. Q1 2026 earnings, reported on 22 April 2026, sharpened the tension: revenue rose 16% year-over-year to $22.39 billion, gross margin came in at 21.1%, earnings per share of $0.41 beat consensus, and the stock still fell 3.56% on the day. The debate is not about last quarter. It is about the next five years. This guide uses Tesla’s current valuation as a live classroom to teach a broadly applicable stock valuation analysis methodology: how to structure bull and bear case scenarios, why the multiple applied must match the business being modelled, how negative free cash flow during a transition should be interpreted, and why the price paid at entry is often more consequential than the quality of the business itself.
A 181x forward price-to-earnings ratio sounds like a verdict. It is not. It is a ratio of two things, and both the numerator and the denominator are doing different work for Tesla right now.
The numerator (approximately $380 per share) reflects a price set by investors who are not paying for what this company earns today. The denominator (approximately $2.10 in full-year 2026 estimated earnings per share) reflects a business currently operating on a 2.13% net profit margin, with net income of $477 million on $22.39 billion in Q1 revenue. That margin is thin enough that the multiple balloons to a figure that invites reflexive dismissal.
The market’s actual bet is encoded in what the multiple is paying for, and it is paying for three distinct layers:
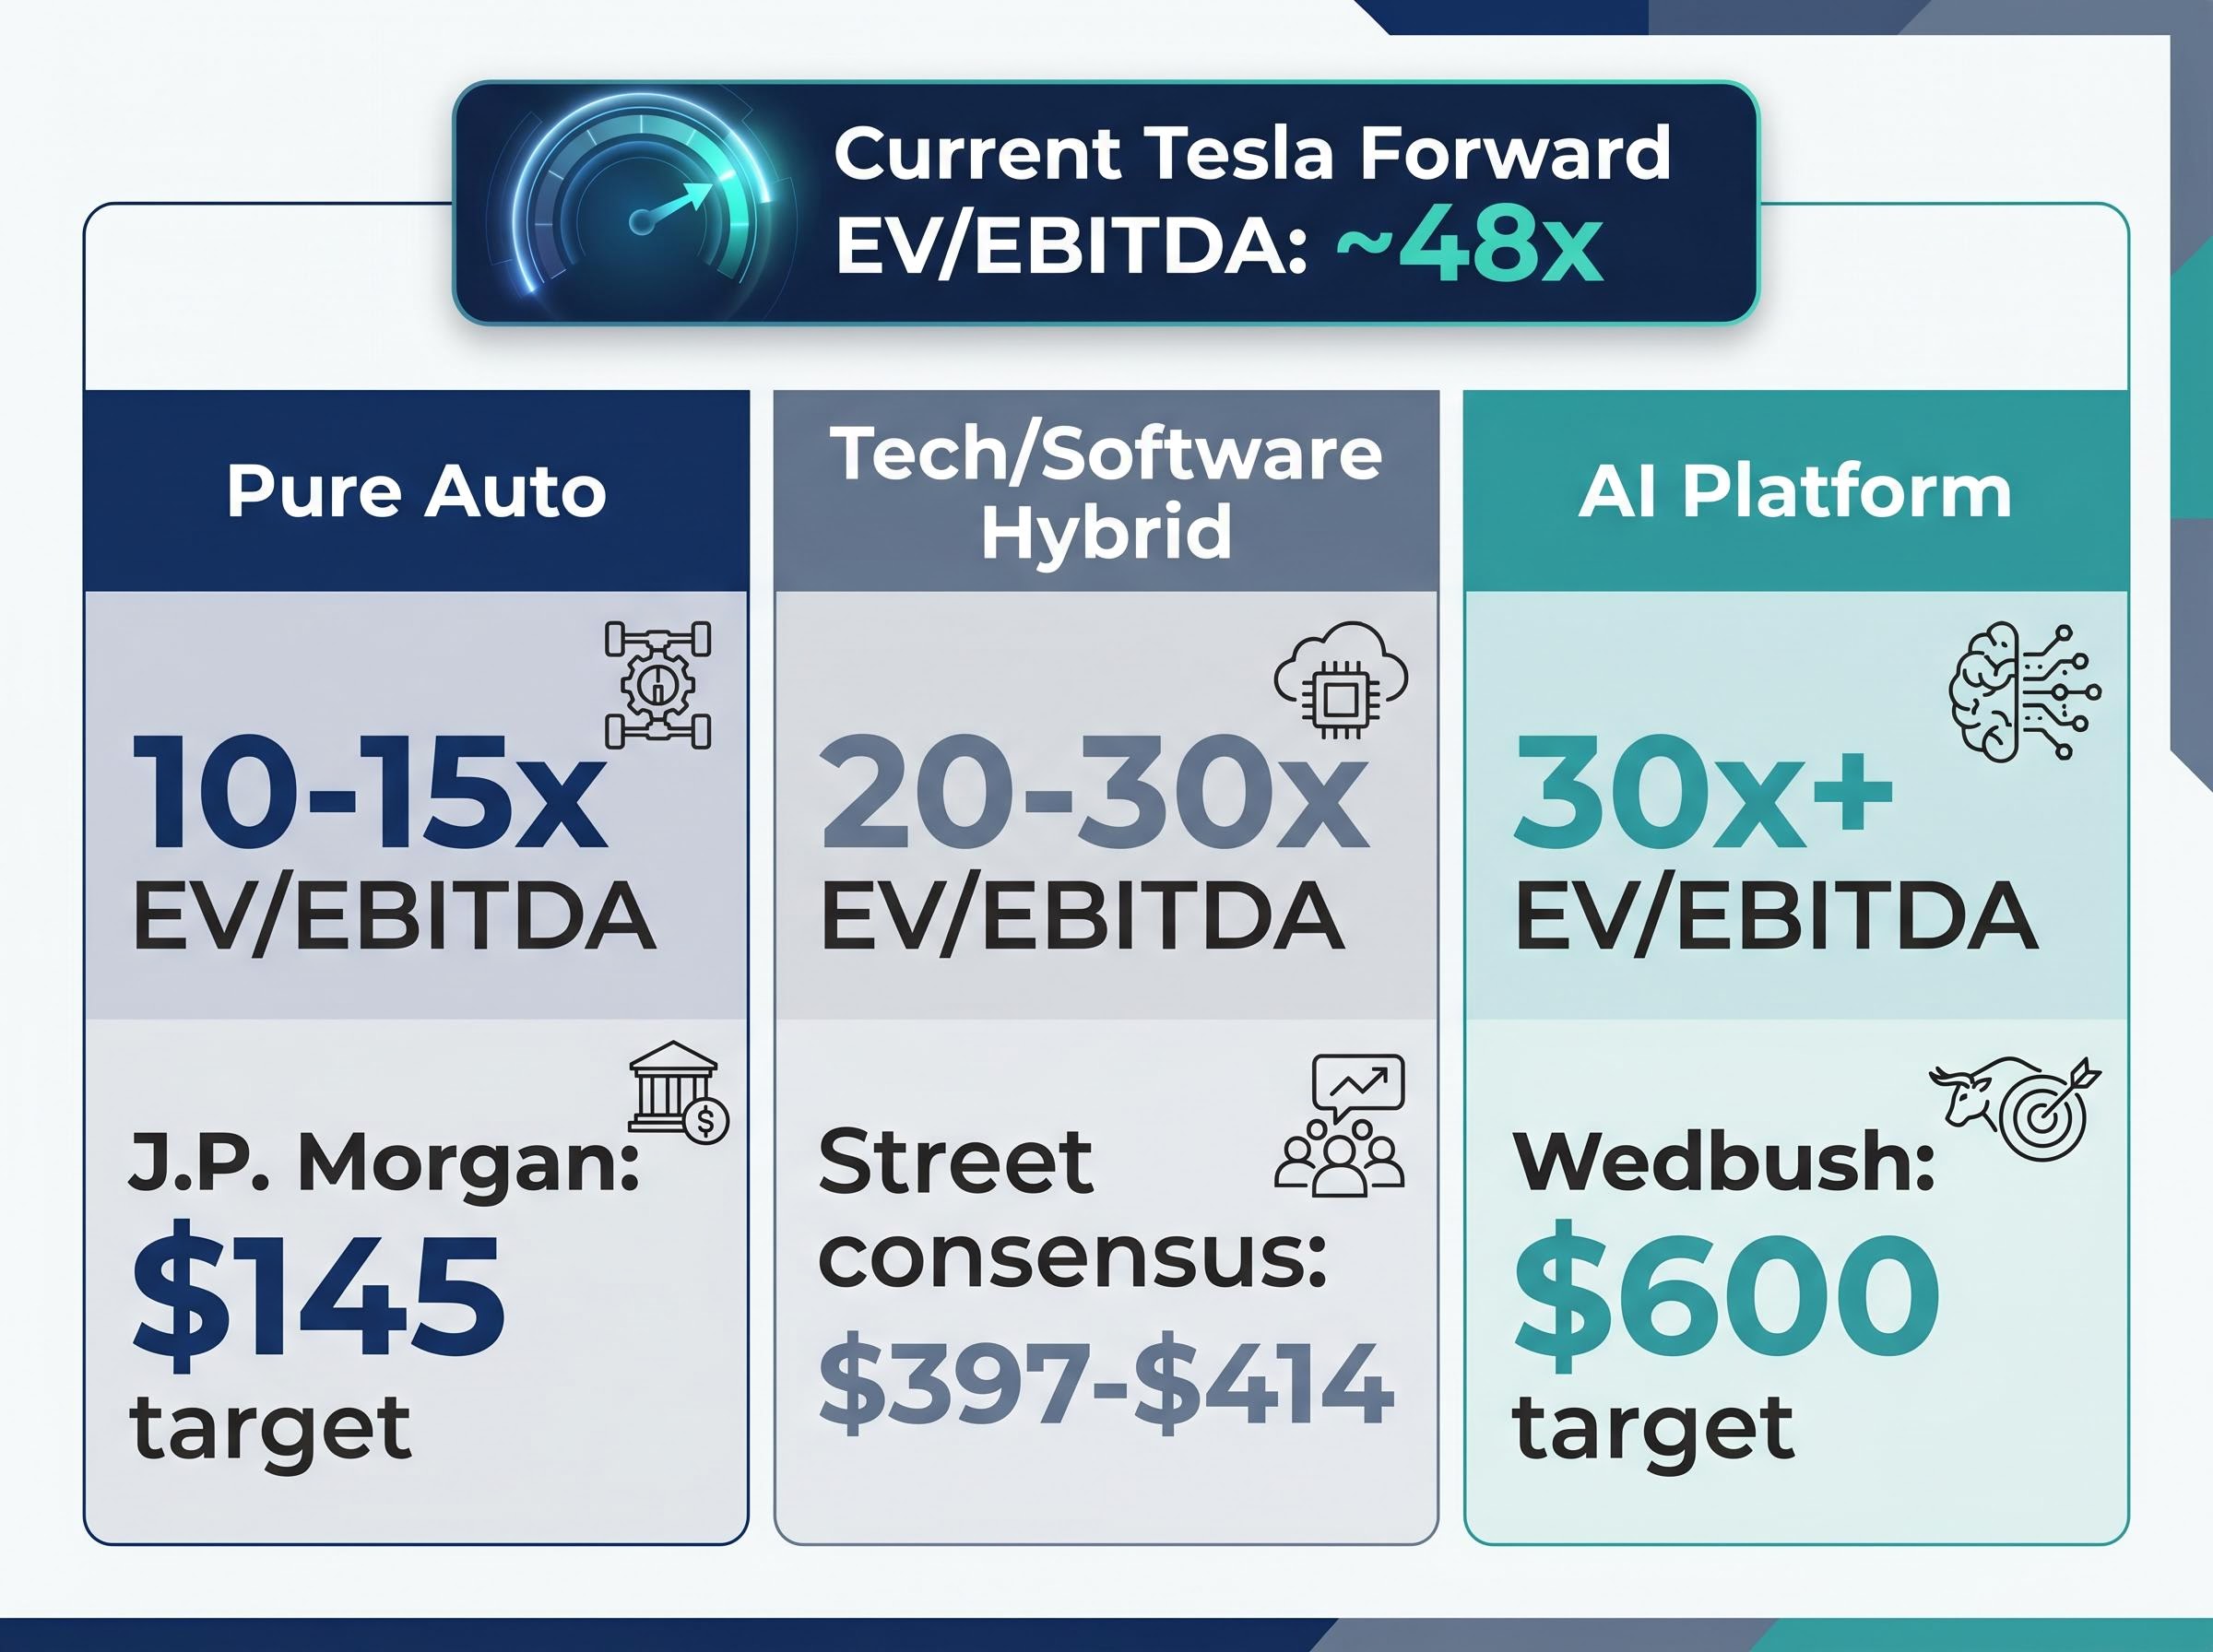
At a forward EV/EBITDA of approximately 48x, Tesla trades at more than three times the multiple of auto peers (10-15x) and well above tech peers (20-30x). That gap is the market’s probability-weighted average of multiple futures, most of which involve earnings that look nothing like today’s.
At this multiple with a thin margin, there is no buffer. One weak print carries weight.
Investors who dismiss Tesla as obviously overvalued and investors who dismiss the concern entirely are making the same error: treating a single multiple as a conclusion rather than recognising it as a compressed summary of contested assumptions. Understanding what the multiple encodes is the first step toward building a framework that can handle genuine business model uncertainty.
The valuation gap between Tesla and its peers exists precisely because the market has not agreed on which peer group applies. If Tesla is an automaker, 10-15x EV/EBITDA is the relevant benchmark, and the stock is dramatically overpriced. If it is a technology company, 20-30x applies, and the premium narrows. If it is an AI and robotics platform, even higher multiples may be defensible.
This is the classification problem, and it is not unique to Tesla. Any company transitioning between business models forces the same analytical question: which valuation framework matches the business you are assuming will exist, not the business that exists today? Applying the wrong framework produces systematically misleading results in either direction.
The NYU Stern relative valuation framework developed by Aswath Damodaran establishes that EV/EBITDA multiples are only meaningful when compared across companies with equivalent growth prospects and capital structures, which is precisely why applying auto-sector multiples to a company with optionality on AI and robotics revenues produces a systematically distorted picture.
The analyst price target range illustrates how classification drives conclusions. J.P. Morgan’s $145 target treats Tesla primarily as an auto manufacturer facing margin compression. Wedbush’s $600 target treats it as an AI platform with approximately 50% probability weighting assigned to AI and robotics success. Street consensus sits at $397-$414, a middle ground that reflects unresolved classification rather than analytical conviction.
Analyst price target divergence of this magnitude reflects competing probability weights on fundamentally different companies, not disagreement about arithmetic; Wedbush’s $600 and J.P. Morgan’s $145 are both internally consistent outputs from models that share almost no assumptions about which business Tesla will primarily be in by 2030.
Operational signals suggest the transition is more than rhetorical. A portion of Tesla’s Fremont facility is being repurposed from Model S/X production to Optimus robot manufacturing. Factory floor decisions reflect real capital allocation choices, and this one points toward a company actively reallocating physical infrastructure from its legacy business toward its aspirational one.
| Business Model Classification | Representative EV/EBITDA Multiple | Implied Valuation Verdict for Tesla | Example Analyst Stance |
|---|---|---|---|
| Pure Auto | 10-15x | Significantly overvalued | J.P. Morgan ($145 target) |
| Tech/Software Hybrid | 20-30x | Moderately overvalued | Street consensus ($397-$414) |
| AI Platform | 30x+ | Potentially fairly valued | Wedbush ($600 target) |
The classification choice should be documented as a stated assumption, not buried in the multiple selection. When new evidence arrives, whether a quarterly margin miss, a regulatory delay, or a product milestone, the investor can then stress-test that specific assumption rather than reworking an entire model without knowing which input changed.
Wedbush provides one example of transparency: its $600 target explicitly assigns approximately 50% probability weighting to AI and robotics success. That assumption is visible, testable, and updatable. Most investors never make theirs explicit, which means they cannot systematically update when conditions shift.
A scenario framework requires specifying three variables for each case. Each variable encodes a specific claim about the company’s future:
The dramatically different outcomes for Tesla, from $145 to $600, emerge directly from different inputs to these three variables, not from analytical error on either side.
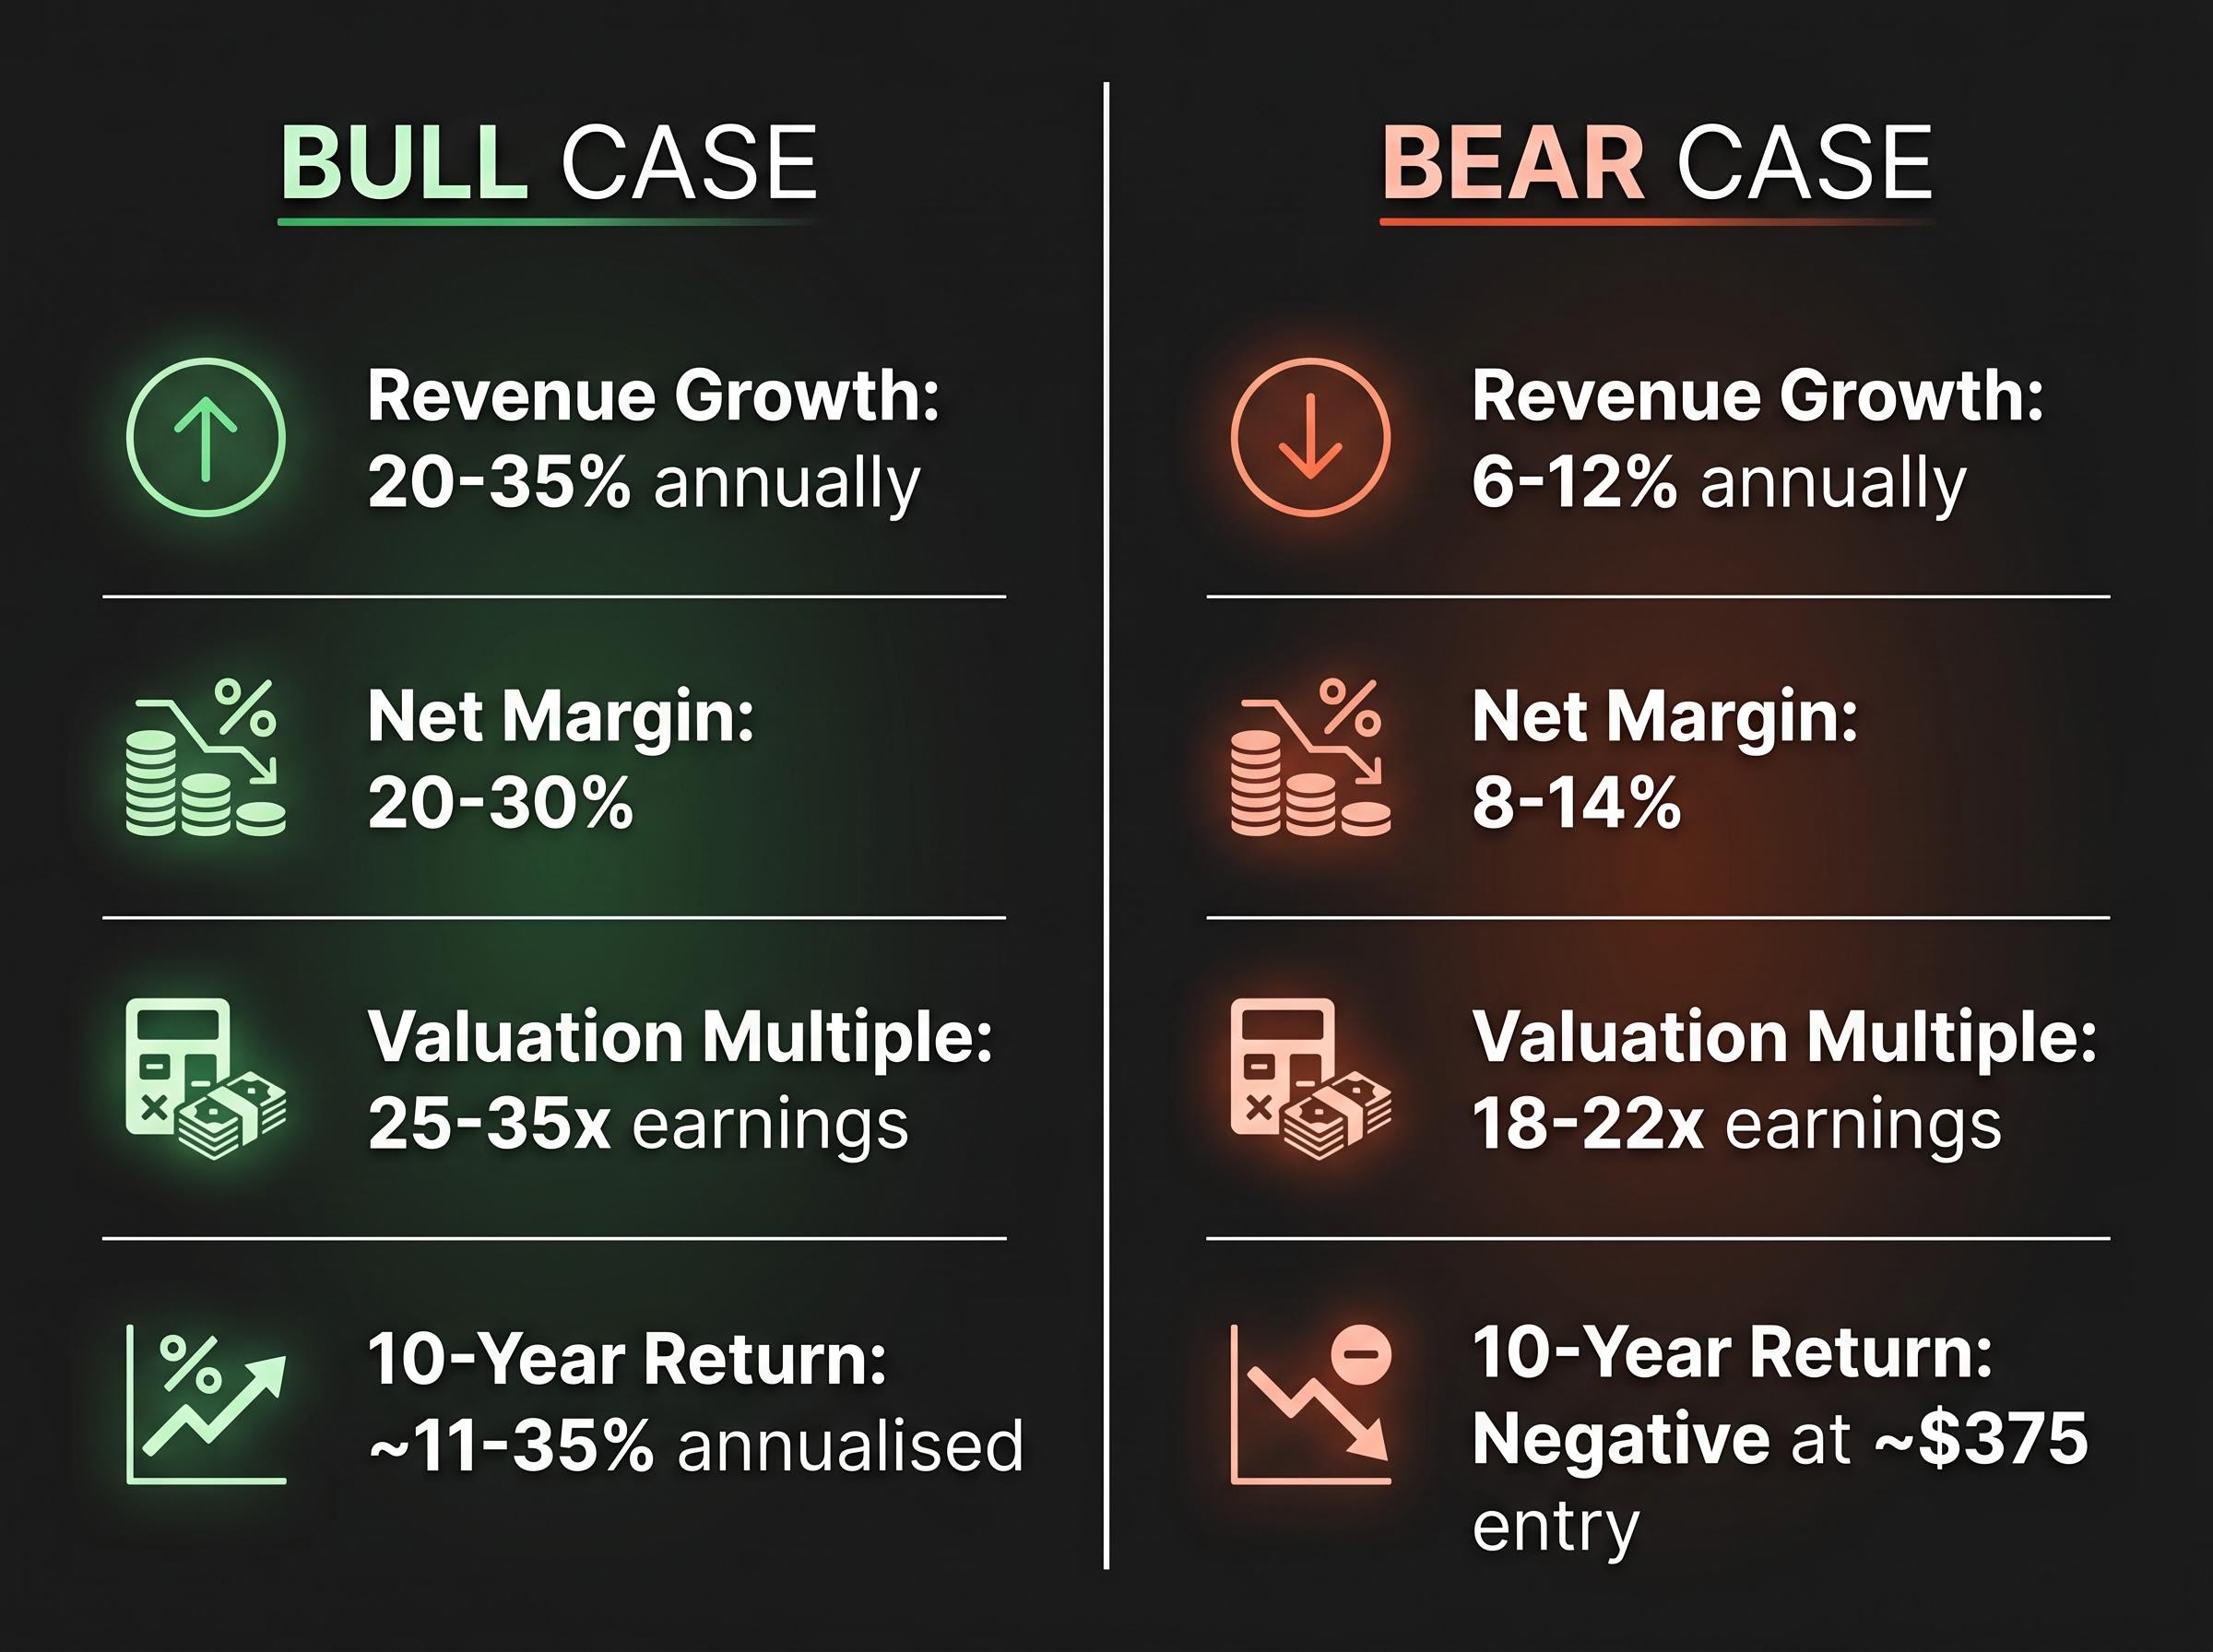
The bull case assumes revenue growth of 20-35% annually (midpoint approximately 27%), net margins expanding to 20-30% as software revenue scales, and a terminal earnings multiple of 25-35x. Each assumption maps to a specific business development: Robotaxi revenue reaching $500 million or more annually by 2027, FSD annual recurring revenue continuing above $546 million and accelerating, and Optimus reaching early commercial deployment. Consensus 2027 estimates of approximately $120 billion in revenue and approximately $3.50 EPS, stepping up to approximately $150 billion and approximately $5.00 EPS in 2028, underpin these targets. At these inputs, annualised returns over ten years range from approximately 11% to 35%, though the probability weighting on this outcome is estimated at roughly 5-10% for the most optimistic scenario.
The bear case assumes revenue growth of 6-12% (midpoint approximately 9%), net margins of 8-14% reflecting a strong but conventional EV manufacturer facing structural pricing pressure from BYD, and a terminal multiple of 18-22x. At approximately $375 per share, all modelled return outcomes in the bear case are negative. Bears typically weight AI and robotics success at 20-30% probability, producing targets of $145-$300.
| Variable | Bull Case | Bear Case |
|---|---|---|
| Revenue Growth Assumption | 20-35% annually | 6-12% annually |
| Net Margin Assumption | 20-30% | 8-14% |
| Valuation Multiple | 25-35x earnings | 18-22x earnings |
| 10-Year Return Estimate | ~11-35% annualised | Negative at ~$375 entry |
| Probability Weighting | ~50% (Wedbush); ~5-10% (most optimistic) | ~70-80% (bear analysts) |
A scenario framework converts a vague opinion about a stock into a testable set of claims. When the evidence updates, the scenario updates. This is the discipline that separates probabilistic investing from narrative investing.
For investors who want to go beyond the three-variable scenario framework and apply the professional toolkit that institutions use on platform-transition companies, our dedicated guide to sum-of-the-parts valuation covers the DCF, SOTP, and probability-weighted ensemble approach in detail, including how shifting a robotaxi scenario from 30% to 10% probability moves the blended intrinsic value more than any revenue growth assumption change does.
Negative free cash flow is not inherently a negative signal. It depends entirely on whether the capital being deployed is generating returns above the cost of capital on a reasonable timeline. A company building a factory that will produce revenue in 18 months is in a fundamentally different position from one burning cash to sustain an unprofitable operation.
Tesla’s 2026 consensus free cash flow (FCF) of approximately -$8.5 billion sits in a grey zone between those two interpretations. The $25 billion+ in planned capital expenditure is directed at infrastructure that will not contribute material revenue until 2027 at the earliest: Optimus production lines, AI5 chip development, Cybercab manufacturing, and Dojo AI training capacity. The spending is forward-looking. The question is whether the timeline holds.
The timing risk is specific and measurable. Tesla’s core auto business currently operates at approximately 2.13% net profit margin, with Q1 2026 auto gross margin of 21.1% reported (approximately 19.2% excluding regulatory credits, aided by one-time warranty and tariff items). BYD sold 310,389 battery-electric vehicles in Q1 2026, continuing to apply structural pricing pressure that makes margin recovery harder. The core business must sustain funding for the capex cycle while Robotaxi and Optimus remain pre-revenue, compressing the buffer for execution slippage.
Elon Musk’s timeline track record adds a layer of caution. In 2019, Musk projected one million robotaxis operating by end of 2020. In 2021, Optimus was described as deployment-ready by 2022. Neither materialised on schedule.
Execution risk outside any scenario model deserves separate treatment: Waymo had completed approximately 2 million paid rides by March 2026 while Tesla held no commercial robotaxi permit in any major US market, a competitive gap that does not appear in revenue or margin assumptions but materially changes the probability weighting on the bull case.
The pattern suggests that the innovations eventually materialise, but often later and at lesser scale than originally announced. For a 2026 investor paying 2028 prices, that timing gap is the central risk.
In the bull case, FCF turns sharply positive in 2027-2028 as Robotaxi revenues layer in. In the bear case, FCF remains negative longer as capex needs persist and the core auto margin fails to stabilise. The milestones that would confirm the capex is converting to revenue include:
Q2 2026 auto gross margin (excluding one-time items) offers a near-term, observable signal. Above 18%, the core business demonstrates sufficient margin stability to sustain the capex cycle without balance sheet stress. Below 18%, the margin compression narrative gains traction and puts the bear case in motion. This single metric updates the scenario weighting months before 2027 Robotaxi data arrives.
Entry price is not a market-timing concept. It is a return-expectation calibration tool, and Tesla’s own price history demonstrates the mathematics with unusual clarity.
An investor who purchased Tesla at approximately $100 a few years prior faces a dramatically different return distribution than one entering at approximately $375-$380 today, even if the underlying business performs identically from this point forward. The first investor has already accumulated enough unrealised gain that the bear case still produces an acceptable outcome. The second investor has no such buffer.
At approximately $375, the bear case produces negative returns across all modelled outcomes. That is not a general concern about volatility. It is a specific, quantifiable risk: there is no scenario in the bear case where the investor makes money. The bull case offers annualised returns of approximately 11-35% over ten years, but that outcome requires the most optimistic probability weighting, estimated at roughly 5-10% for the upper end.
Forward EPS is projected to grow more than 5x from current levels per consensus estimates. That growth is already substantially priced in at 181x forward P/E. The $145 to $600 analyst spread, a 4x gap, means the entry price question is not about marginal value. It is about which future receives the higher probability weighting, and how much of that future is already reflected in today’s price.
| Entry Price | Bear Case Return Implication | Bull Case Return Implication | Margin of Safety Assessment |
|---|---|---|---|
| ~$100 (historical) | Still positive in most scenarios | Substantial multi-bagger potential | High probability discount embedded |
| ~$375 (current) | Negative across all bear outcomes | ~11-35% annualised (10-year) | Minimal; requires bull case to materialise |
| ~$450 (near peak) | Deeply negative | Compressed even in optimistic scenarios | None; full bull case priced in |
Before committing capital to any high-optionality stock, three entry price questions deserve explicit answers:
If the bear case produces no scenario where the investor makes an acceptable return, the entry price carries a cost that no amount of business quality can offset.
The $145 to $600 analyst dispersion, a 4x spread, is not confusion. It is a quantified set of open questions, each of which will be answered by specific observable metrics over the next 12-18 months. Rather than waiting passively, investors can define the signals that update their scenario weighting in real time.
Three overarching categories of risk are being monitored:
| Signal | Bull Case Threshold | Bear Case Trigger | Why It Matters |
|---|---|---|---|
| Q2 2026 Auto Gross Margin (ex-one-time items) | Above 18% | Below 18% | Validates or invalidates margin stability narrative |
| FSD Annual Recurring Revenue | Continued growth above $546M | Stagnation or deceleration | Proof-of-concept for software revenue model |
| Robotaxi Revenue (2027) | $500M+ initial ramp | Delay beyond 2027 | Make-or-break for high-multiple justification |
| California DMV Permit Filings | Filed and progressing | Absent or stalled | Measures gap between stated ambition and regulatory readiness in the largest US market |
| 2026 FCF Outcome vs. ~-$8.5B Consensus | Better than -$8.5B | Worse than -$8.5B | Signals capex efficiency or execution slippage |
| Autonomous Vehicle Miles Driven | Continued year-over-year acceleration | Plateau or decline | Leading operational indicator ahead of commercial revenue |
Autonomous vehicle miles driven nearly doubled in Q1 2026 year-over-year, providing one of the few leading operational indicators ahead of commercial revenue. California DMV permit filings, currently absent for Tesla’s Robotaxi programme, represent the most visible gap between stated ambition and operational readiness.
A scenario framework without a monitoring plan is incomplete. The analytical value of building bull and bear cases is fully realised only when the investor knows in advance which data points will confirm, weaken, or invalidate each scenario.
Monitoring triggers defined before purchase, such as auto gross margin thresholds, regulatory permit progress, and capex efficiency ratios, give the scenario framework its practical utility; without pre-specified thresholds, quarterly data points become Rorschach tests that investors interpret to confirm whichever view they already held.
This guide has walked through a six-step methodology using Tesla as the case study: understand what the multiple encodes, classify the business model explicitly, build scenario frameworks with three specified variables, assess free cash flow timing risk, calculate return implications at entry price, and construct a signal monitoring plan.
The lesson is not a verdict on Tesla. It is a demonstration that any stock where the market disagrees this widely about the future, where a 4x price target spread separates the most bearish from the most bullish view, requires scenario-based thinking rather than a single-point valuation.
The next time a stock appears obviously overvalued or obviously a bargain, run the scenario framework first. Specify the revenue growth assumption, the net margin assumption, and the terminal multiple. Weight the probabilities. Map the return at each entry price. Let the framework speak before reaching a conclusion.
The methodology is replicable. Apply it to one other high-optionality stock on your watchlist this week, using the same three variables, and test whether the market’s price reflects a probability weighting you agree with.
This article is for informational purposes only and should not be considered financial advice. Investors should conduct their own research and consult with financial professionals before making investment decisions. Past performance does not guarantee future results. Financial projections are subject to market conditions and various risk factors.
Stock valuation analysis is the process of estimating what a company is worth by examining its earnings, growth prospects, and the multiple the market assigns to those earnings. It matters because paying the wrong price, even for a high-quality business, can produce poor returns.
A scenario framework specifies three variables for each case: a revenue growth rate, a net profit margin assumption, and a terminal valuation multiple. Different inputs to these three variables produce the range of outcomes, from deeply negative to strongly positive, allowing investors to test which future is already priced in.
A very high forward P/E ratio signals that the market is paying for future earnings that look very different from today's, not for current profitability. In Tesla's case, the multiple encodes probability-weighted expectations across auto earnings, FSD software optionality, and robotaxi and Optimus revenue that does not yet exist in material form.
Entry price sets the return ceiling regardless of how well the business performs. At approximately $375 per share for Tesla, the bear case produces negative returns across every modelled outcome, meaning there is no scenario in that case where the investor makes money, no matter how strong the underlying business quality is.
The five most important signals are Q2 2026 auto gross margin excluding one-time items (the 18% threshold), FSD annual recurring revenue growth above $546 million, robotaxi revenue reaching $500 million or more by 2027, California DMV permit filings for the robotaxi programme, and 2026 free cash flow relative to the negative $8.5 billion consensus estimate.


