
Active vs Passive Investing: What the Data Actually Shows
2 hrs ago

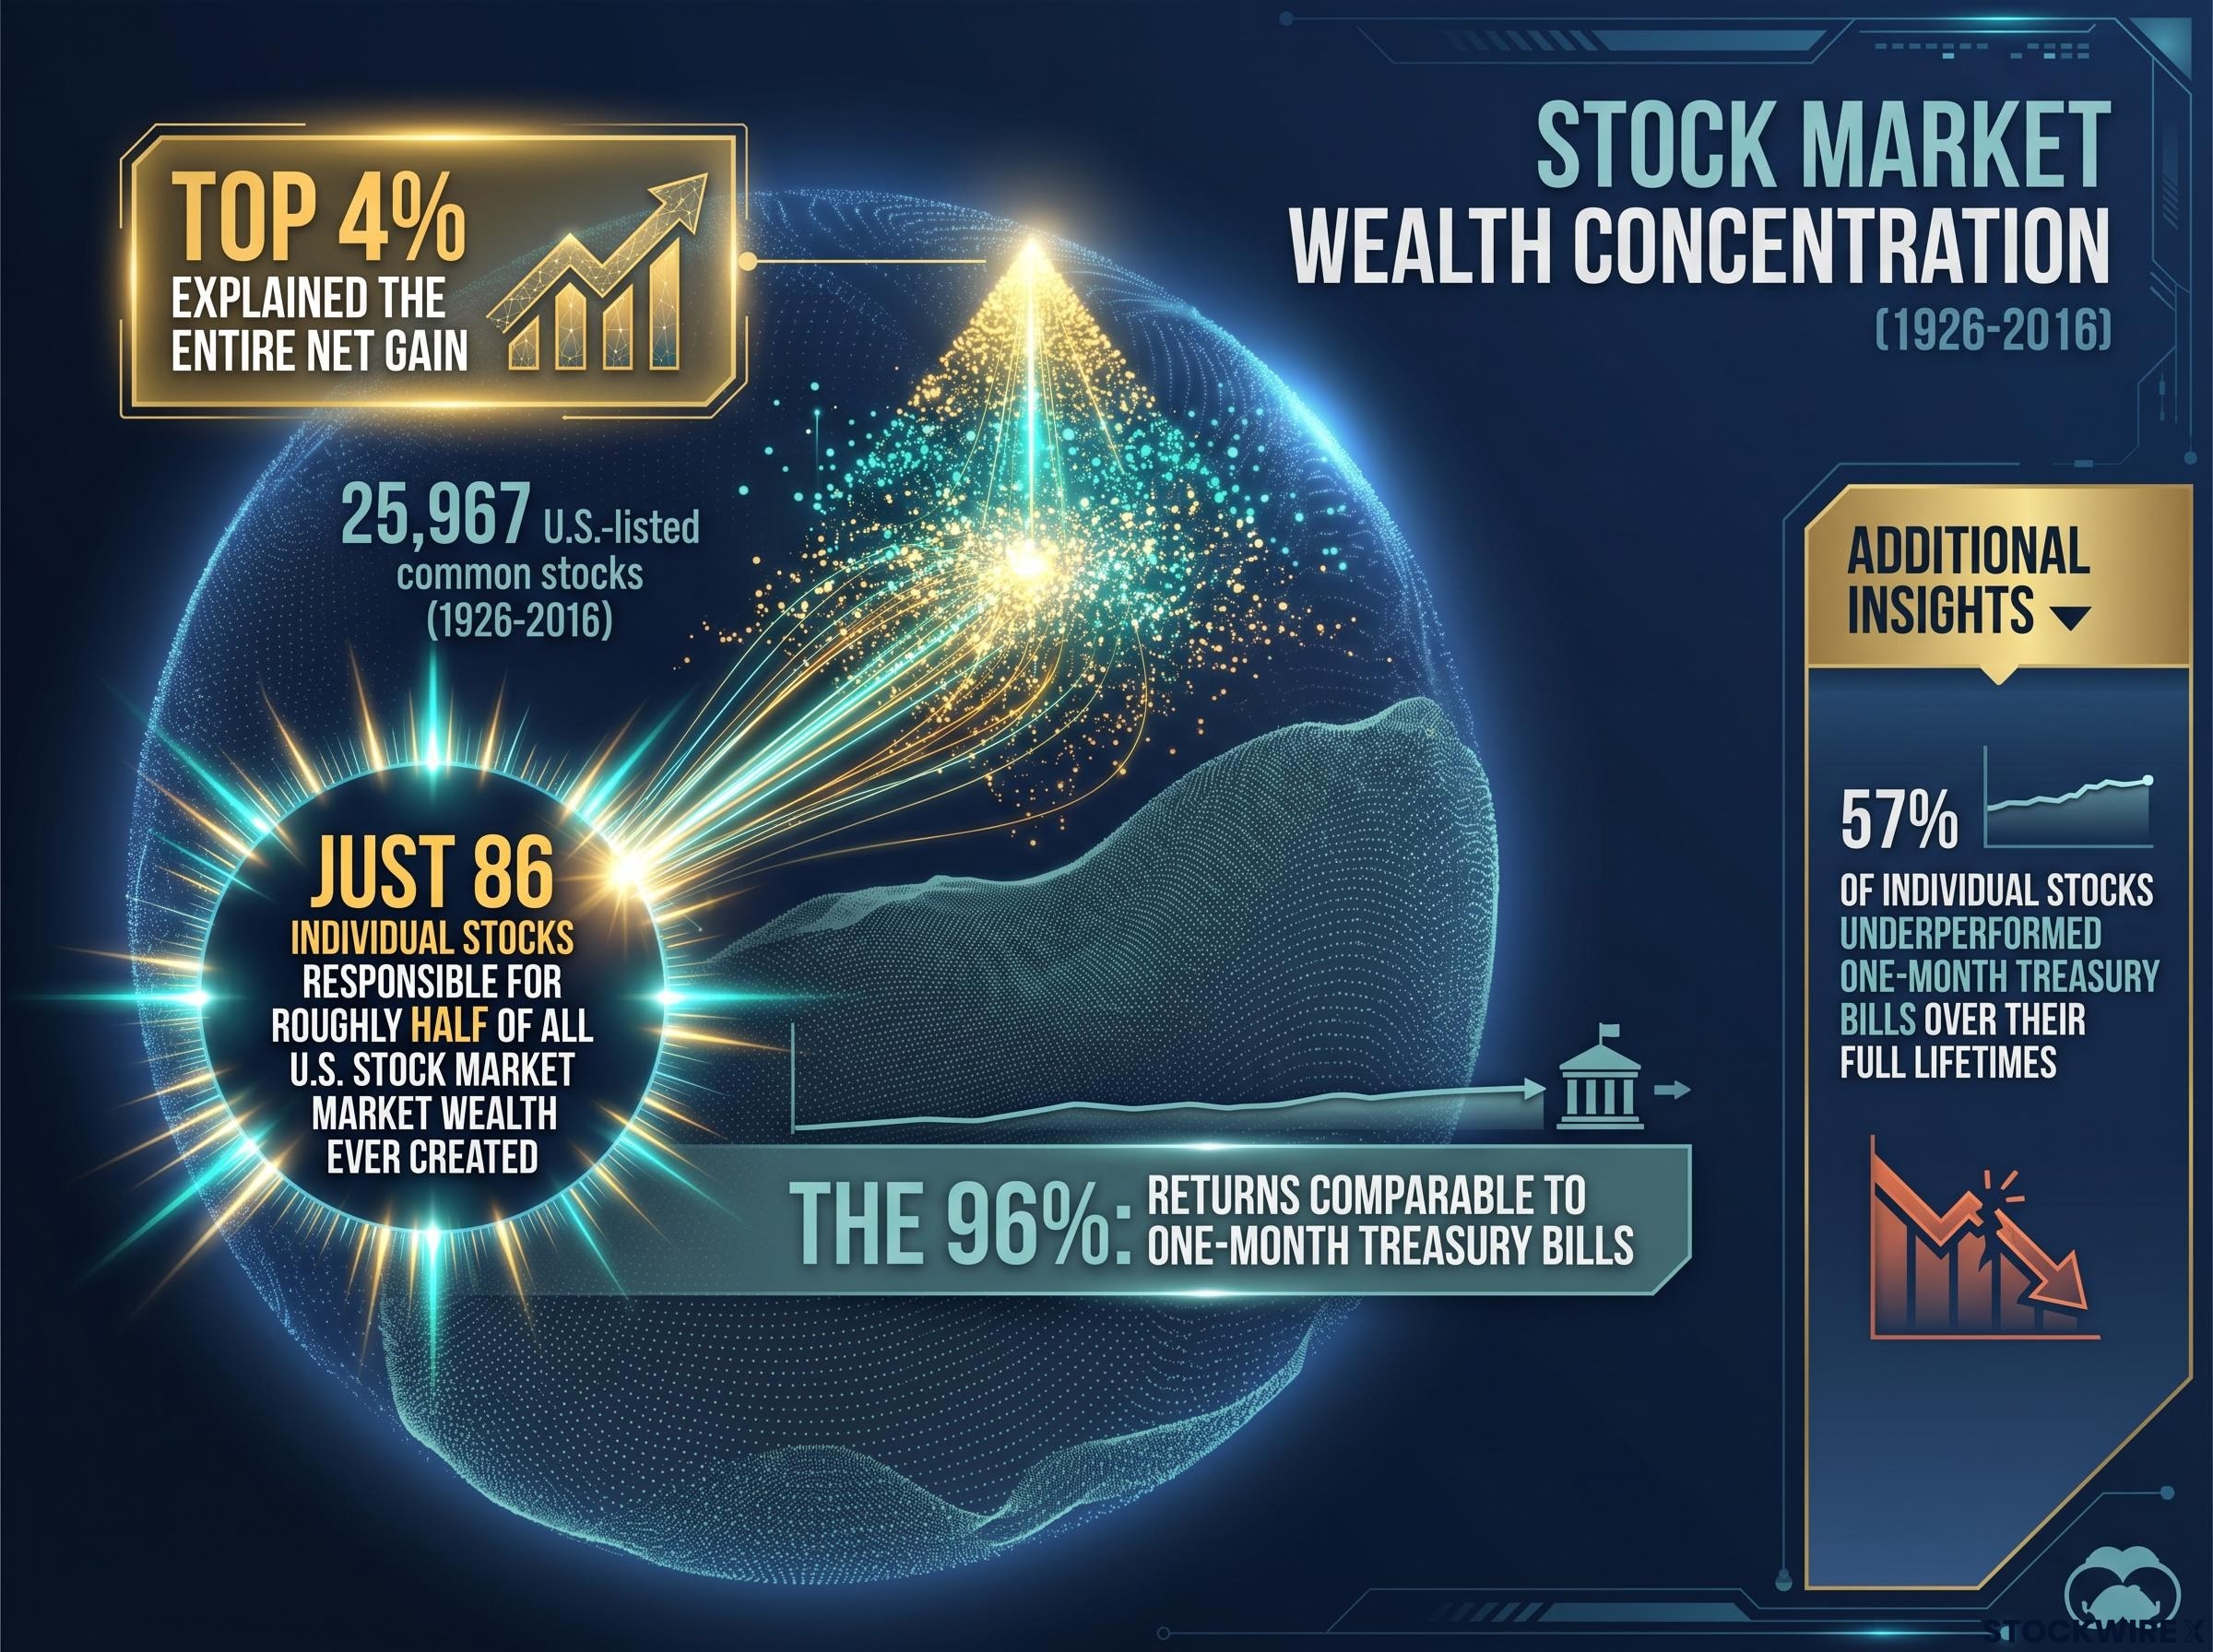
In the 90 years between 1926 and 2016, just 86 companies out of nearly 26,000 listed on U.S. exchanges were responsible for roughly half of all stock market wealth ever created. The other 25,914 produced returns, in aggregate, no better than Treasury bills. Professor Hendrik Bessembinder’s landmark research, published in 2018, provides the clearest quantitative case yet assembled for why the mathematics of individual stock picking are structurally adverse for most investors. The problem is not effort or intelligence. It is the underlying distribution of how stock returns are generated. This article unpacks the statistical logic behind Bessembinder’s findings, explains three compounding cost layers that widen the gap between active and passive investors over time, and translates all of it into a concrete dollar outcome over a 30-year horizon. By the end, readers will have a data-grounded framework for understanding what stock picking actually costs, independent of whether their individual picks have been winners or losers.
The number that reshapes the conversation is not a return figure or a fee ratio. It is a head count. Out of approximately 25,967 U.S.-listed common stocks in the CRSP database from 1926 to 2016, the best-performing 4% of companies explained the entire net gain for the U.S. stock market. The remaining 96% collectively produced returns comparable to one-month Treasury bills.
86 individual stocks, out of nearly 26,000 studied, were responsible for roughly half of all U.S. stock market wealth ever created.
The mechanism behind this is return skewness. A small number of extreme winners pull the overall market average upward, while the median stock delivers flat or negative real returns over its lifetime. The key statistics from Bessembinder’s research:
Bessembinder’s Do Stocks Outperform Treasury Bills, published in the Journal of Financial Economics in 2018, establishes the full quantitative methodology behind the 4% finding, including the CRSP database construction, lifetime return calculations, and the wealth-equivalent comparison framework that underpins the statistics cited throughout this article.
This pattern is not a historical accident. It reflects how innovation and economic growth actually work: transformative value concentrates in a tiny number of companies. The distribution is a structural feature of equity markets, not a streak of bad luck for the other 96%.
The U.S. findings might have been dismissable as a single-country anomaly. They are not. Bessembinder’s extended research identified the same return-concentration pattern in 55 out of 57 international equity markets examined. In the researcher’s own words, the concentration is, if anything, stronger outside the United States.
An extended global sample covering approximately 64,000 stocks from 1991 to 2020 confirmed the pattern across both developed and emerging markets. The global numbers carry the same structural message as the U.S. data, with modestly different magnitudes attributable to the shorter and more recent sample period:
The 4% figure from the U.S. long-run sample and the 2.4% figure from the global sample differ in magnitude but convey the same conclusion: a tiny minority of companies creates all net market wealth, everywhere. For investors constructing portfolios with global exposure, the challenge of identifying those rare extreme winners in advance is universal, not confined to any single exchange or economy.
The power law return distribution documented in Bessembinder’s research has been further confirmed by extended data running through 2022, with the top 3.4% of listed U.S. stocks accounting for all net equity wealth creation and AI-era platform companies now accelerating the same concentration forces through near-zero marginal costs and data-network feedback loops.
The structural advantage of a broad index fund is not that it picks better companies. It is that it does not need to pick at all. A broad market index automatically holds every publicly listed company from the time of listing, which means it captures whichever firms turn out to be the extreme winners without requiring the investor to identify them in advance.
A stock picker attempting to replicate that outcome faces a sequential challenge that compounds at every stage:
A single-stock buy-and-hold strategy beats the overall market only about 4% of the time over long horizons, according to Bessembinder’s research.
The asymmetry at the heart of this problem is what makes it so difficult. Missing even a small number of the extreme winners has a disproportionately large negative effect on long-run outcomes, because those few stocks carry most of the market’s total return. A randomly constructed portfolio of even 100 stocks has a high probability of missing most of the 86 biggest lifetime contributors. The index does not face this problem. It holds all of them, automatically, from day one.
The structural disadvantage of concentrated stock picking does not show up as a single line item on a brokerage statement. It accumulates through three distinct drag layers, each compounding on the others over time.
Note: The percentage figures below are illustrative modelling assumptions consistent with the broader academic and practitioner literature. They are not direct findings from Bessembinder’s research.
| Drag Type | Mechanism | Annual Cost Estimate (Illustrative) |
|---|---|---|
| Concentration/selection drag | A concentrated portfolio has a low probability of holding enough extreme winners to match the broad market, due to the skewed return distribution Bessembinder documented. | ~2.25 percentage points |
| Tax drag | Active portfolios typically turn over 15-30% of holdings annually, generating taxable events. Broad index ETFs turn over roughly 2-4%, deferring most tax obligations until the investor sells. | ~0.70 percentage points |
| Behavioural drag | Individual stock portfolios present more frequent and emotionally charged decision points, expanding the surface area for costly timing errors, premature selling, and loss retention. | ~1.50 percentage points |
The concentration drag of approximately 2.25 percentage points per year sits within the commonly documented 1-3 percentage point annual underperformance range for active strategies. The tax drag reflects the permanent removal of capital from the compounding process each time a gain is realised in a taxable account. The behavioural drag draws on a broad body of behavioural-finance research estimating that common errors cost individual stock pickers approximately 2-4% per year relative to a buy-and-hold approach; a conservative 1.5 percentage point estimate is used here.
The tax drag figure used here is conservative relative to a broader cost picture: research on fee compounding on terminal wealth shows that a 1% annual expense ratio difference on a $100,000 portfolio can erode more than $90,000 in final wealth over 25 years, a figure that compounds on top of the concentration and behavioural drag layers already embedded in the active approach.
These three drags are not independent. They interact and compound together. A poorly timed sale (behavioural drag) triggers a taxable event (tax drag) in a portfolio that was already underweight the market’s biggest winners (concentration drag). The composite annual drag of approximately 4.45 percentage points, rounded to produce a net active return assumption of 4.5% against a 7% gross index return, captures this compounding interaction.
Two hypothetical 30-year-old investors each contribute $1,000 per month ($12,000 per year) to a taxable brokerage account. One invests in a broad index fund earning 7% annually. The other pursues an active stock-picking approach earning 4.5% annually after the three drag layers described above. Both figures are illustrative assumptions using standard future-value-of-annuity calculations.
| Year | Index Portfolio Balance | Active Portfolio Balance | Gap |
|---|---|---|---|
| After 10 years | ~$166,000 | ~$149,000 | ~$17,000 |
| After 15 years | ~$274,000 | ~$235,000 | ~$39,000 |
| After 20 years | ~$426,000 | ~$347,000 | ~$79,000 |
| After 30 years | ~$1,130,000 | ~$728,000 | ~$402,000 |
At year ten, the gap is $17,000. Noticeable, perhaps, but not alarming. A stock picker reviewing their account would see a balance of $149,000 that has grown every year. Nothing in that statement screams underperformance.
By year twenty, the gap has widened to $79,000, but the active portfolio still sits at $347,000, a sum that feels like progress. The investor’s account balance has never declined for a full calendar year in this illustration. There is no crisis, no red flag, just a slowly widening differential invisible to anyone not running the comparison.
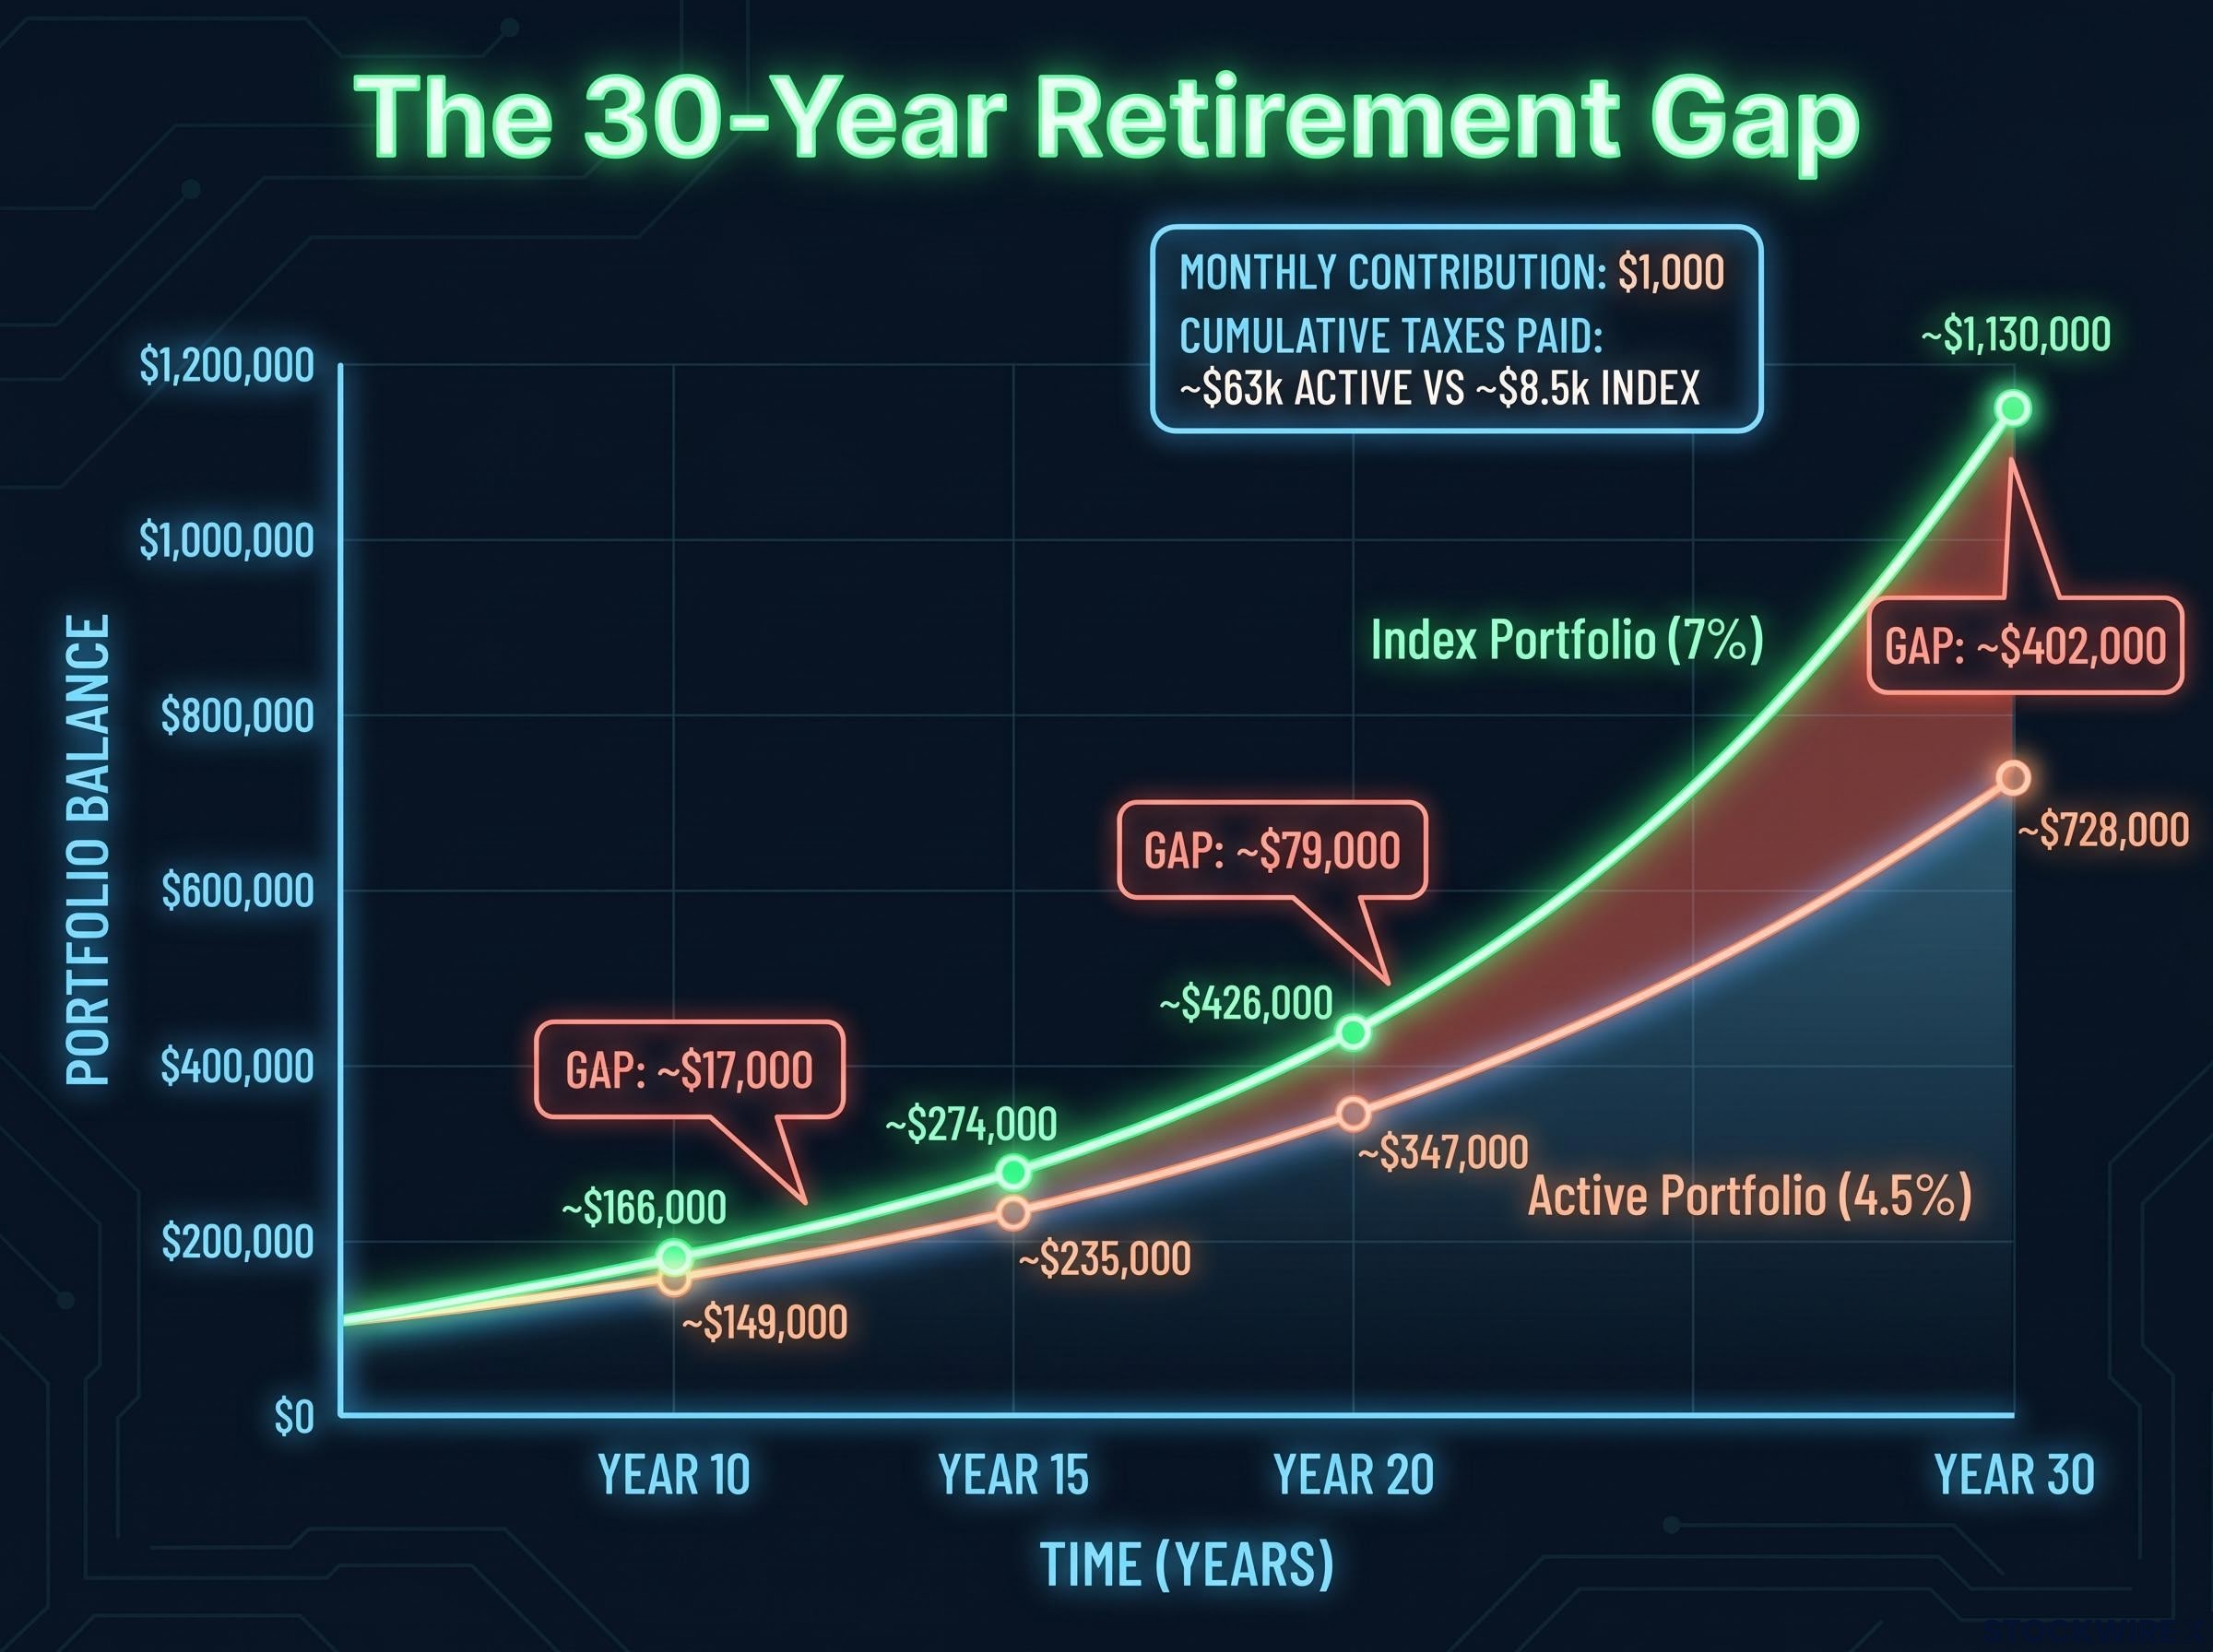
After 30 years, the gap reaches approximately $402,000: the difference between retiring with roughly $1,130,000 and retiring with roughly $728,000.
The acceleration in the final decade is where compounding does its most consequential work. The gap grew by $62,000 in the first twenty years combined, then by $323,000 in the final ten. Under illustrative assumptions, the active stock picker also pays roughly $63,000 in cumulative federal taxes on realised trading gains over the 30-year period, versus approximately $8,500 for the index investor, a differential of approximately $54,000 that further compounds the shortfall.
These projections are illustrative and subject to market conditions, contribution consistency, and tax circumstances. Past performance does not guarantee future results.
The structure of this problem is designed to hide itself from the people experiencing it. The active investor’s account balance grows in nominal terms year after year. There is no single quarter, no single statement, where the underperformance announces itself. The divergence is silent, slow, and visible only in retrospect.
Three specific behavioural mechanisms reinforce the invisibility:
Survivorship bias in active fund performance compounds the illusion further: underperforming funds that close or merge are removed from historical databases, which means the track records investors typically review already exclude the worst outcomes, making the average active manager appear more capable than the full distribution of outcomes warrants.
Bessembinder’s core finding explains why the gap is so hard to perceive in real time. Because the extreme winners are rare, a portfolio missing them does not look like a failing portfolio. It looks like a decent, unremarkable account, one that grows steadily and never triggers alarm. The compounding divergence becomes undeniable only after two decades, by which point the cost is largely irreversible.
The absence of individual stock stories can make broad market declines feel more abstract and harder to contextualise for index fund investors. Without a specific company narrative to anchor conviction during a drawdown, the psychological barrier to selling at the worst moment may be lower. This is a known risk with a known mitigation: understanding in advance that short-term drawdowns are not permanent impairments of capital for a diversified portfolio. Behavioural-finance research estimates that common errors cost the average individual stock picker approximately 2-4% per year relative to a buy-and-hold approach, but index investors are not immune to the most damaging error of all, which is selling during a panic.
The problem with concentrated stock picking is not primarily that investors choose bad companies. It is that the distribution of returns makes it nearly impossible to hold a concentrated portfolio that captures enough of the extreme winners to match a broad index over 30 years. Even a portfolio of well-researched, fundamentally sound businesses will, more often than not, miss the 86 stocks that accounted for half of all market wealth creation.
Bessembinder’s research does not claim that no investor outperforms. Some do. But the base rate, a single stock beating the market only about 4% of the time over long horizons, means the odds are stacked before a single trade is placed.
For readers who want to engage with individual stocks without abandoning the structural advantage of broad indexing, the practical framework is a core-satellite approach: the index fund captures the market’s structural return as the portfolio’s core, while a smaller allocation is reserved for individual positions the investor has genuine conviction on. Three structural takeaways ground this decision:
Core-satellite discipline addresses the behavioural drag problem at its source by giving investors a pre-committed framework that converts the impulse to act on a stock tip or market signal into a bounded evaluation process, rather than an uncontrolled disruption to the broader portfolio’s compounding trajectory.
This article is for informational purposes only and should not be considered financial advice. Investors should conduct their own research and consult with financial professionals before making investment decisions.
The $402,000 gap is not the result of bad picks, bad timing, or bad luck. It is the predictable output of a mathematical structure that has remained stable across 90 years of U.S. market history and 55 international markets. The three cost layers that produce it, concentration drag, tax drag, and behavioural drag, are not hypothetical risks. They are documented features of how concentrated active investing interacts with the skewed distribution of stock returns over long horizons.
The best time to understand this math is before the compounding has already run for two decades. The second-best time is now. Whether an investor chooses broad indexing, a core-satellite hybrid, or a fully active approach, the decision is now grounded in data rather than assumption, and in the structural logic of how wealth is actually created across public equity markets.
Past performance does not guarantee future results. Financial projections are subject to market conditions and various risk factors. The drag components and dollar projections presented in this article are illustrative modelling assumptions, not guaranteed outcomes.
Professor Hendrik Bessembinder's 2018 research found that just 4% of U.S.-listed stocks accounted for all net stock market wealth creation from 1926 to 2016, with 57% of individual stocks underperforming one-month Treasury bills over their full lifetimes, making a broad index fund structurally advantageous for most investors.
Under illustrative assumptions using a $1,000 monthly contribution, an index investor earning 7% annually accumulates approximately $1,130,000 after 30 years, while an active stock picker earning 4.5% after drag layers accumulates roughly $728,000, a gap of approximately $402,000.
The three compounding drag layers are concentration drag (approximately 2.25 percentage points annually, from the low probability of holding enough extreme winners), tax drag (approximately 0.70 percentage points, from frequent taxable trading events), and behavioural drag (approximately 1.50 percentage points, from timing errors and premature selling).
Return skewness means that a small number of extreme winner stocks pull the overall market average upward while the median stock delivers flat or negative real returns; this structural feature makes it nearly impossible for a concentrated portfolio to capture enough of the rare winners to match a broad index over long horizons.
Yes, Bessembinder's extended global research covering approximately 64,000 stocks from 1991 to 2020 found the same wealth concentration pattern in 55 out of 57 international equity markets, with the top 2.4% of firms globally accounting for all net stock market wealth creation totalling approximately $75.7 trillion.