
Why Most Wealth-Building Strategies Aren’t Built for You
5 hrs ago

Approximately 96 out of every 100 stocks listed on U.S. public markets have contributed nothing, net, to wealth creation over their lifetime. All the gains belong to the remaining 4%, or fewer.
This is not a market anomaly or a product of recent technology-driven concentration. It is a structural feature of equity markets that has persisted across nearly a century of data, confirmed by peer-reviewed research and reinforced by institutional analysis published as recently as 2024. The implications for how Australian investors think about portfolio construction, the cost of sitting on the sidelines, and the decisions that define long-term financial outcomes are profound.
What follows explains the mechanics behind power law investing: what the empirical evidence actually shows, why markets are structurally skewed toward extreme concentration, how landmark historical examples illustrate the principle at human scale, and what this means for Australian investors navigating an AI-accelerated market in 2026.
The empirical foundation for this discussion rests on a single, continuously updated body of research. Hendrik Bessembinder’s work on wealth creation in U.S. public stock markets, most recently covering the period 1926-2022 (SSRN abstract_id=4448099), found that approximately 3.4-4% of listed stocks generated all net wealth creation relative to Treasury bills across the entire sample period.
Approximately 3.4-4% of listed U.S. stocks generated all net equity wealth creation across nearly a century of market history. The remaining 96%+ collectively failed to outperform short-term government bonds over their full listing lives.
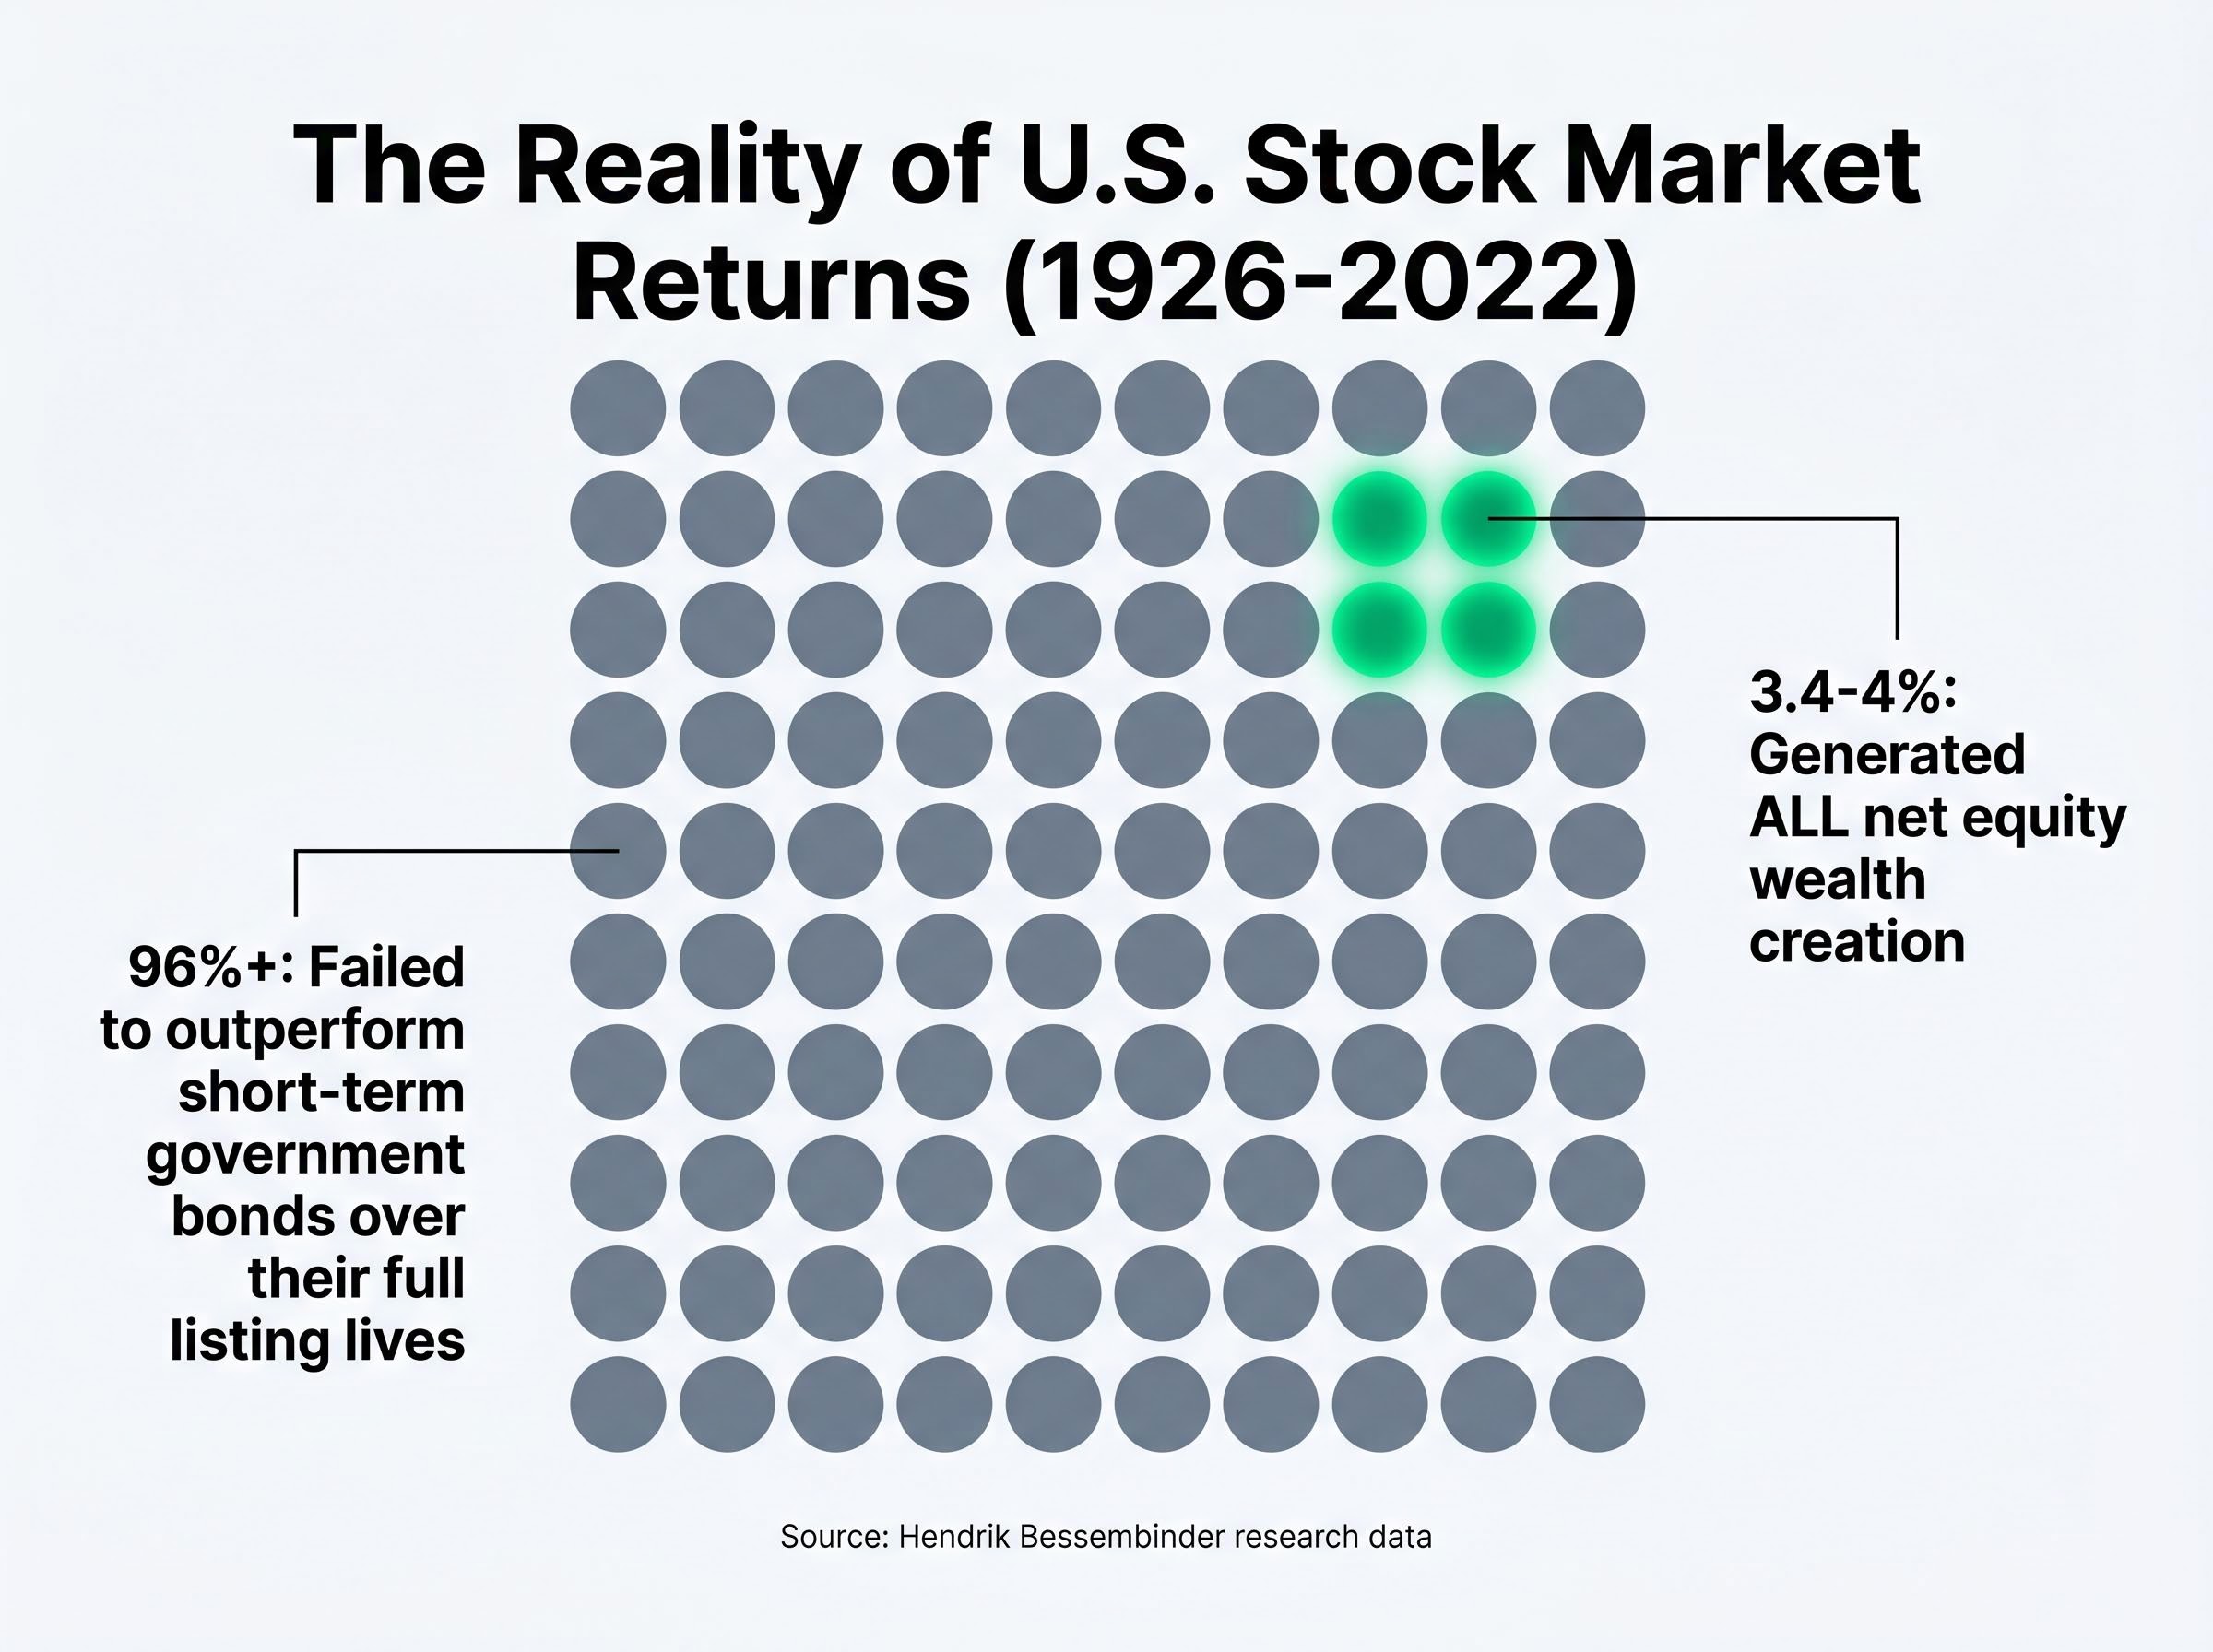
The majority of individual stocks, measured over their complete lifetimes as public companies, actually underperformed short-term government bonds. This is not a statement about short-term volatility. It is a statement about the permanent distribution of returns across all publicly traded equities.
Complementary institutional research published in 2024 confirms that the same dynamic is accelerating in the current market environment:
Understanding the statistical baseline is the prerequisite for every decision that follows. Without grasping just how extreme the concentration is, the practical implications for portfolio construction and conviction sizing cannot land properly.
Most people intuitively assume investment returns follow something resembling a normal distribution, where most stocks cluster around an average and extreme outcomes are rare in both directions. The actual distribution of lifetime stock returns looks nothing like this. It follows a power law: most individual stocks deliver returns near zero (or negative), and a tiny number generate returns so large they account for virtually all net wealth creation.
A useful way to grasp the difference is the distinction between human height and human net worth. Height is normally distributed; most adults are within a narrow range of the average, and no one is ten times taller than anyone else. Net worth follows a power law; a small number of individuals hold wealth that is thousands or millions of times greater than the median. Stock market returns behave like net worth, not like height.
Three structural features of equity ownership produce power-law outcomes. These are not new to the AI era, though they are intensified by it.
These drivers explain why passive index investors participate in power-law winners automatically (the winners grow into larger index weights), while active stock-pickers who spread capital equally across many positions can inadvertently exclude or underweight the very stocks responsible for all the returns.
The statistical principle becomes more tangible through specific historical examples, each operating at a different scale.
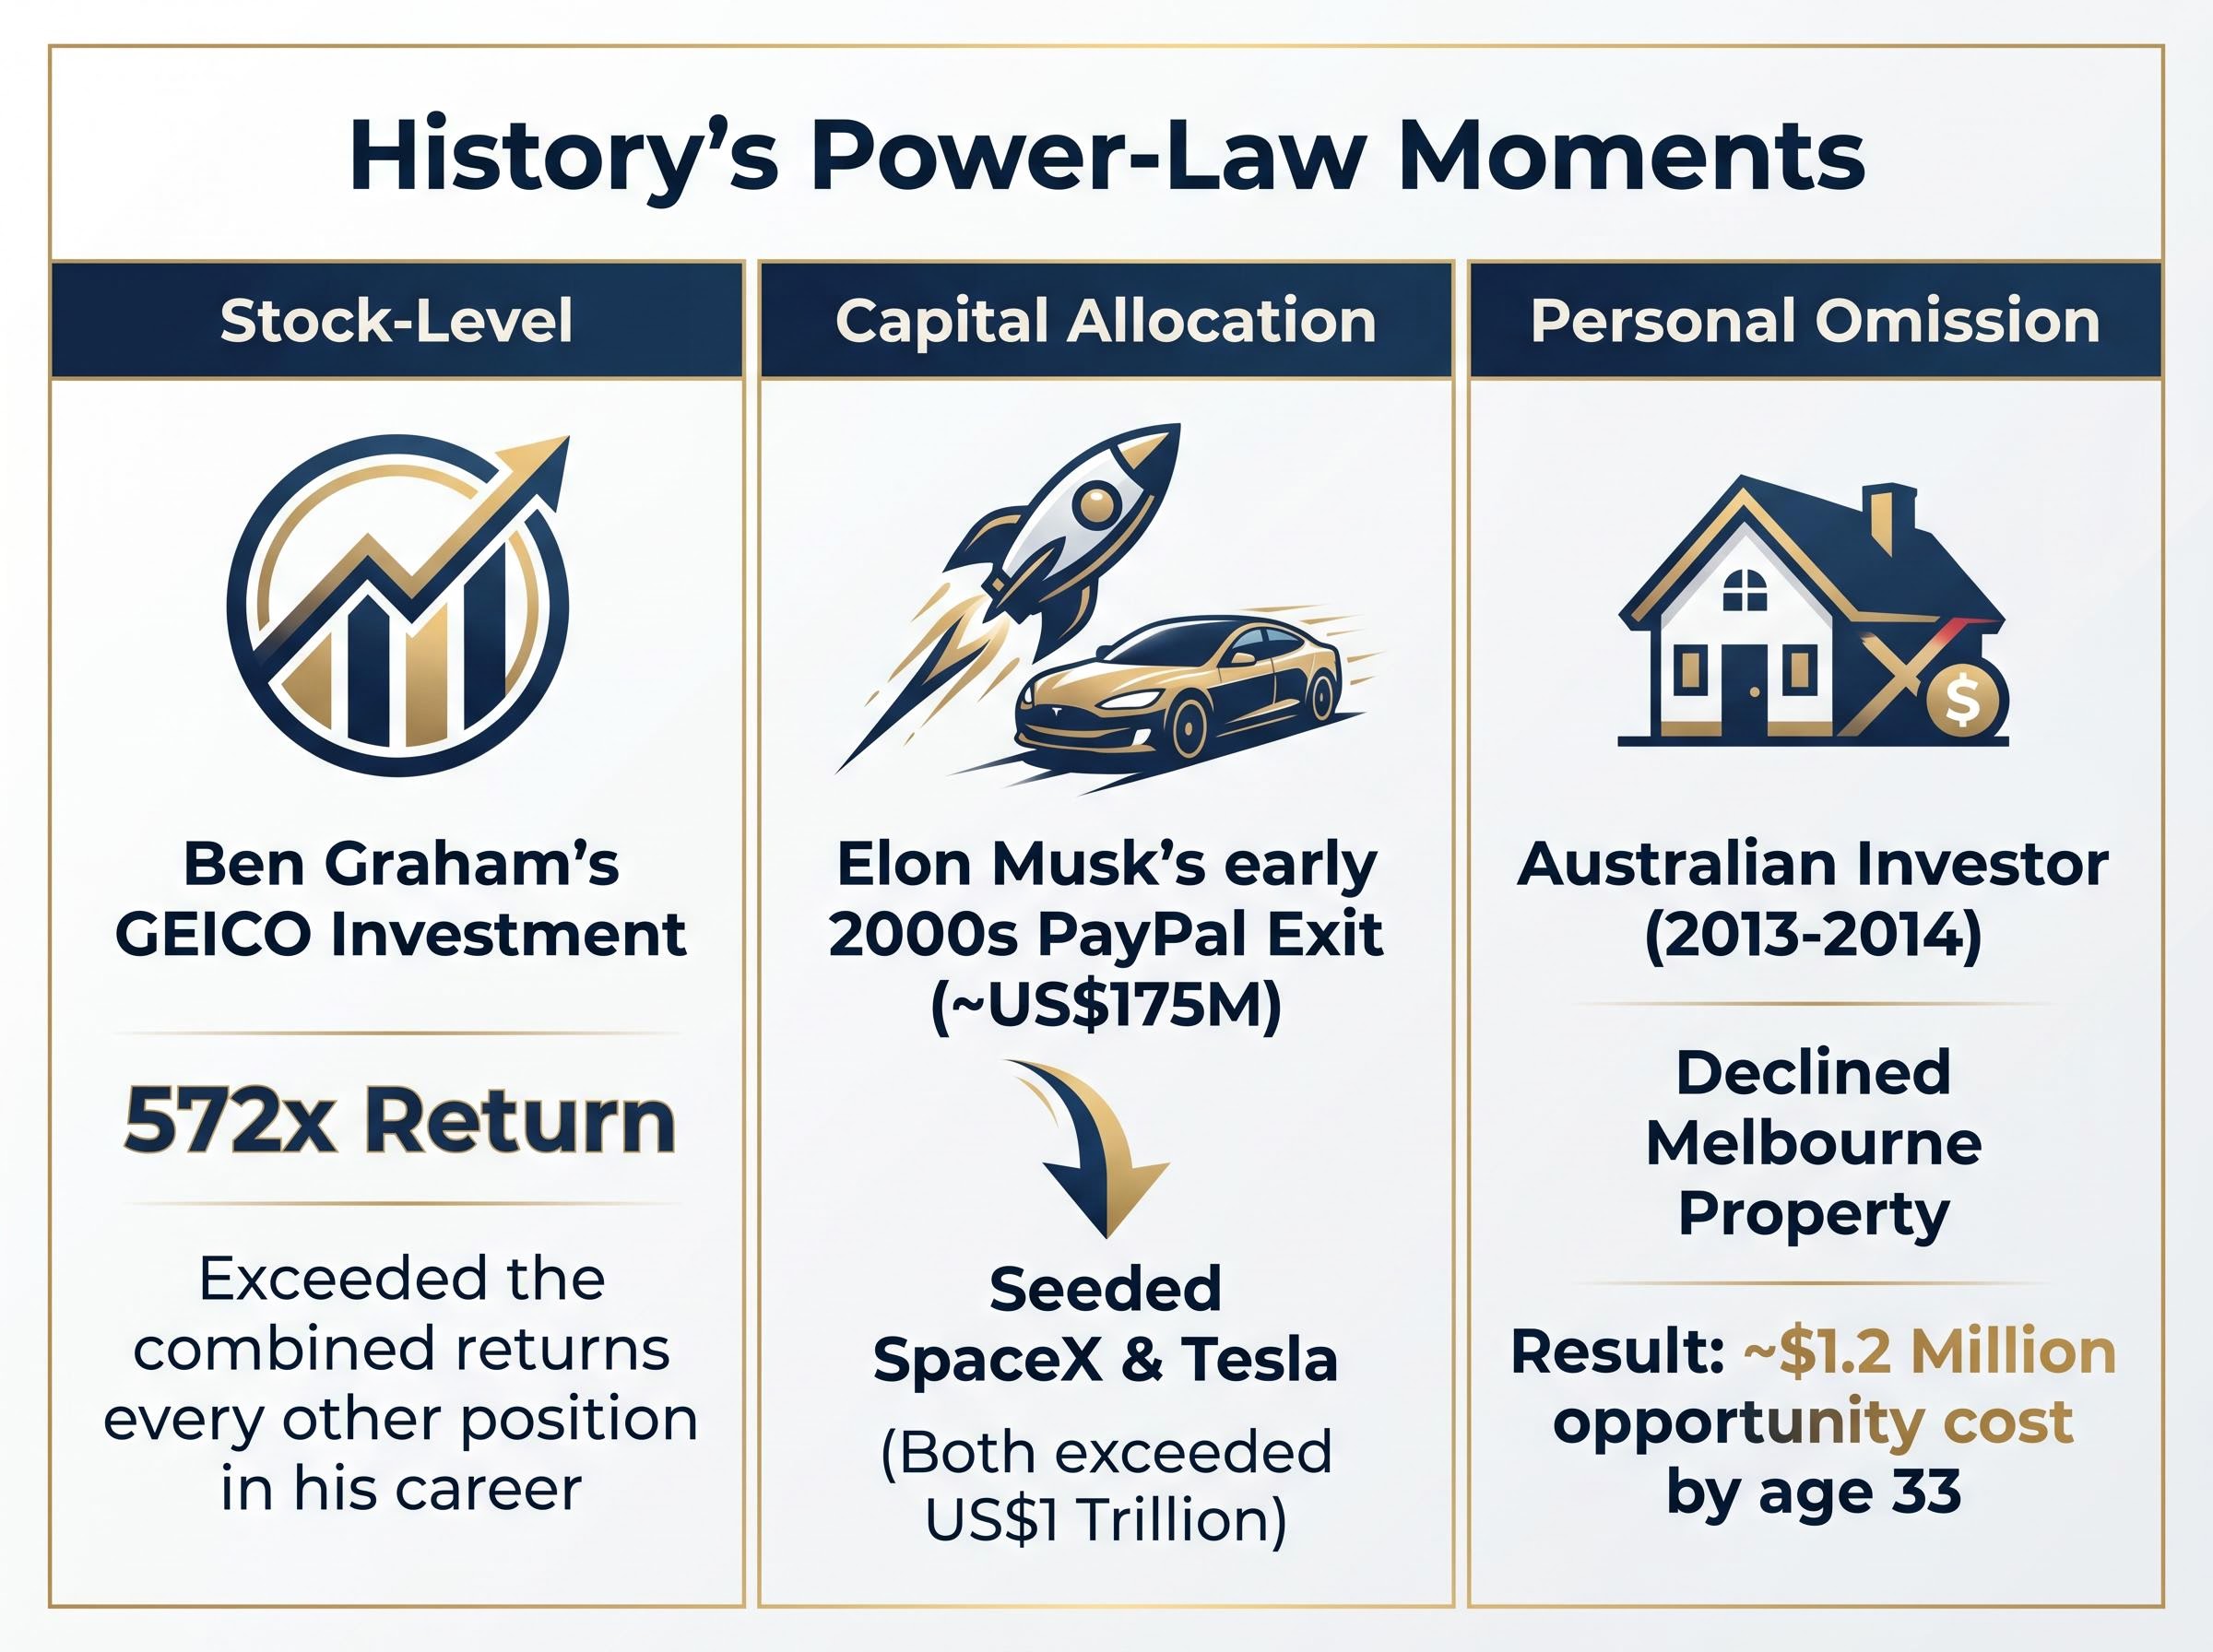
Ben Graham’s single investment in GEICO returned 572 times his invested capital, exceeding the combined returns of every other position in his career.
Graham, widely regarded as the founder of value investing, built a career analysing hundreds of companies. Yet one position, GEICO, generated more wealth than everything else combined. The lesson is not that Graham was lucky. It is that the power-law distribution meant that even a disciplined, diversified career could be defined by a single holding.
Elon Musk’s exit from PayPal in the early 2000s yielded approximately US$175 million. That single liquidity event seeded two companies, SpaceX and Tesla, each of which subsequently reached valuations exceeding US$1 trillion. The power-law benefit did not come from the original exit; it came from recognising the next level of the distribution and concentrating capital there.
At a more personal scale, an Australian investor’s decision not to purchase a Melbourne property in 2013-2014 carried an estimated opportunity cost of $1.2 million by age 33. The decision was not a disaster in the conventional sense; it was simply the absence of action on a single high-quality opportunity. Power laws punish omission as severely as they reward conviction.
| Decision/Event | Type of Power Law Moment | Outcome | Key Lesson |
|---|---|---|---|
| Graham’s GEICO investment | Stock-level concentration | 572x return; exceeded all other career gains | One position can define an entire investment career |
| Musk’s PayPal exit (~US$175M) | Decision-level capital allocation | Seeded SpaceX and Tesla (both exceeded US$1 trillion) | Recognising the next distribution level matters more than the initial exit |
| Melbourne property (2013-2014) | Personal omission | ~$1.2 million estimated opportunity cost by age 33 | Inaction on a high-quality opportunity carries compounding cost |
Power-law concentration in equity markets predates artificial intelligence by decades. Bessembinder’s data covers 1926-2022, a period in which the structural drivers of concentration, compounding, network effects, and asymmetric upside, operated without any contribution from AI. The current AI cycle is not creating a new phenomenon. It is accelerating an existing one.
Three properties specific to AI as a technology explain why the acceleration is so pronounced:
OpenAI’s annualised revenue run-rate grew from approximately US$1.6 billion in late 2023 to approximately US$20-25 billion by early 2026, according to Reuters reporting on an OpenAI CFO statement from January 2026.
Anthropic, the second-largest standalone AI company, grew from effectively zero revenue before March 2023 to an annualised run-rate of approximately US$9 billion by early 2026. These trajectories illustrate power-law winner dynamics operating within the AI sector itself.
Platinum Asset Management warned in 2024 that Australian investors using passive global ETFs carry substantial implicit concentration in the “Magnificent Seven” U.S. mega-cap technology stocks. Research from the BlackRock Investment Institute (2024) reached a similar conclusion, noting that structural mega-forces, including AI, are driving increased concentration in a small group of companies capturing outsize value.
This does not mean concentration is inherently beneficial. AQR Capital Management (2024) cautioned that over-concentration in glamour stocks increases risk and that diversified factor investing helps investors avoid reliance on picking the tiny set of winners. The tension between recognising power-law dynamics and managing concentration risk is real, and it is particularly acute for Australian investors whose regulatory environment emphasises diversification.
ASIC and its MoneySmart consumer education platform consistently emphasise diversification as a core investment principle and explicitly warn against putting all capital into a small number of positions. This guidance is appropriate for the broad retail investor population, particularly those with limited time, sector-specific expertise, or capacity to absorb concentrated losses.
Understanding power-law dynamics does not mean abandoning diversification. It means applying it more deliberately, with awareness of what equal-weight spreading across dozens of positions actually costs in long-run expected return.
If approximately 3.4-4% of stocks generate all net wealth creation, systematically avoiding concentration means systematically avoiding the winners. Morgan Housel, writing for Collaborative Fund, has observed that many investors’ largest long-run errors are failures to hold or buy exceptional companies, rather than the more visible errors of buying poor ones.
Three considerations follow from this:
This article is for informational purposes only and should not be considered financial advice. Investors should conduct their own research and consult with financial professionals before making investment decisions.
Power laws are not a strategy to implement. They are a structural reality to understand. The data from nearly a century of U.S. market history is settled: a tiny fraction of stocks generates all net wealth creation, and the majority of individual equities underperform government bonds over their lifetimes.
What changes when investors absorb this evidence is not their portfolio mechanics but their attention. The scarce resource is not capital or access. It is the willingness to recognise exceptional quality early, and to act on that recognition when the consensus has not yet arrived.
The question for Australian investors in 2026 is not whether power laws exist. The evidence is settled. The question is whether individual investors are positioned, psychologically and practically, to benefit from them.
Graham’s GEICO return was available to anyone willing to do the analytical work and hold the conviction. Musk’s PayPal exit mattered not because of the cash it generated but because of the next-level distribution it funded. The investors and founders who recognised the scale of AI’s structural shift 12-18 months before consensus arrived are the ones positioned for the next phase of concentration.
The distribution does not change. The only variable is recognition, and the willingness to act on it.
Power law investing refers to the principle that a tiny fraction of stocks (roughly 3.4-4% historically) generate virtually all net wealth creation in equity markets, while the vast majority of individual stocks underperform government bonds over their lifetimes. Understanding this distribution helps investors think more deliberately about portfolio construction and conviction sizing.
According to Hendrik Bessembinder's peer-reviewed research covering 1926-2022, approximately 3.4-4% of listed U.S. stocks generated all net equity wealth creation relative to Treasury bills. The remaining 96% or more collectively failed to outperform short-term government bonds over their full listing lives.
AI accelerates existing power-law concentration forces through near-zero marginal distribution costs, rapid user adoption, and data-network compounding advantages that entrench market leaders. Institutional research from BlackRock and Platinum Asset Management warns that Australian investors using passive global ETFs already carry substantial implicit concentration in a small group of AI-era mega-cap companies.
Australian investors should size positions proportionally to conviction rather than spreading capital equally across many holdings, since equal-weight diversification systematically dilutes exposure to the rare stocks that drive all long-run returns. ASIC still recommends diversification for most retail investors, so the key is applying diversification deliberately rather than reflexively.
Because returns follow a power law rather than a normal distribution, missing one exceptional position can have a compounding cost that dwarfs the impact of many ordinary bad picks. The article illustrates this with Ben Graham's GEICO investment, which returned 572 times his capital and exceeded the combined returns of every other position in his career.


