The 30-year Treasury yield hit a 24-year high in the trading episode of 7-8 October 2026, reaching around 5.67% according to Reuters. By the close on 29 October, it had eased to 5.32%. That dip makes the moment easy to miss, but rising Treasury yields at these levels are new ground for many investors who have never held assets through rates this high.
Long-term yields now affect several things you care about. They influence mortgage costs, stock valuations, the federal interest bill and the price of every bond you own.
Policy has not settled the question. On 28 October, the Federal Reserve held its target range at 3.75%-4.00%, and two officials voted for a hike.
This explainer works through four questions. Which rates actually matter? What could yields of 6% to 8% do to each asset class? How real is the debt-spiral risk? And how can you position a portfolio without needing a rate forecast?
Which interest rates actually matter, and why the 10-year gets the attention
You hear a long list of rate names every day: fed funds, effective rate, prime, mortgage, 3-month, 10-year and 30-year. They are easier to follow once you sort them into two groups. The first group sets the cost of consumer credit. The second group consists of market benchmarks.
Policy and consumer rates
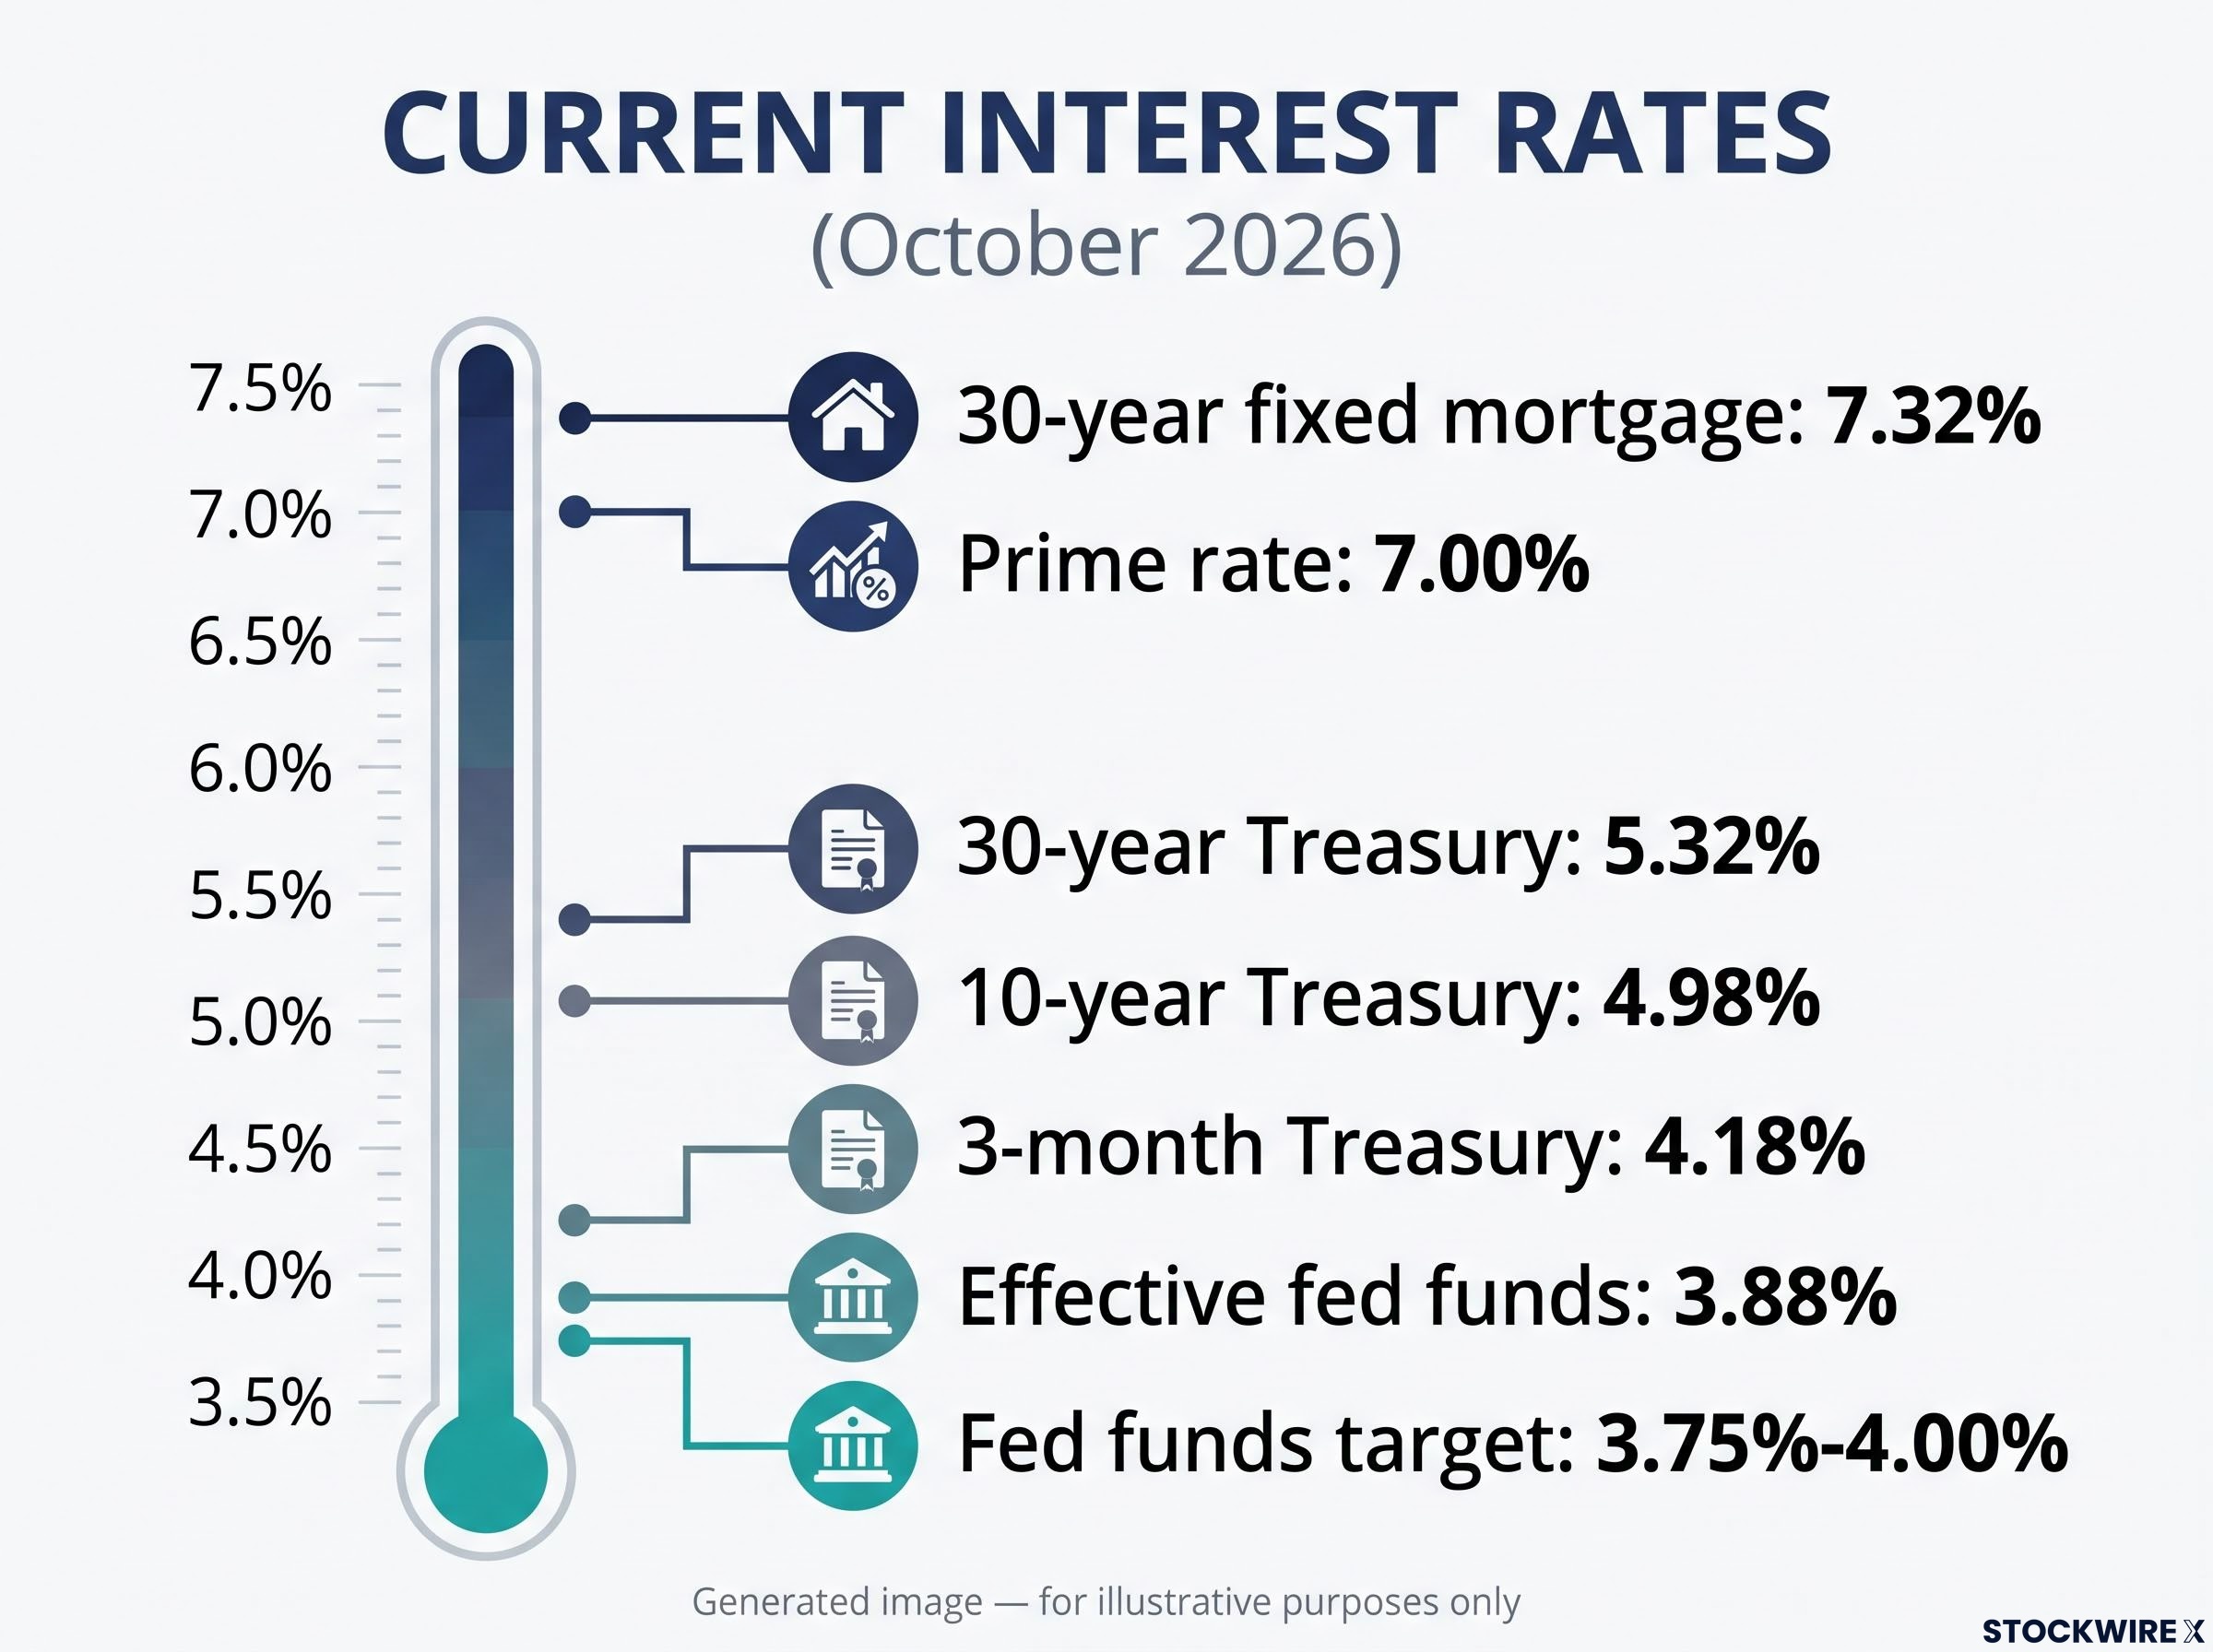
The fed funds target is the range the Fed sets for overnight lending between banks. The effective rate is the rate banks actually charge each other, at about 3.88%. The prime rate is what banks charge their strongest borrowers. It sits at 7.00%, about 3 points above the top of the target range, and it feeds into credit cards, auto loans and home equity lines of credit (HELOCs).
Mortgages work differently. The 30-year fixed mortgage rate tracks the 10-year Treasury yield plus a mortgage spread, not the fed funds rate. That link explains why mortgage rates stayed above 7% while the Fed held steady.
Treasury benchmarks
Treasuries are backed by the full faith and credit of the US government, so markets treat their yields as the risk-free benchmark. The 10-year sits between the 2-year, which reflects near-term policy expectations, and the 30-year, which reflects long-run concerns. It is also among the most liquid securities in the world.
Most borrowers refinance or move within 7-10 years, which is why mortgage rates follow the 10-year. The 10-year also feeds corporate borrowing costs and stock valuation models such as the capital asset pricing model (CAPM). CAPM is a formula that estimates the return investors should demand from a stock.
| Rate | Latest figure | What it influences | Date/source |
|---|---|---|---|
| Fed funds target | 3.75%-4.00% | Overnight bank lending | FOMC, 28 October 2026 |
| Effective fed funds | About 3.88% | Actual overnight rate | Original source |
| Prime rate | 7.00% | Credit cards, auto loans, HELOCs | WSJ, 29 October 2026 |
| 30-year fixed mortgage | 7.32% | Home loans | Freddie Mac PMMS, week to 22 October |
| 3-month Treasury | 4.18% | Cash and short-term savings | Treasury, 29 October 2026 |
| 10-year Treasury | 4.98% | Mortgages, corporate credit, valuations | Treasury, 29 October 2026 |
| 30-year Treasury | 5.32% | Long-term borrowing costs | Treasury, 29 October 2026 |
The original source cited a mortgage rate of about 7.24%. The gap with the Freddie Mac figure likely reflects timing or survey differences. Over the past 50 years, the 10-year and 30-year yields have stayed within roughly 100 basis points of each other. A basis point is one-hundredth of a percentage point.
The practical lesson is that Fed decision days matter less to your mortgage and portfolio than the 10-year yield. That is the number to watch.
Evidence from recent REIT returns supports that point: valuations have tracked the 10-year Treasury yield more closely than the federal funds rate, so 100 basis points of easing delivered only muted gains.
When big ASX news breaks, our subscribers know first
What is pushing long-term yields up, and how close is the debt-spiral risk?
Why long-term yields are climbing
Several forces are pushing in the same direction:
- Term premium: This is the extra return investors demand for holding long bonds when inflation and policy are uncertain. The Congressional Budget Office (CBO) expects it to keep rising.
- Deficits and supply: CBO projects debt held by the public will rise from about 101% of GDP in 2026 to 120% in 2036. That means more bonds for markets to absorb.
- Inflation and growth: Goldman Sachs pointed to stronger nominal growth and persistent inflation.
- AI capital demand: JPMorgan cited AI financing needs competing for the same pool of capital.
- T-bill reliance: The IMF said heavy use of short-term bills pushes gross financing needs close to 40% of GDP.
- Global repricing: Reuters described a broader global bond selloff.
How a debt spiral would work
The mechanism runs in a loop. Higher rates raise interest costs, which widen deficits. Wider deficits require more bond issuance, and more issuance pushes yields higher again.
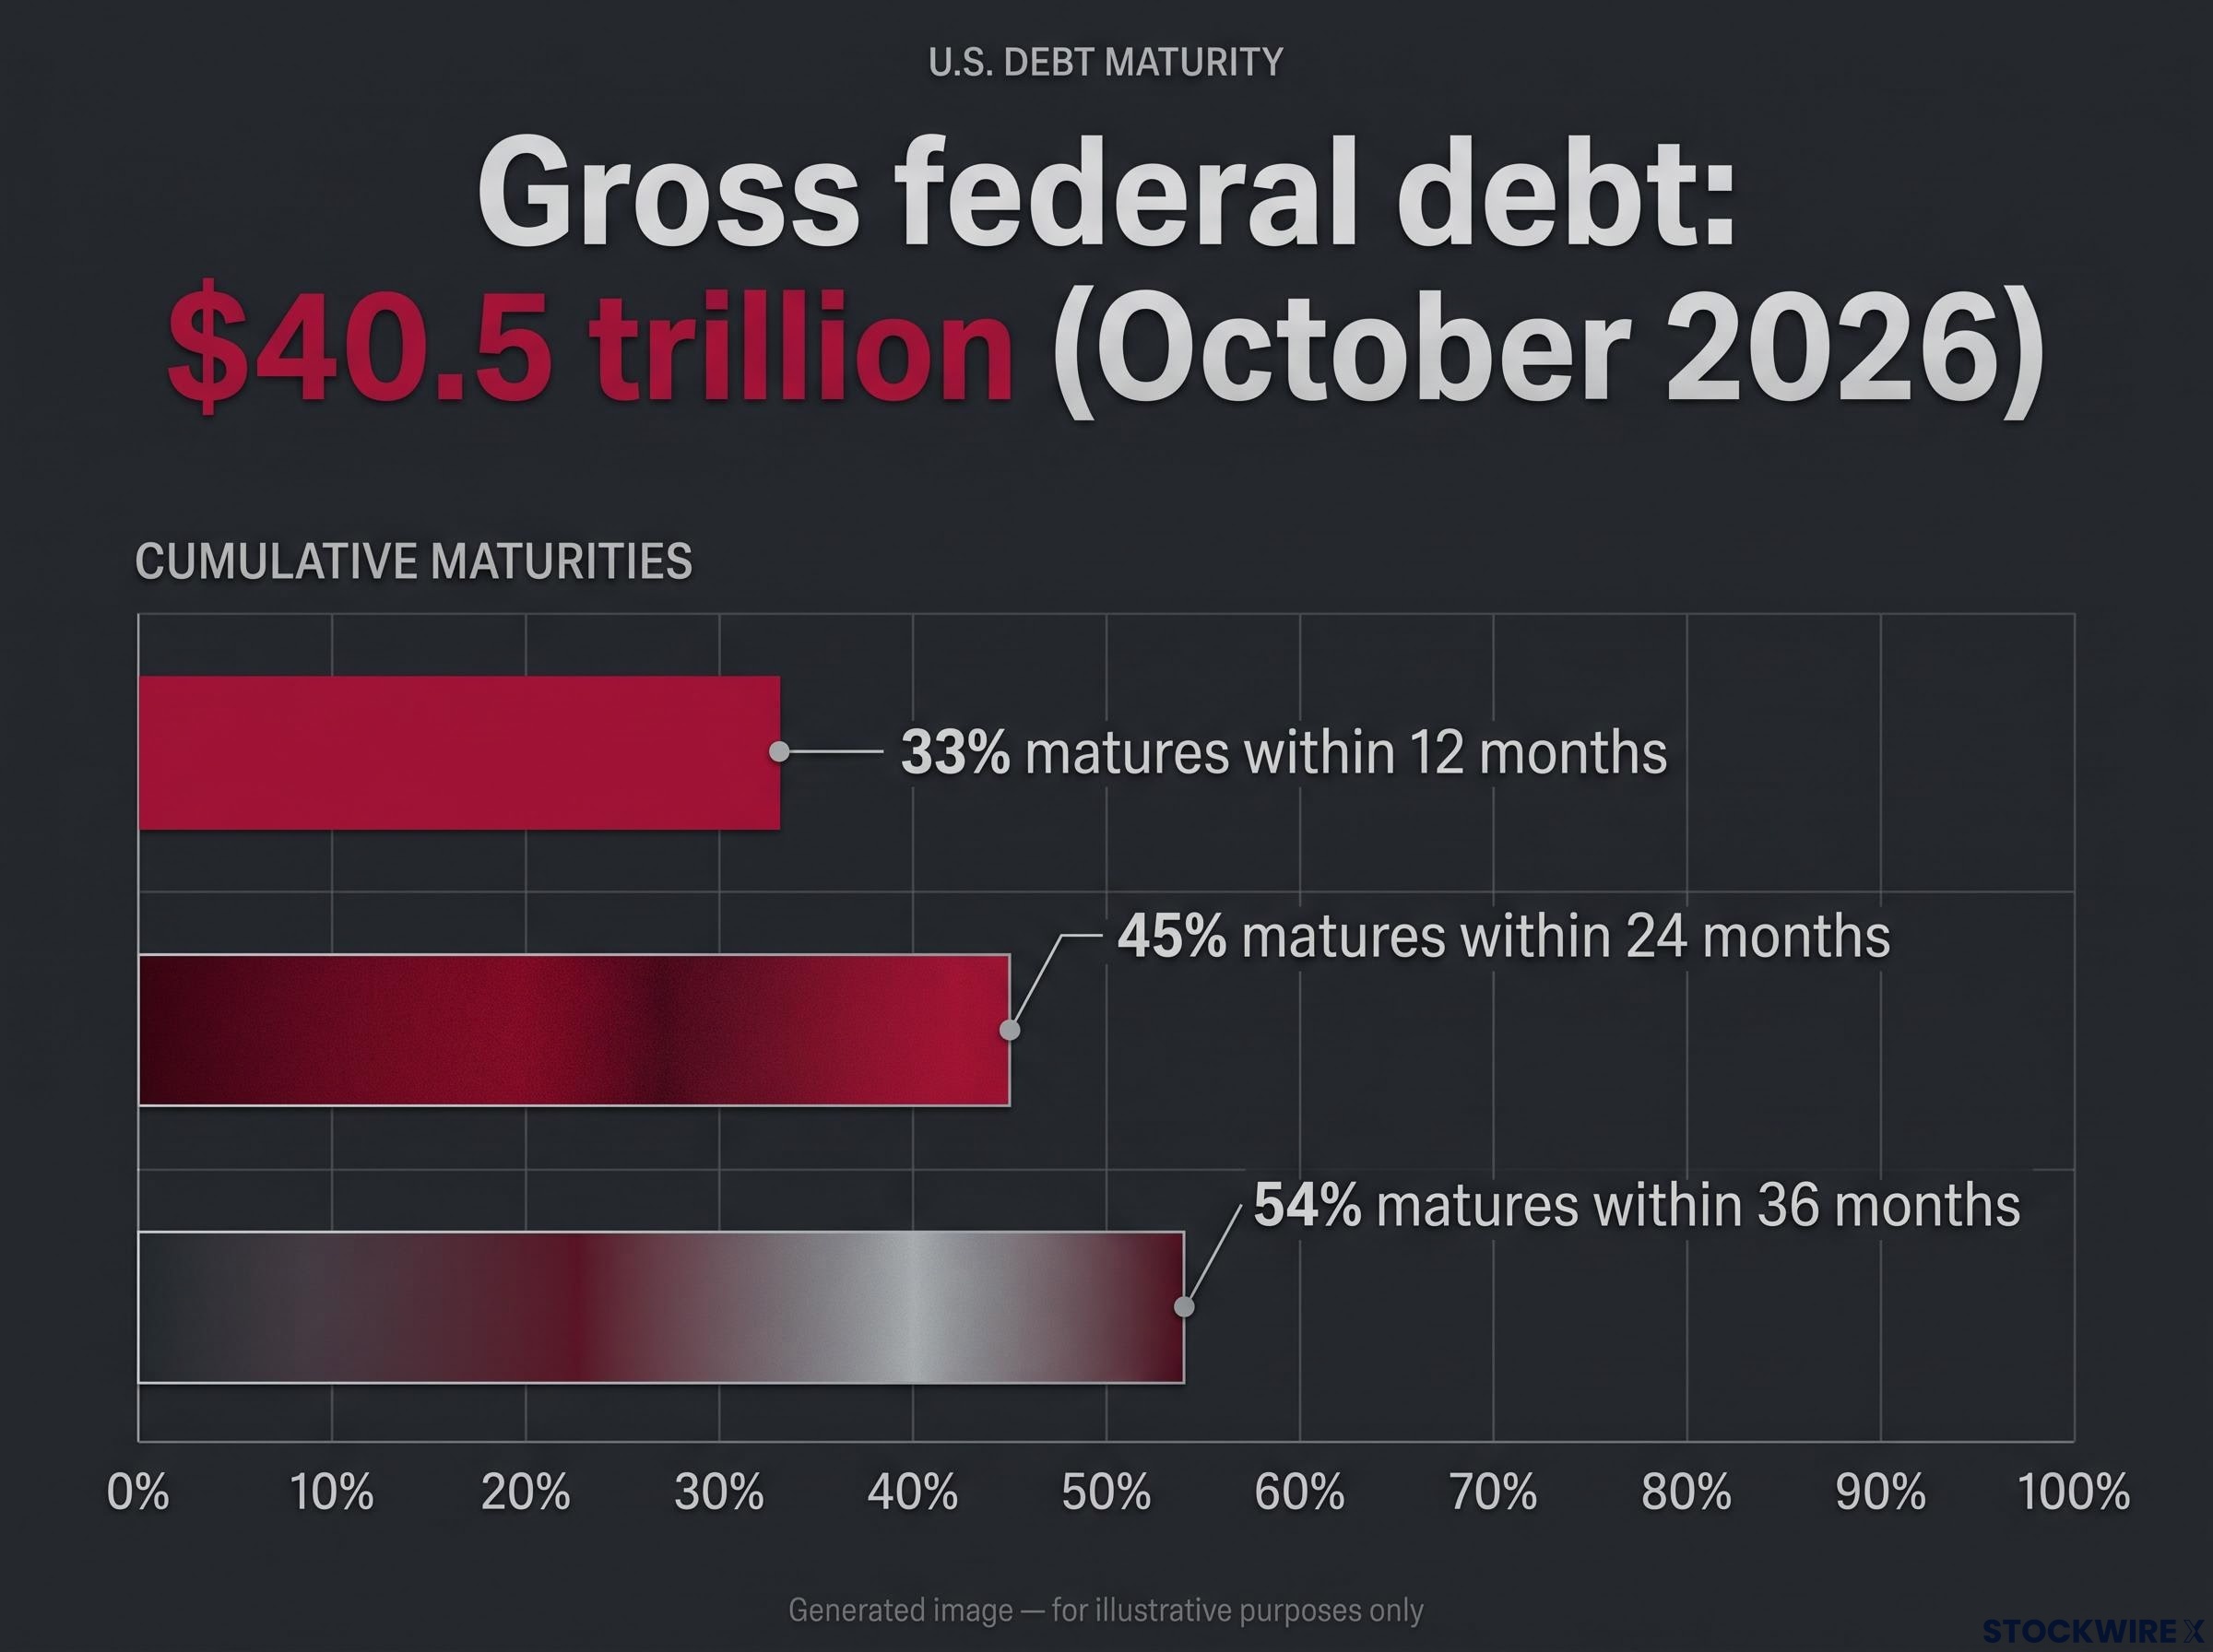
The starting numbers are large. Gross federal debt passed $40.5 trillion in October 2026. Net interest for FY2026 came to about $1.05 trillion, roughly 19% of revenue, although CBO-based estimates put it nearer $1.14 trillion. Treasury data show about 33% of marketable debt matures within 12 months, 45% within 24 and 54% within 36.
CBO’s higher-rate scenario If rates run 150 basis points above baseline, cumulative deficits for 2026-36 grow by $6.0 trillion, including $4.9 trillion of extra net interest. Debt held by the public would reach 133.1% of GDP in 2036, compared with 120.2% under the baseline.
Serious risk versus contained risk
| Case the risk is serious | Case it is contained |
|---|---|
| BofA (26 October): a 10-year yield 100 bp above baseline adds about $4 trillion of interest over a decade | The US borrows in its own currency, and Treasuries remain the principal safe asset |
| CBO baseline: net interest reaches about $2.1 trillion by 2036 | A spiral depends on the gap between interest rates and growth, not on the debt ratio alone |
| IMF: interest reaches about 5.7% of GDP by 2031 | CBO projects a steady rise, not a market seizure |
| About a third of debt rolls over within a year | Higher yields can reflect stronger growth, and Treasury can lengthen maturities |
The policy fixes are well known: lower primary deficits, slower entitlement growth, longer issuance and higher productivity. The evidence points to a country near a debt-spiral risk, not one already caught in a spiral.
For you, that means federal interest costs are a slow-building pressure that can keep long yields elevated. They are not a sudden crisis you need to time.
How yields at 6%, 7% or 8% would hit growth stocks, REITs, utilities and bonds
The discount-rate idea in plain terms
A discount rate is the return used to convert money you expect in the future into its value today. When Treasury yields rise, investors demand higher returns from everything else, so the discount rate rises too.
Here is an everyday comparison. If a safe bank account pays 8%, a promise of $100 in ten years is worth far less to you today than when the account paid 2%. You could simply put your money in the bank instead.
The scenarios below are an exercise, not a forecast. Nobody knows whether yields will go up or down from here, and these outcomes are speculative and depend on market conditions.
| Asset class | Why rates matter | Most exposed | More resilient |
|---|---|---|---|
| Growth and tech | Profits arrive far in the future, so higher discount rates shrink valuation multiples | Speculative, leveraged firms that need to raise capital | Profitable firms with strong balance sheets |
| REITs | Dividends look less attractive next to Treasuries, refinancing costs rise and cap rates climb | Highly leveraged REITs with near-term refinancing | REITs with inflation-linked rents, over time |
| Utilities | They behave like bonds, and their cost of capital rises | Heavy borrowers funding infrastructure | Utilities bought at cheap valuations |
| Existing bonds | Prices fall as yields rise | Long-duration bonds | Bonds held to maturity, and newly purchased bonds |
A cap rate is a property’s annual income divided by its value. When cap rates rise, property values fall. Duration measures how sensitive a bond’s price is to changes in rates.
Tech makes up about 30-32% of the S&P 500 and about 61% of the Nasdaq 100. A plain index fund therefore carries meaningful rate sensitivity. When you assess a company, check whether its debt is fixed-rate or variable-rate, and whether it will need to raise capital.
Morningstar noted that utilities struggled in 2023, became unusually cheap and then recovered. Bonds held to maturity still return principal and coupons, subject to credit risk, and new bonds become more appealing, especially for retirees. History offers two warnings. In 2022, both stocks and long bonds fell. In 2023, the 10-year climbed from below 4% to about 5%.
Your rate risk depends on the leverage, duration and cash-flow timing of what you own. The asset class label alone tells you little.
For readers wanting to check their own exposure, our dedicated guide to bond duration and fund fact sheets shows how to find the number and turn it into dollar losses.
What the record shows about stocks after the Fed starts tightening
You might expect a simple rule: rates rise, stocks fall. The record does not support that rule.
| Study | Sample | Finding | Date |
|---|---|---|---|
| Morningstar citing Jefferies | First-hike periods | Average 3% after one year, versus 10% in non-hiking periods | 17 September 2026 |
| Morningstar | 21 cycles | Higher 81% of the time; average gain 6.7% | 14 September 2026 |
| Fidelity | Contained hikes (up to 1.25 pp) | Up 83% of the time over 12 months | 21 September 2026 |
| UBS | 16 cycles since 1954 | Average gain 10.8%; worst about -9% | September 2026 |
| LPL | Cycles to 2022-23 | Median 6.8%; positive in every cycle except 2022-23 | 24 September 2026 |
The base rate According to Morningstar, the S&P 500 was higher 12 months after the first hike 81% of the time.
The studies disagree because they define cycles, start dates and returns differently. Their shared message is that returns are usually positive but below normal. The original source found the index higher in four of five cycles.
2022 was the exception. The Fed raised rates in large, fast steps after heavy stimulus. A possible quarter-point move now is a very different event, even with two members voting for one on 28 October. Morningstar’s three AI scenarios all point to lower rates rather than higher ones.
Rate hikes on their own have rarely ended equity returns. The real risk to watch is whether tightening triggers a recession or an earnings slowdown.
Positioning a portfolio without forecasting rates
The aim here is to stay diversified so that being wrong does not hurt you badly. You do not need to predict rates correctly.
Income and duration
Consider high-quality short and intermediate bonds, laddered Treasuries or investment-grade bonds, and moderate duration. A ladder spreads your money across bonds with different maturity dates, so you never have to call the peak in rates. UBS sees attractive risk-reward in short- to medium-term quality bonds and warns that long-duration bonds face fiscal and inflation risk. Goldman favours dynamic strategies that focus on carry, meaning the income a bond earns, along with flexibility.
Large managers including BlackRock, PIMCO and Vanguard favour the 1-5 year curve, where yields are comparable to long bonds but rate sensitivity is materially lower, which supports the case for short and intermediate bonds.
Equity and diversifiers
Tilt your equity holdings towards value, quality and profitable companies, and be selective with low-leverage REITs and utilities. JPMorgan prefers long duration in Europe over the US. The presenter estimates that ex-US equity funds carry roughly half the S&P 500’s tech weighting. A small gold allocation can also help.
What to avoid or approach carefully
Limit high-yield credit and avoid consumer debt. Review annuities carefully before you commit. If you hold only equities, a small bond allocation can help you see how rates affect your portfolio.
| Idea | Rationale | Trade-off |
|---|---|---|
| Short and intermediate bonds | Income with less duration risk | Reinvestment risk if rates fall |
| Bond ladders | No need to call the peak | Does not remove inflation risk |
| International exposure | Less reliance on US fiscal outcomes | A strong dollar can hurt returns |
| Quality tilt | Nearer-term cash flows | Can lag for long periods |
| Small gold allocation | Hedge against fiscal stress | No income; can lag for years |
| Avoid excess high yield | Weak borrowers face refinancing stress | Gives up income |
| Cautious annuities | Reduce longevity risk | Illiquid and costly |
Your goal is to avoid concentration in long-duration assets, weak borrowers or one country’s fiscal outcome. Guessing whether the 30-year reaches 6% is not part of the job.
Building a portfolio that works whichever way yields move next
Three ideas tie this together. Benchmarks such as the 10-year yield tell you where to look. History shows stocks have usually coped with tightening. And the fiscal risk is real but gradual.
The decision in front of you is practical. Check your portfolio’s duration, leverage and concentration, then hold your strategy steady rather than reacting to every yield headline. This explainer is educational and does not take your personal situation into account.
This article is for informational purposes only and should not be considered financial advice. Investors should conduct their own research and consult with financial professionals before making investment decisions. Past performance does not guarantee future results.