
Mid-2026’s Biggest Market Risks, Ranked by Actual Probability
19 hrs ago

If two Singapore REITs both yield 7%, how does an investor determine which one is actually the safer income bet? The answer is that yield alone reveals almost nothing. In 2026, borrowing costs have stabilised but remain well above pre-2022 levels, risk-free alternatives such as Singapore Savings Bonds and T-bills now demand direct comparison, and near-term capital appreciation across the sector is expected to be subdued. The yield gap that once made almost any REIT look attractive has narrowed. Investors who rely on headline yield as their primary filter are now exposed to risks that were previously masked by cheap debt. This guide provides a structured, seven-part framework for evaluating Singapore REIT quality in the current environment: covering the financial metrics analysts actually use, the qualitative factors that separate resilient REITs from fragile ones, and the valuation lens that determines whether even a high-quality REIT is worth owning at the current price.
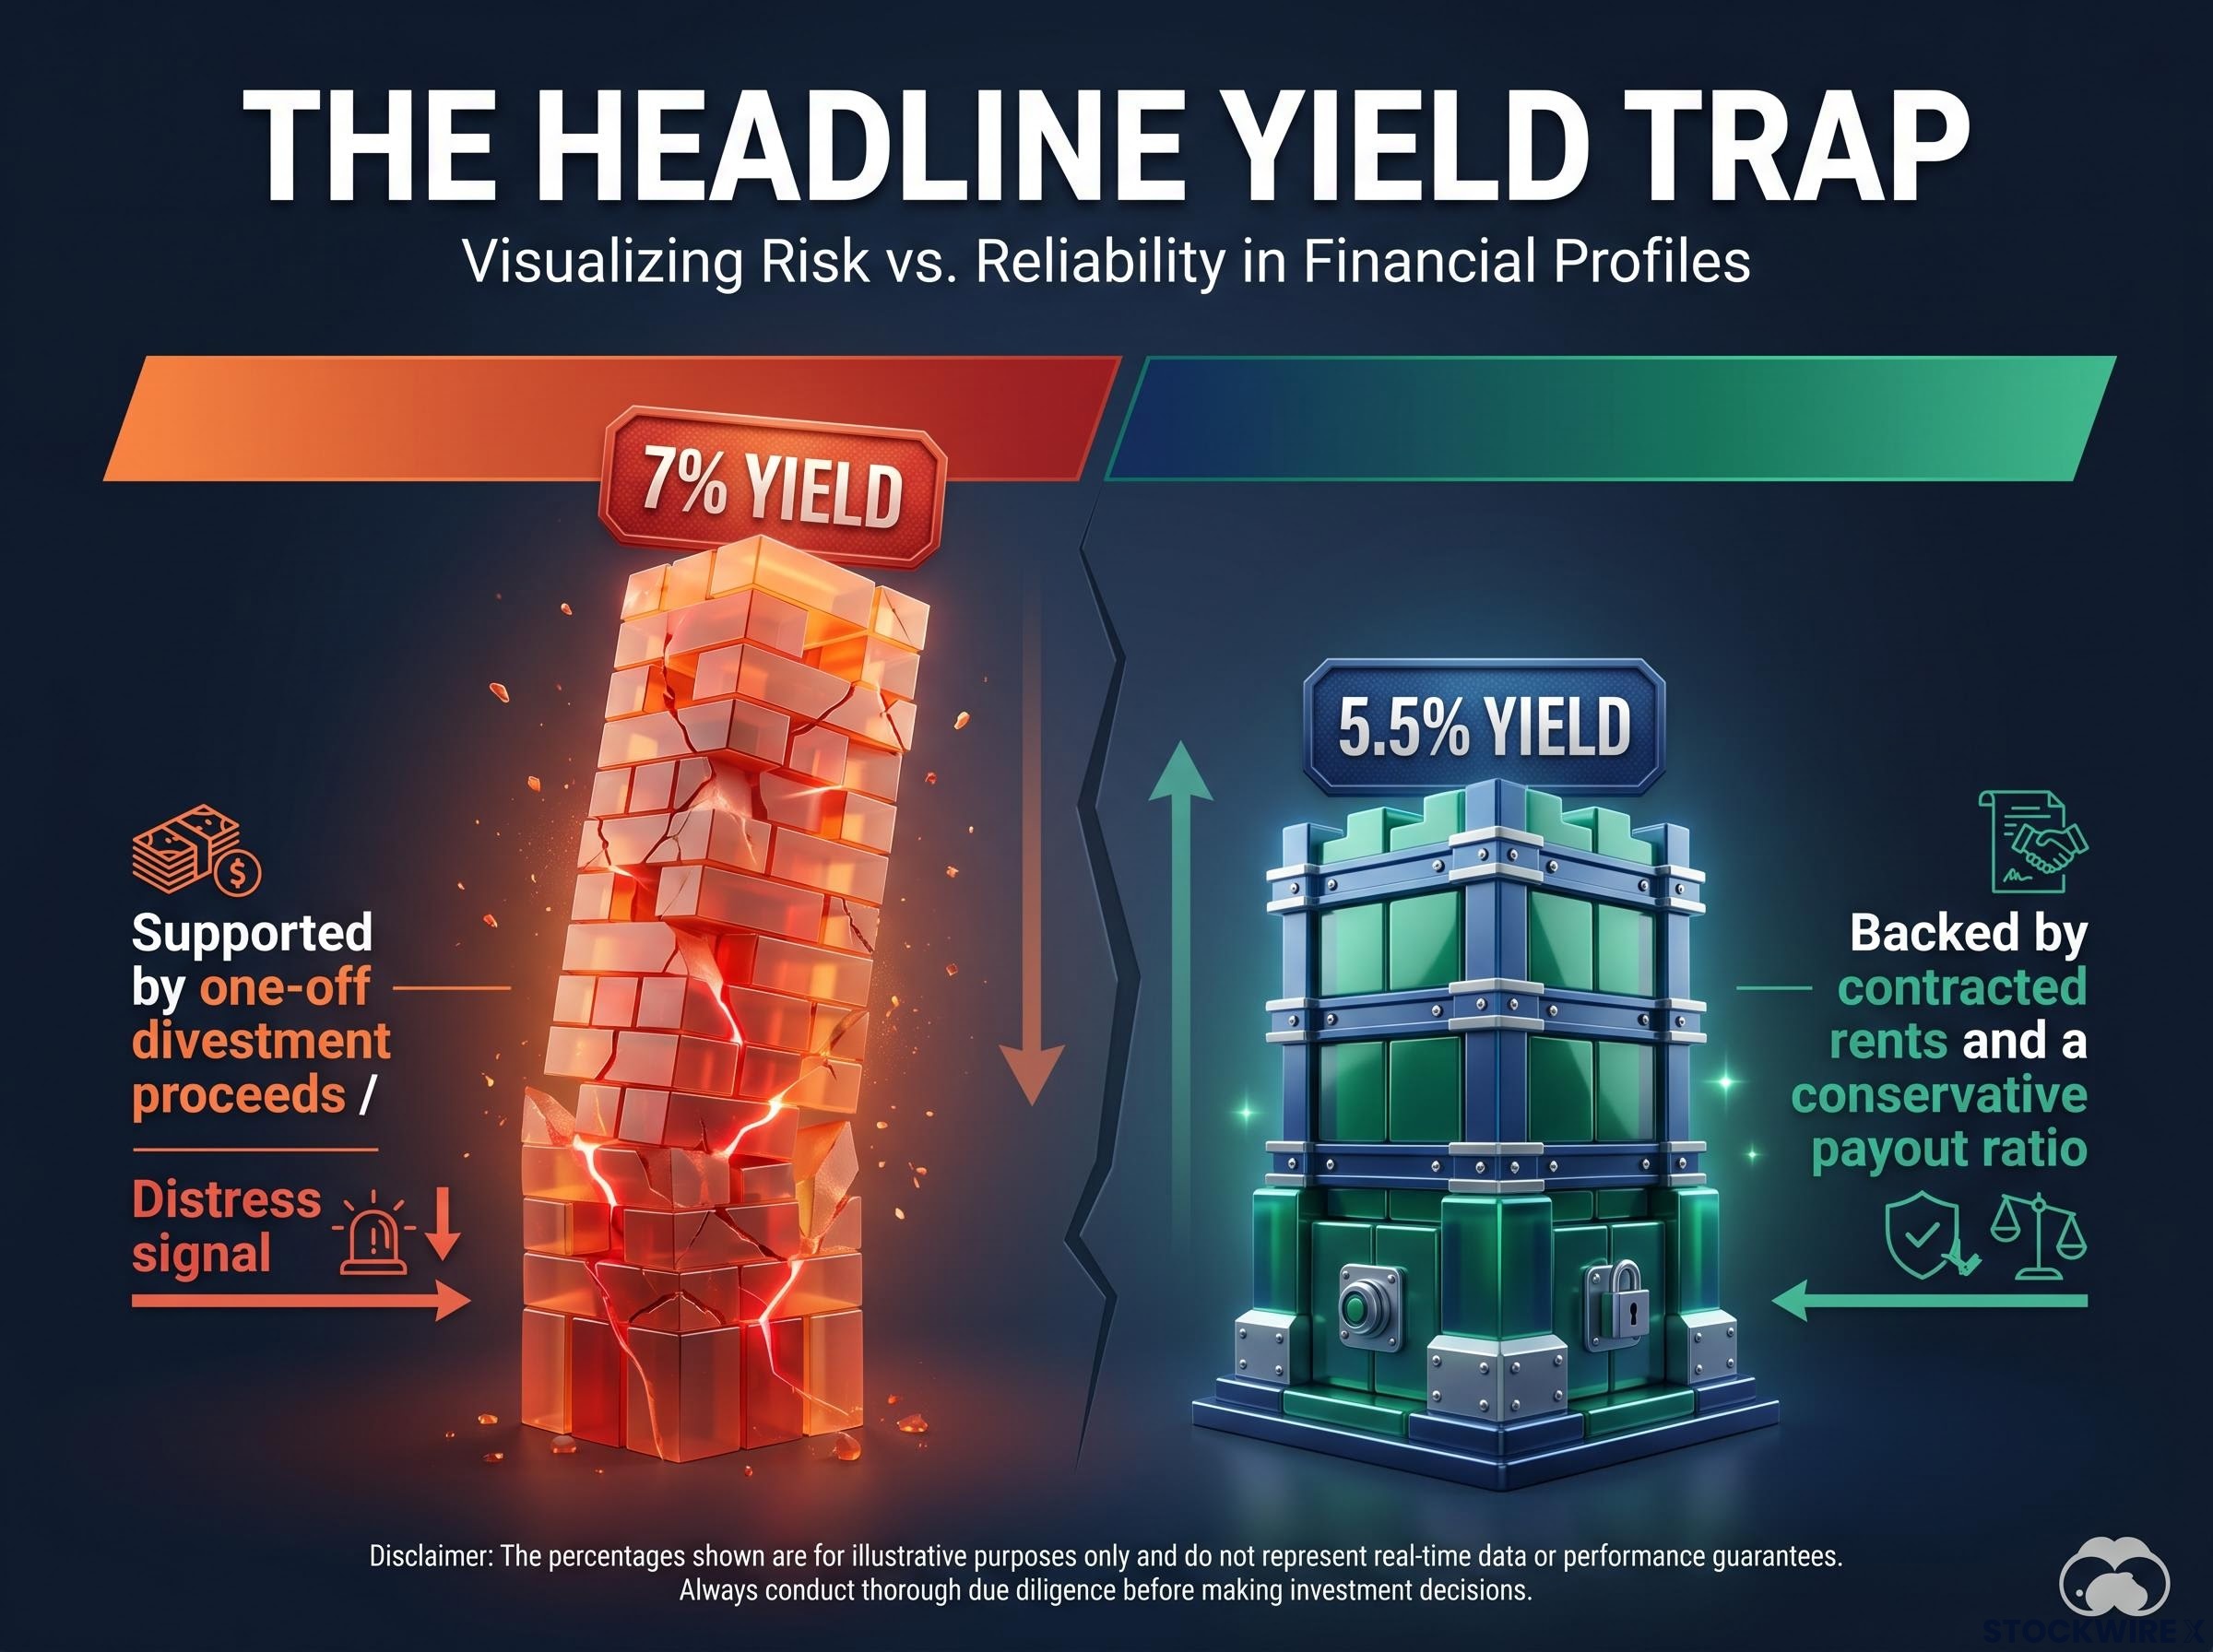
A high distribution yield looks generous on a screener. It can also be a distress signal. When a REIT’s unit price falls sharply because the market expects weaker future cash flows, dilutive equity raisings, or balance sheet stress, the mathematical consequence is a higher yield, one that flatters the very problem it reflects.
The composition of that yield matters just as much as its level. Distributions in some REITs are partly funded by asset sales, foreign exchange gains, or capital returns rather than recurring rental income. A 7% yield supported by one-off divestment proceeds is not comparable to a 5.5% yield backed by contracted rents and a conservative payout ratio.
A very high yield should prompt scrutiny, not enthusiasm, in any of these scenarios:
S-REITs no longer hold the same automatic yield advantage over competing income instruments that they did in the low-rate era of the 2010s. The narrowing gap may, however, enhance relative REIT attractiveness if borrowing costs continue to ease, according to PhillipCapital analysts. Yield must be weighed against the risk being taken, not viewed in isolation from safer alternatives.
The four rate transmission channels connecting interest rate movements to REIT valuations, covering economic outlook signals, discount rate effects on future cash flows, debt financing costs, and yield competition with government bonds, explain why the post-2022 rate environment compressed S-REIT unit prices even as rental income remained stable.
“Fundamental quality and financial discipline matter more than targeting the highest available yield.” Bryan Tan and Shanon Tang, Phillip Securities Pte Ltd (PhillipCapital), March 2026
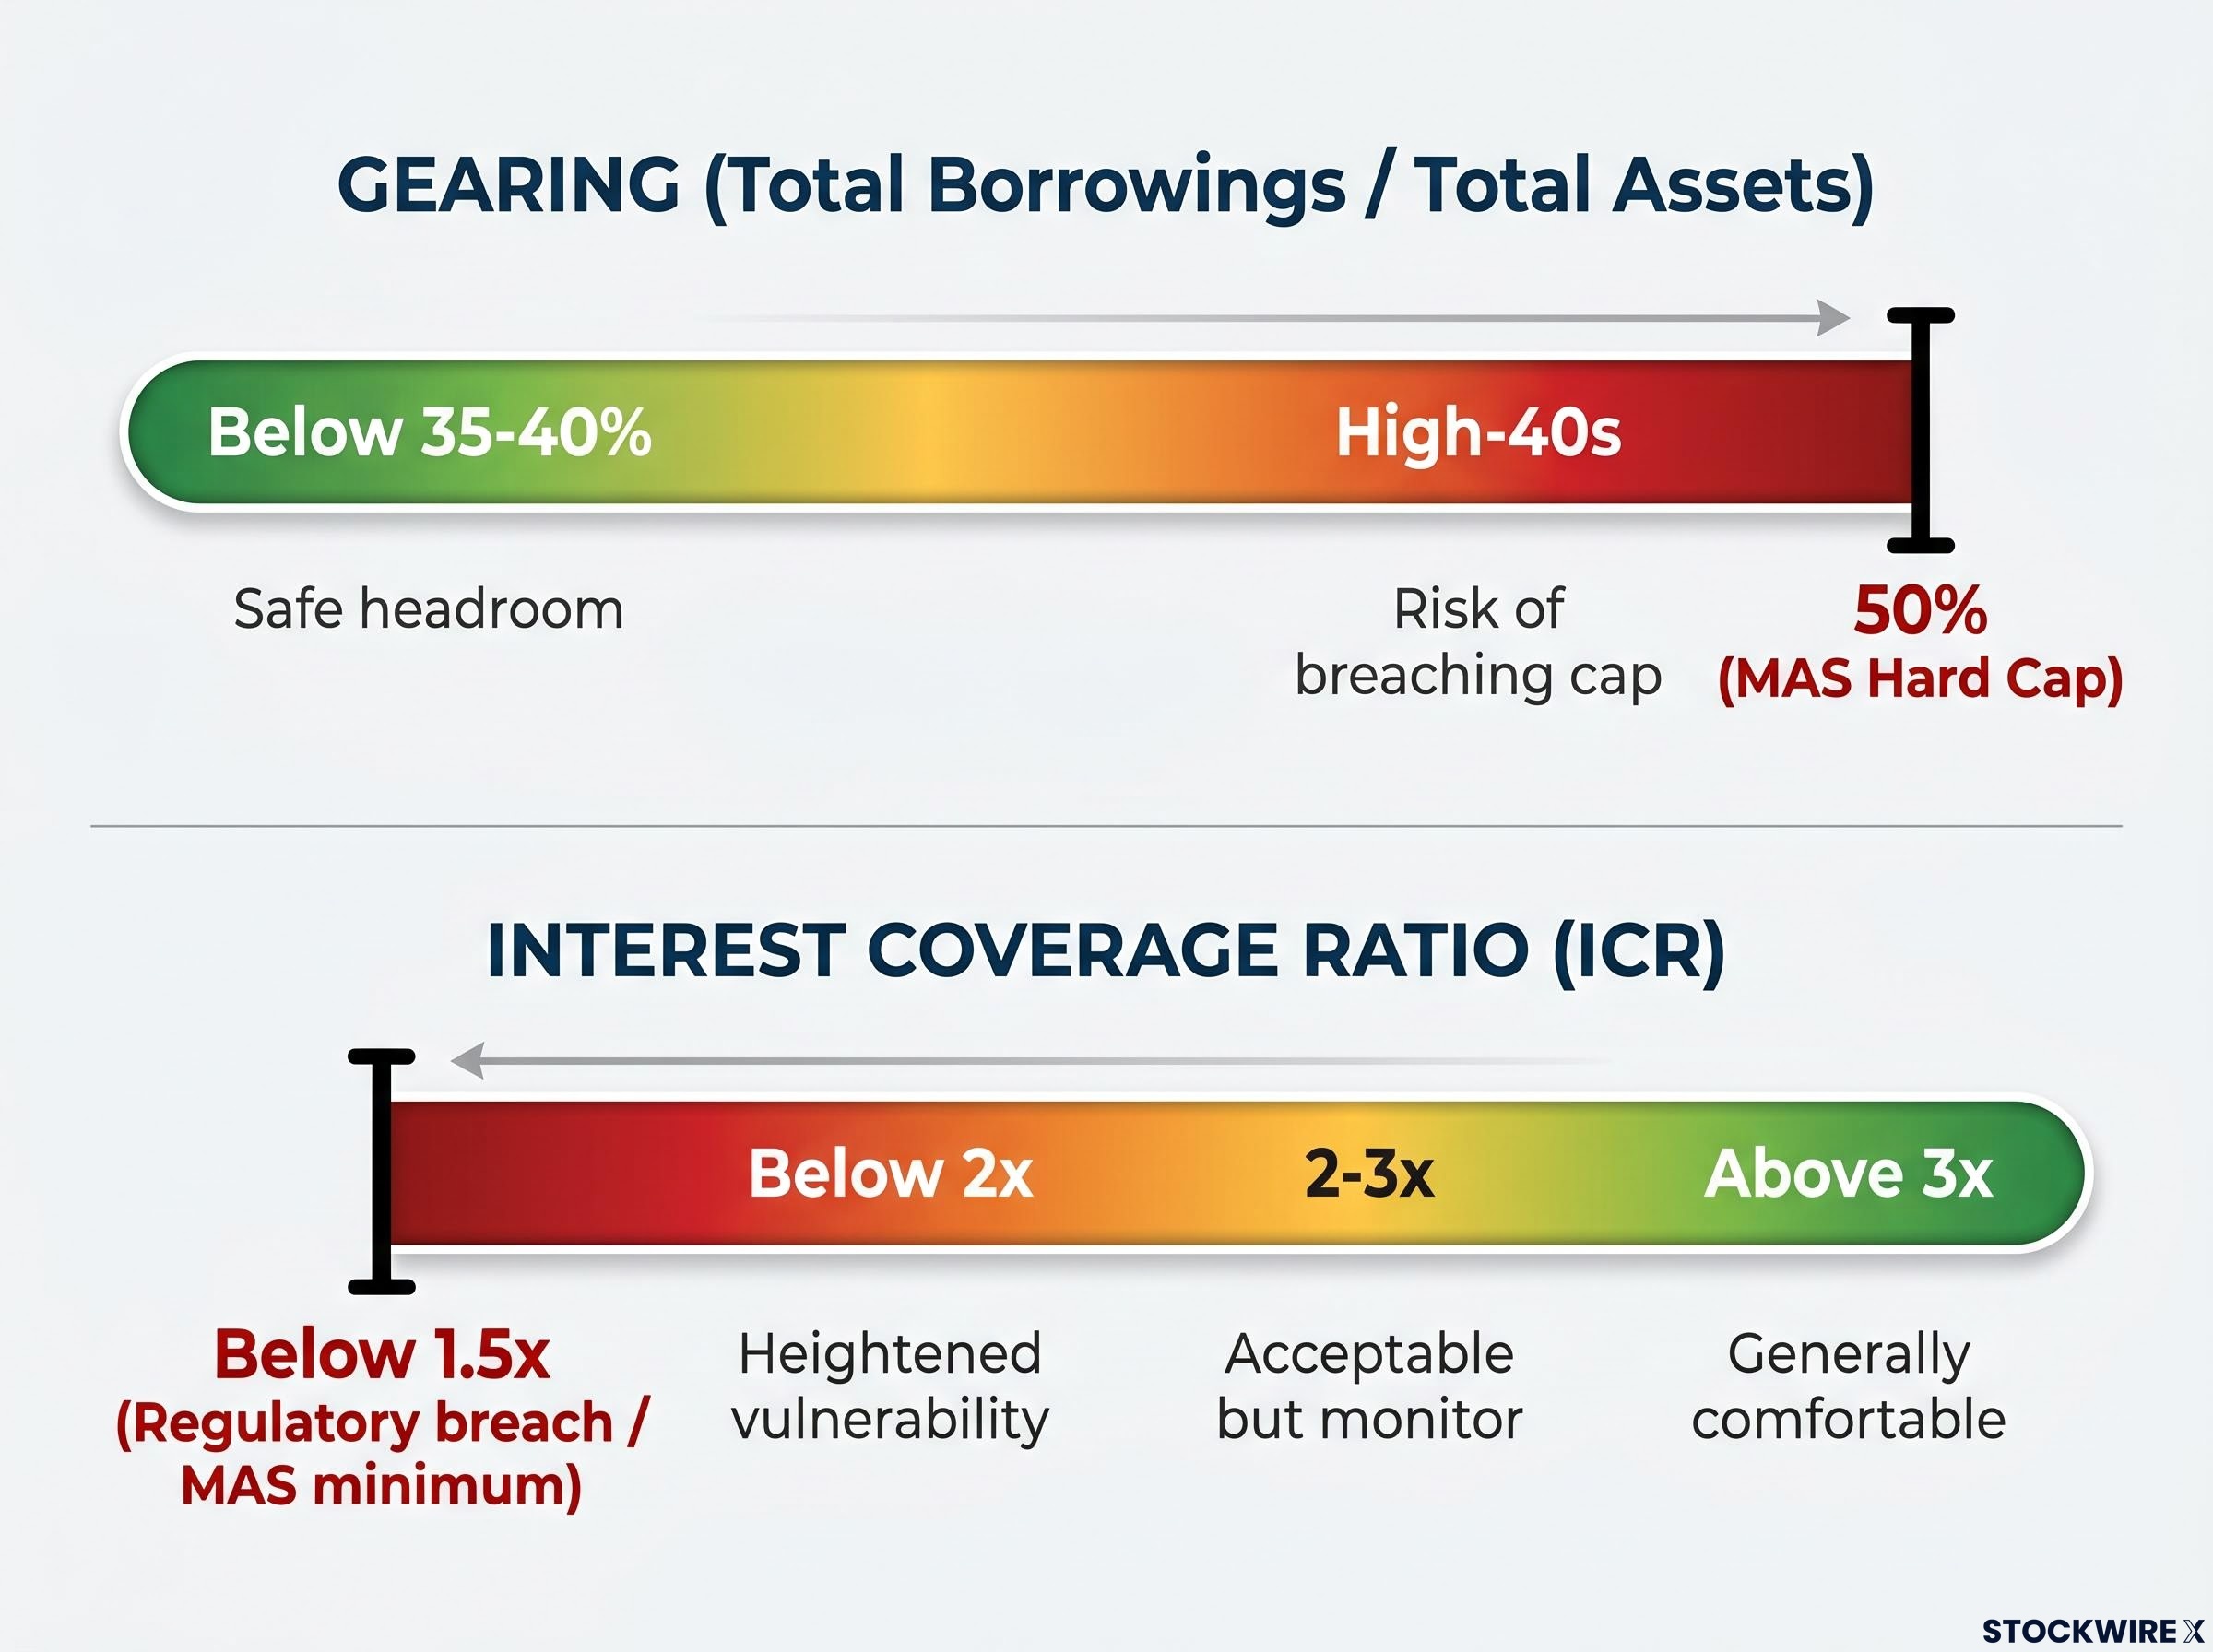
Gearing, measured as total borrowings divided by total assets, is the broadest gauge of balance sheet strain. The Monetary Authority of Singapore (MAS) applies a hard cap of 50% for all S-REITs, but the analytically useful range is tighter. Gearing below roughly 35-40% signals meaningful headroom to absorb valuation declines or cyclical weakness without approaching regulatory limits. A REIT running gearing in the high-40s risks breaching the cap if even modest asset devaluations occur.
The MAS leverage and ICR requirements for REITs were rationalised in November 2024, consolidating the aggregate leverage cap at 50% and setting the minimum interest coverage ratio at 1.5x as binding thresholds applied to all S-REITs with immediate effect.
The interest coverage ratio (ICR) sharpens the picture. It measures how many times a REIT’s earnings cover its interest expense, and it provides a more immediate reading of financial stress than gearing alone.
| ICR Range | Signal | What to Watch | Regulatory Status |
|---|---|---|---|
| Above 3x | Generally comfortable | Good buffer against rate increases or temporary income dips | Well above MAS minimum |
| 2-3x | Acceptable but monitor | Floating-rate debt exposure and near-term refinancing schedule | Above MAS minimum |
| Below 2x | Heightened vulnerability | Rate setbacks, occupancy shocks, or negative rental reversions | Approaching regulatory pressure |
| Below 1.5x | Regulatory breach | Immediate MAS compliance risk | Breaches MAS mandatory minimum |
A solid headline gearing ratio means little if the underlying debt is structured poorly. According to PhillipCapital, many S-REITs are still refinancing debt originated during the ultra-low-rate period, making the debt maturity profile a major differentiator in DPU stability in 2026.
Three structural checkpoints matter:
Singapore REITs are listed trusts that pool capital to own and operate income-producing property. The structure’s core mechanics create both the income appeal and the specific vulnerabilities that the rest of this guide is designed to help evaluate.
The mandatory high payout ratio means REITs cannot easily retain earnings for reinvestment. They are structurally dependent on debt and equity markets to fund acquisitions and capital expenditure. This is precisely why balance sheet quality matters so much: a REIT that must raise capital externally every time it wants to grow is only as strong as its access to reasonably priced funding.
Investors who want to apply the gearing and interest coverage thresholds discussed above should be comfortable with balance sheet fundamentals before working through a REIT’s financial statements, since the same assets-equal-liabilities-plus-equity framework governs how borrowings, property valuations, and equity are reported across all listed trusts.
S-REITs span multiple property sectors, including industrial, retail, office, hospitality, and healthcare, and increasingly hold overseas assets, creating a diverse universe with very different risk profiles. Regulatory compliance (clearing the leverage and ICR minimums) is a floor, not a quality standard.
Tax transparency means income passes through to unitholders without being taxed at the trust level. Unitholders are then subject to tax according to their own jurisdiction and investor category. This makes S-REITs particularly tax-efficient for certain investor profiles, including non-resident non-individual investors who may qualify for exemptions. Tax treatment, however, varies by investor type and jurisdiction, and investors should seek professional advice relevant to their circumstances.
Two REITs with identical current yields can have dramatically different income stability. The difference lies in the quality and visibility of contracted rents, metrics available in every REIT’s quarterly or half-yearly results presentation.
Weighted average lease expiry (WALE) indicates how much future income is already contracted. A longer WALE provides more visibility, but a very long WALE set at below-market rents can cap near-term growth. A shorter WALE raises renewal risk but represents upside if market rents have moved materially higher. Quality S-REITs typically target occupancy in the high-90s for stabilised assets; sustained declines or material underperformance versus sector peers warrant investigation.
Rental reversion, the percentage change in rent on renewal or re-letting versus the expiring rate, diagnoses pricing power. Consistently positive but modest rental reversion combined with high occupancy often signals a more durable income profile than sporadic, lumpy upside.
Consistently positive but modest rental reversion, coupled with high occupancy, often signals a more durable income profile than sporadic, lumpy upside.
Tenant concentration is a risk that never appears in the yield figure. A large exposure to a single tenant or a handful of top tenants creates the potential for a severe DPU shock if that tenant downsizes or exits. Assessing what happens to distributions if a top tenant leaves is a question every investor should ask before committing capital.
Sector-specific lease and income characteristics vary significantly:
Sub-sector return dispersion across global REIT markets exceeded 34 percentage points in 2024, a reminder that the macro rate environment sets the backdrop but sector selection and individual REIT quality ultimately determine whether an investor captures income or suffers capital erosion.
Two REITs with identical financial metrics can deliver very different long-term outcomes depending on who controls the pipeline and how capital is allocated. These qualitative factors are among the highest-value variables to assess before committing capital, particularly because they determine how a REIT behaves in the next stress event, not just how it looks in stable conditions.
The sponsor’s financial strength and the size of its right-of-first-refusal pipeline determine whether a REIT has a credible growth path. A sponsor holding a meaningful equity stake creates alignment with minority unitholders that contractual arrangements alone cannot replicate. Strong sponsorship and experienced management are specifically identified as indicators of a REIT’s capacity to adapt to changing market conditions, according to PhillipCapital.
Management’s capital allocation history is a track record investors can audit. Have past acquisitions been completed at reasonable yields and proved DPU-accretive after financing costs? Have divestments recycled capital into higher-quality assets, or simply preserved a weak portfolio? In 2026, with acquisition-driven growth more subdued due to still-elevated funding costs, many REIT managers are expected to prioritise balance sheet strength over aggressive asset expansion, making capital discipline a particularly visible differentiator.
Positive alignment signals:
Red flags:
Even a high-quality REIT is only a sound investment at the right price and in the right portfolio context.
Price-to-NAV and yield spread versus risk-free instruments are the two most practically useful valuation lenses for S-REITs. A large discount to NAV may appear to signal a bargain, but it can equally reflect genuine asset quality concerns, governance issues, or the market pricing in future valuation writedowns. Property valuations remain sensitive to interest rates and discount rates, meaning reported NAV figures should be interpreted with this sensitivity in mind.
Near-term capital growth for S-REITs is expected to be subdued in 2026, according to PhillipCapital. The sector is best viewed as an income source with selective growth potential rather than a capital-gain vehicle. REIT unit prices may experience equity-like volatility during periods of heightened macroeconomic uncertainty, which means position sizing and portfolio context matter.
Investors wanting to stress-test price-to-NAV figures with cap-rate sensitivity analysis and cross-check yield spreads against transaction evidence will find our dedicated guide to REIT valuation frameworks covers those five tests with worked examples, including how to distinguish a genuine discount from a balance sheet anticipating writedowns.
| Evaluation Area | What to Assess | Green Light Indicator |
|---|---|---|
| Yield quality | Is yield supported by recurring rental income or boosted by one-offs and aggressive leverage? | Yield funded primarily by contracted rents with conservative payout |
| Gearing | Total borrowings relative to total assets | Below 35-40% with headroom from MAS 50% cap |
| Interest coverage | Earnings coverage of interest expense | Above 3x preferred; well above MAS 1.5x minimum |
| Debt profile | Maturity staggering, fixed-to-floating mix, weighted average cost | Even maturity ladder with meaningful fixed-rate proportion |
| Income visibility | WALE, occupancy trends, rental reversion, tenant concentration | High-90s occupancy, positive reversions, diversified tenant base |
| Sponsorship and management | Sponsor strength, equity alignment, capital allocation history | Strong sponsor stake, accretive track record, candid disclosure |
| Valuation | Price-to-NAV, yield spread versus risk-free instruments, peer comparison | Reasonable price relative to NAV, peers, and risk-free yields |
For investors willing to evaluate leverage, cash-flow quality, and asset fundamentals carefully, a basket of sound S-REITs can still provide attractive, tax-efficient income and diversified property exposure. Bryan Tan and Shanon Tang, Phillip Securities Pte Ltd (PhillipCapital), March 2026
The 2026 S-REIT environment rewards investors who treat yield as an output of quality assessment, not the input to the selection decision. PhillipCapital analysts Bryan Tan and Shanon Tang have noted that investment quality and financial discipline are considered more important than targeting the highest available yield in the current normalising environment.
The case for S-REITs within a diversified income portfolio remains genuine: tax-efficient income, diversified property exposure, regulatory oversight, and the potential for modest DPU growth as refinancing costs ease. If borrowing costs continue to decline, the relative attractiveness of S-REITs versus competing income instruments may improve, but this benefit accrues primarily to REITs with diversified debt maturity schedules and meaningful fixed-rate debt exposure, not to those running thin margins on floating-rate borrowings.
The checklist from the preceding section is designed to be reusable. Apply it to any current or prospective S-REIT holding. The seven evaluation areas, reviewed together rather than in isolation, separate income that compounds from income that erodes.
This article is for informational purposes only and should not be considered financial advice. Investors should conduct their own research and consult with financial professionals before making investment decisions. Past performance does not guarantee future results. Financial projections are subject to market conditions and various risk factors.
A Singapore REIT (S-REIT) is a listed trust that pools investor capital to own income-producing properties, and it must distribute at least 90% of taxable income to unitholders to qualify for tax transparency under Singapore law, which drives the high payout ratios that attract income-focused investors.
While the MAS imposes a hard aggregate leverage cap of 50%, analysts consider gearing below roughly 35-40% as the analytically sound range, providing meaningful headroom to absorb asset valuation declines or cyclical weakness without approaching the regulatory limit.
The interest coverage ratio measures how many times a REIT's earnings cover its interest expense; an ICR above 3x is generally considered comfortable, while anything below the MAS mandatory minimum of 1.5x signals a regulatory breach and immediate compliance risk.
WALE shows how much future rental income is already contracted, providing visibility into distribution stability; a longer WALE reduces renewal risk, while a shorter WALE can represent upside if market rents have risen materially above expiring rates.
Investors should measure the yield spread between an S-REIT's distribution yield and competing instruments such as Singapore Savings Bonds and T-bills, since the narrowing gap in the post-2022 rate environment means headline REIT yield no longer holds the same automatic advantage it did during the low-rate era of the 2010s.