
A Probability Framework for Assessing Market Risk in 2026
5 mins ago

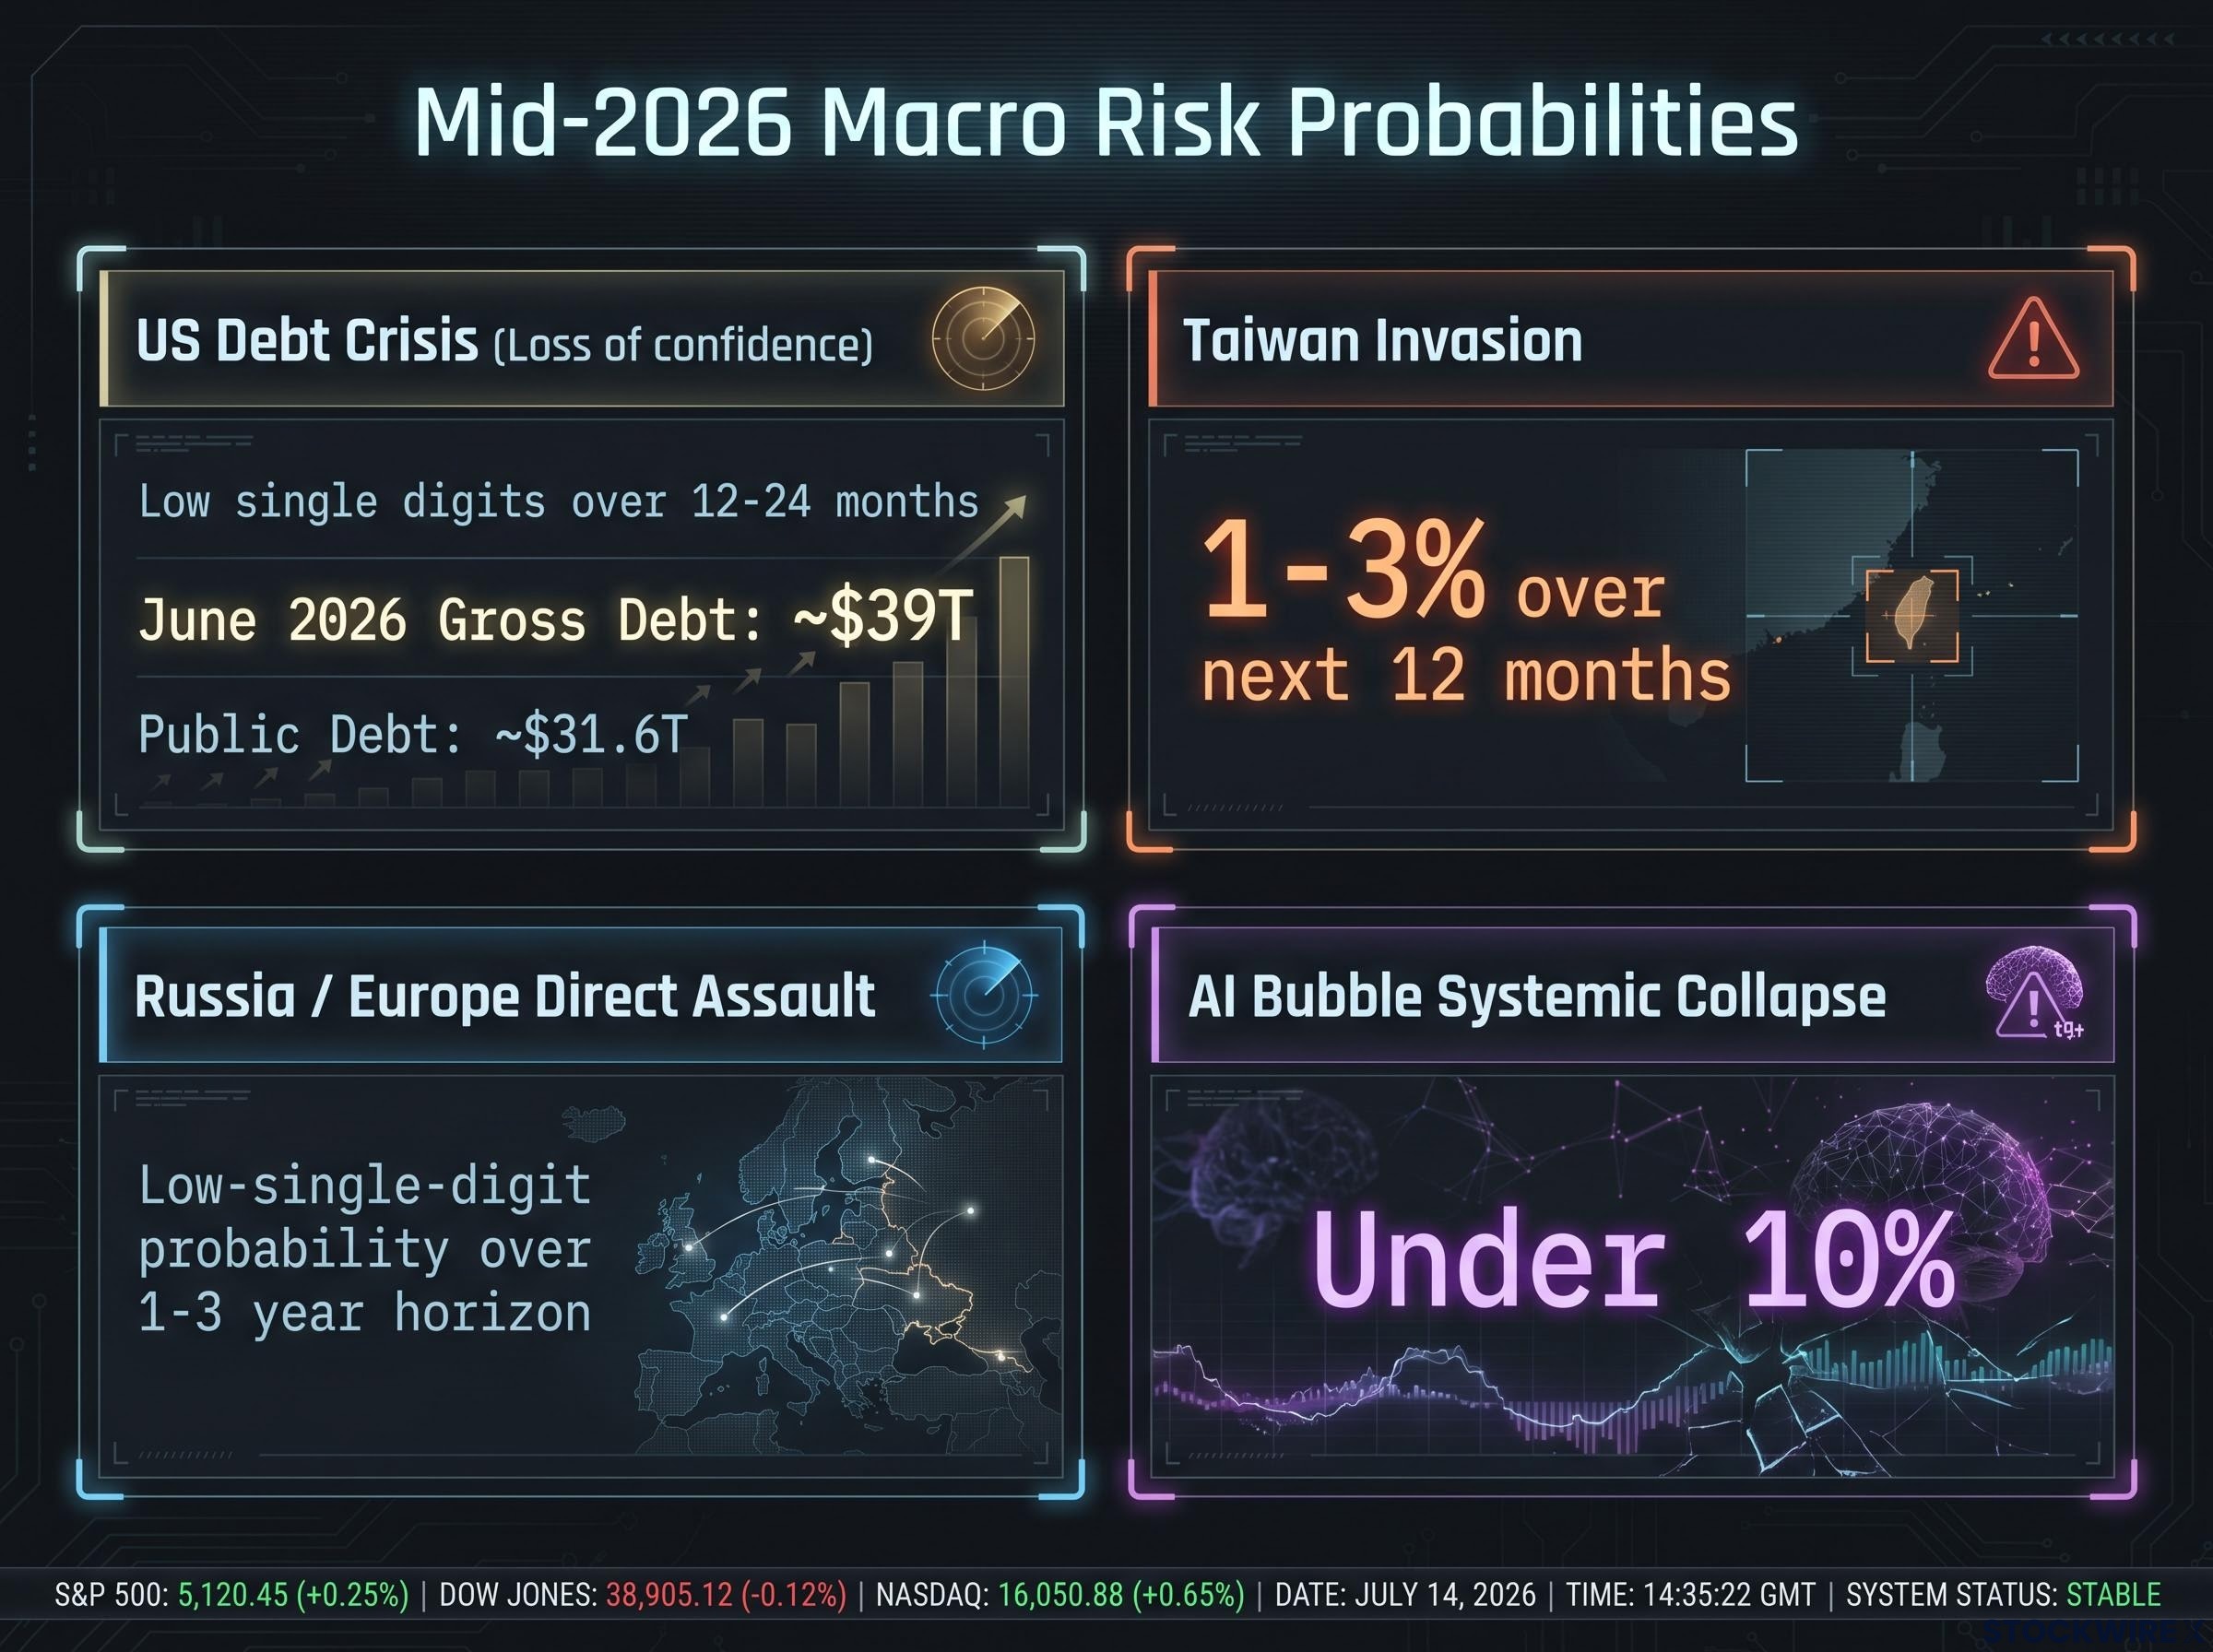
Every major financial headline in mid-2026 seems to describe the next catastrophe, yet the four most-feared macro risks, a US debt spiral, China seizing Taiwan, Russia crossing into NATO territory, and an AI market implosion, each carry estimated probabilities in the low single digits. None clears the threshold for portfolio restructuring. All four generate outsized media attention relative to their statistical likelihood, and the gap between narrative intensity and actual probability is where real portfolio damage occurs.
Fear of low-probability catastrophes produces measurable economic harm. Excessive defensiveness, missed returns, and reactive position changes compound rather than reduce risk. What follows is a structured, probability-based framework for evaluating each of the biggest market risks circulating in mid-2026, separating scenarios that warrant genuine portfolio action from those that justify only targeted monitoring. The objective is to leave readers with both a method and a dashboard they can apply immediately.
The framework begins with base rates: the historical frequency of events like sovereign defaults and great-power interstate wars over 50-100 year windows. These base rates provide a statistical anchor before any current-conditions adjustment enters the picture. From that anchor, the derivation follows three steps:
Three actionability thresholds determine the portfolio response. At or above 66% probability, roughly double the odds of the alternative, a major allocation shift is justified. In the 20-40% range, targeted sector tilts and position-sizing adjustments are appropriate. At or below 10%, the right response is monitoring plus cheap asymmetric hedges, not portfolio restructuring.
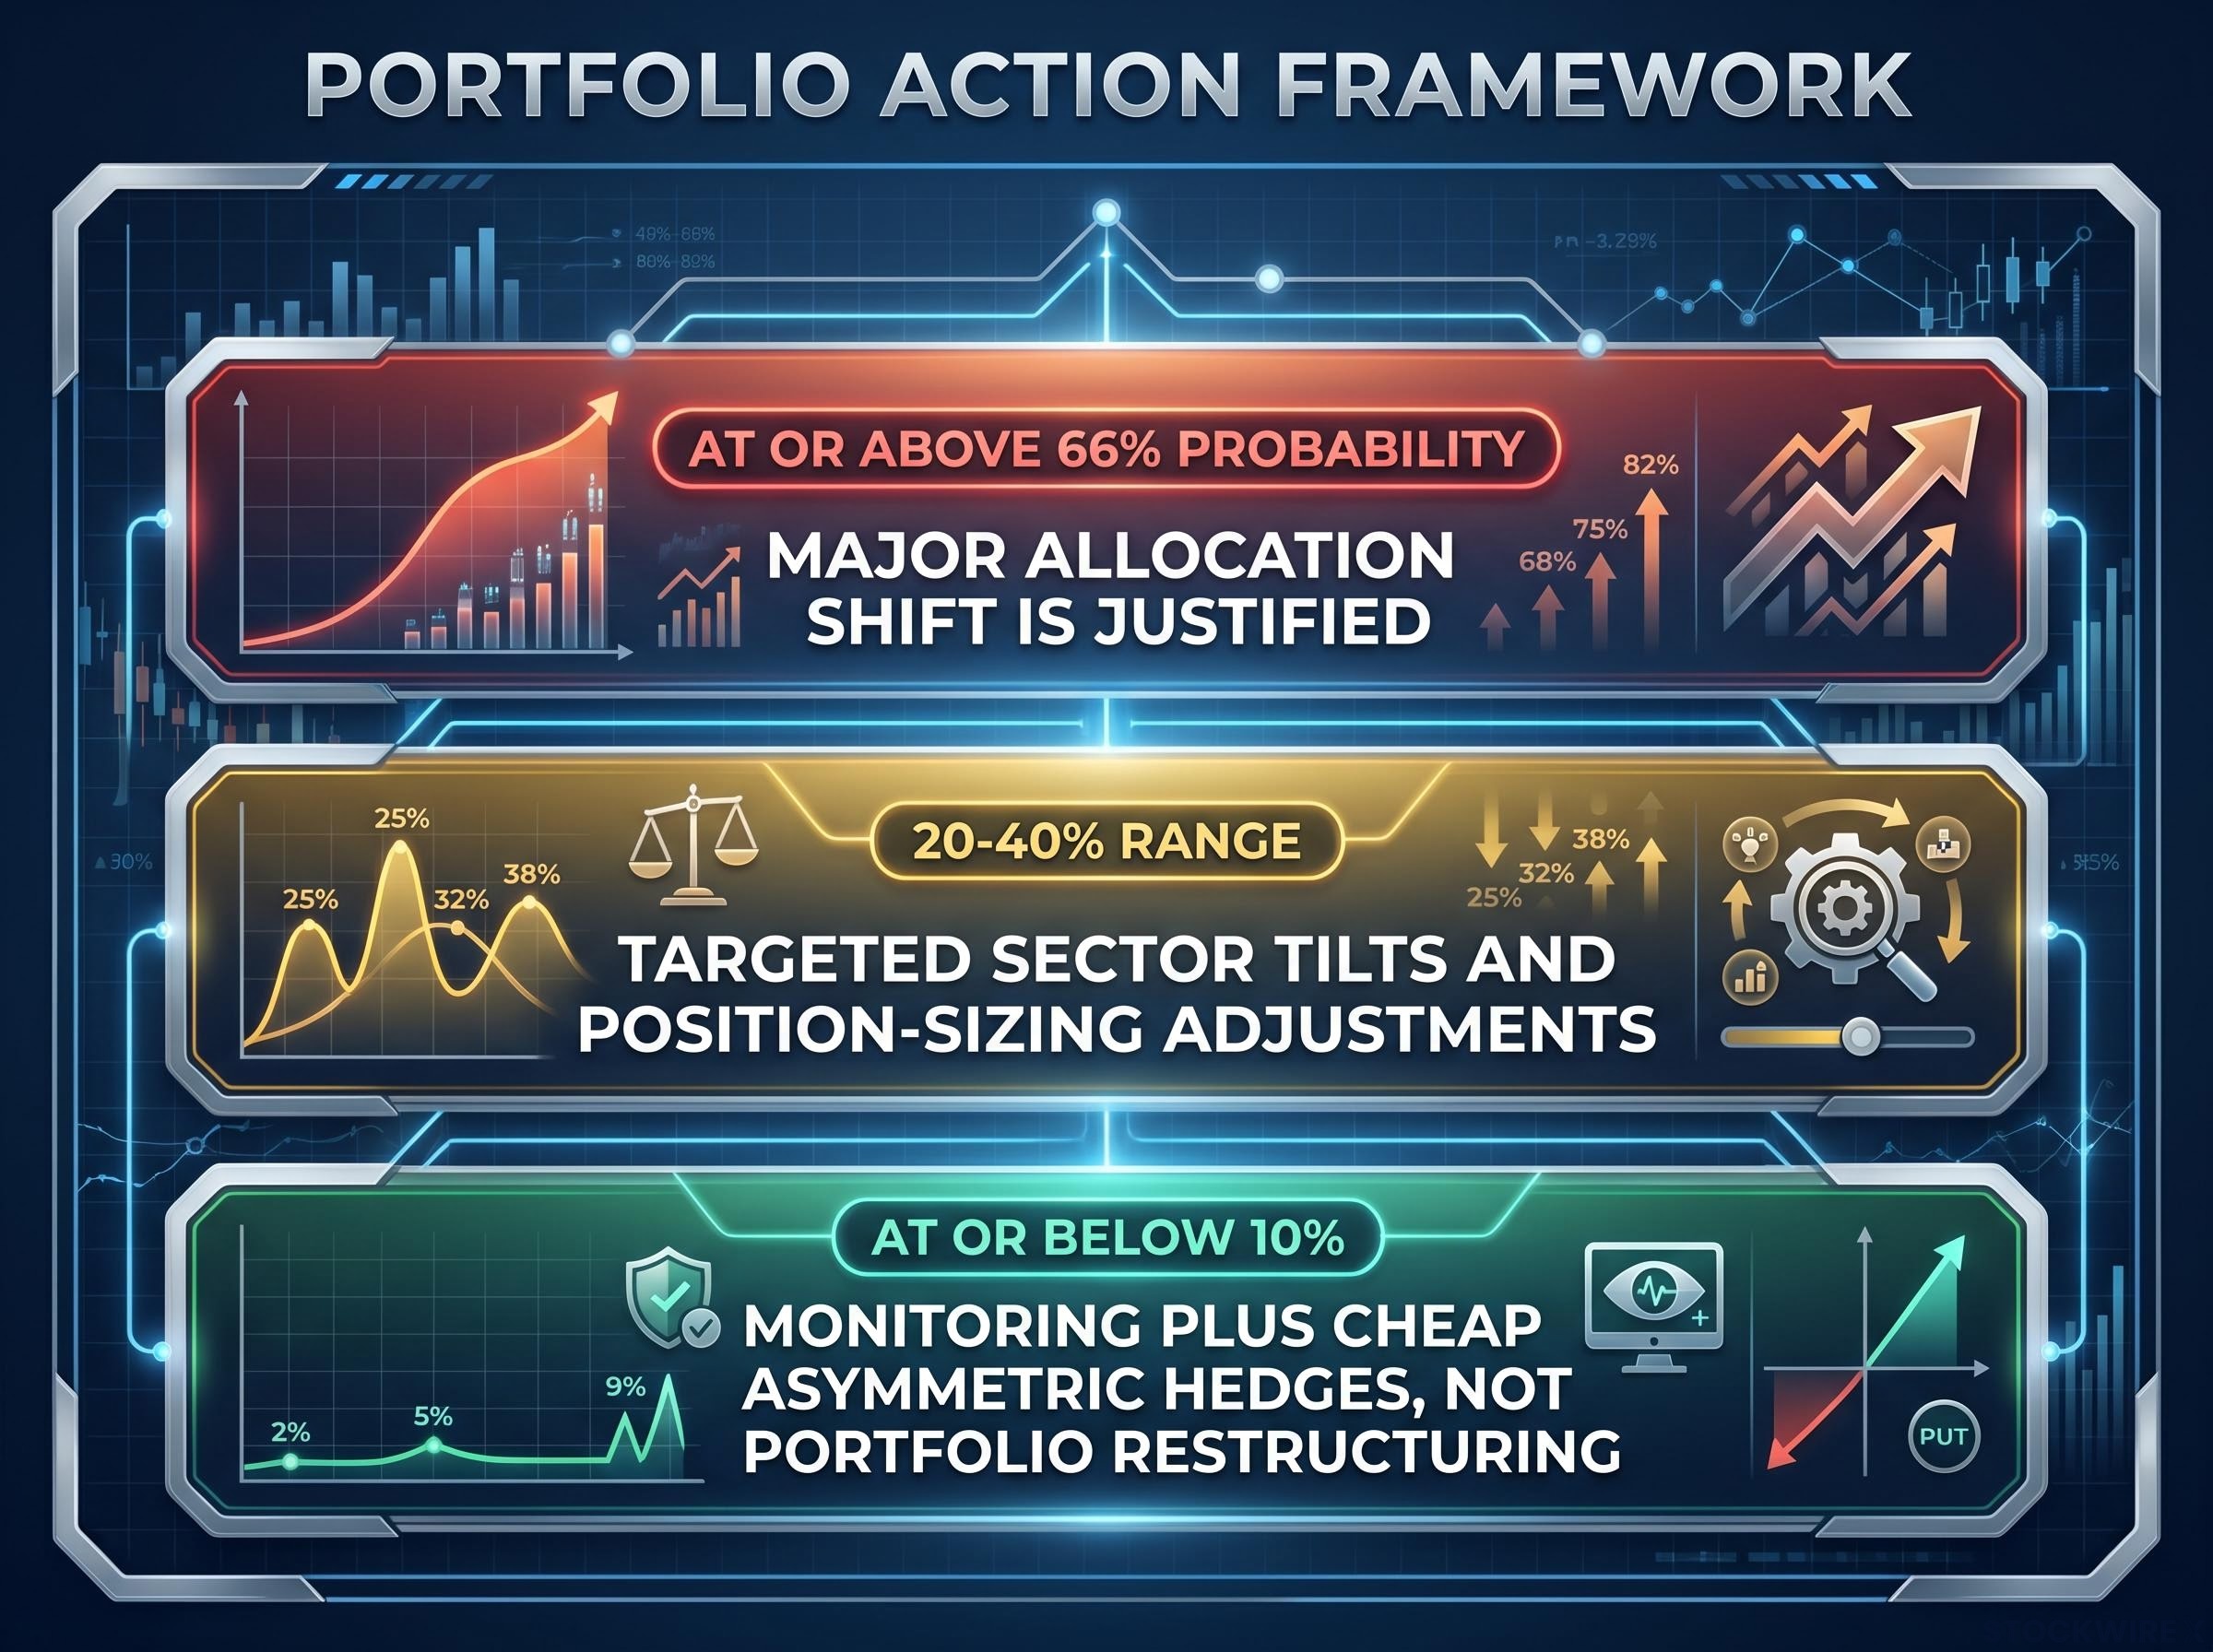
The 66% threshold marks the point at which the odds of an outcome are roughly double those of the alternative. Below it, portfolios should be adjusted at the margin, not rebuilt.
The operating principle underlying all of this is Bayesian updating. Probability estimates are not static verdicts. They are living assessments, revised upward when early warning indicators move materially and persistently, then revised back toward the base rate when signals fade. Without this methodology, probability talk is confident-sounding guesswork.
Two distinct scenarios live under the label “US debt crisis,” and their probabilities and consequences differ sharply.
| Dimension | Technical Default / Debt Ceiling Standoff | Loss of Market Confidence in Treasuries |
|---|---|---|
| Probability | Higher (political brinkmanship recurs regularly) | Low single digits over 12-24 months |
| Primary Driver | Congressional procedural standoffs | Sustained foreign divestment, deteriorating auction conditions |
| Systemic Consequence | Lower (temporary disruption, typically resolved) | Far higher (structural repricing of risk-free rate globally) |
| Key Monitoring Signal | Debt ceiling negotiation timelines, Treasury cash balance | Long-end yields, US CDS spreads, foreign holdings trends, bid-to-cover ratios |
Gross federal debt stands at approximately $39 trillion as of June 2026, with debt held by the public near $31.6 trillion. The scale of the long-run trajectory is a legitimate concern. The near-term acute crisis probability remains low, anchored by three structural protections: reserve currency status providing persistent global demand, deep and liquid Treasury markets that absorb large volumes without structural disruption, and strong political incentives against default in virtually all scenarios.
US Treasury Fiscal Data confirms gross federal debt at approximately $39 trillion as of June 2026, with debt held by the public near $31.6 trillion, figures that reflect a legitimate long-run fiscal trajectory concern even as the structural protections anchoring near-term stability remain intact.
Crises of this type historically provide detectable market warning signals well before acute damage materialises, making daily monitoring a realistic early-warning mechanism rather than a theoretical exercise.
Three observable shifts would move the acute crisis probability materially higher: sustained acceleration in foreign Treasury divestment, deteriorating auction bid-to-cover ratios across multiple consecutive auctions, and long-end yields rising persistently above levels justified by inflation and growth fundamentals. Until those indicators move together, the base rate holds.
A full-scale amphibious invasion of Taiwan carries a low-single-digit probability, approximately 1-3% over the next 12 months. That figure is roughly 50 times more likely not to happen than to happen, though this framing is a rough order-of-magnitude expression, not a precise calculation.
The real analytical error is conflating “invasion” with all forms of coercive action. Three distinct pathways carry meaningfully different probabilities when disaggregated:
Semiconductor supply chain exposure to a Taiwan blockade or gray-zone pressure scenario is more concentrated than most portfolio allocations reflect: Nvidia carries approximately 20-25% of data-centre revenue from China, TSMC roughly 11% of 2023 net revenue, and ASML approximately 29% of 2023 sales, meaning a scenario short of full invasion still transmits meaningfully through technology portfolios.
The probability of some form of significant coercive escalation is meaningfully higher than the probability of a full-scale amphibious invasion. Investors who treat Taiwan risk as a binary “invasion or not” variable are both overreacting to one scenario and underreacting to another.
Observable indicators for Bayesian revision include large-scale PLA amphibious and logistics exercises, naval asset movements, US and Japan diplomatic signals, arms sales announcements, and the frequency of joint exercises. The relevant market exposure extends beyond defence equities to semiconductor supply chains, Taiwan-linked equity indices, and the broader technology sector given Taiwan’s role in advanced chip manufacturing.
Taiwan Semiconductor Industry Association data projects Taiwan’s share of global wafer foundry capacity rising to approximately 78.6% in 2025, a concentration figure that explains why even the gray-zone and blockade scenarios carry significant market implications for technology supply chains well beyond the full-invasion probability.
The same disaggregation logic applies to the Russia-Europe risk. Two distinct categories carry different probabilities and transmit through different portfolio channels:
The risk that actually moves US investor portfolios in the near term is not a land war in Europe but persistent hybrid pressure that keeps energy prices elevated and European risk premiums widened. That is a more probable and more tradeable scenario.
NATO political unity is itself an observable variable. Fractures in alliance cohesion could shift the deterrence calculus in ways that matter more than Russian military posture alone. Key monitoring indicators include Russian force rebuilding pace, NATO unity signals, energy price trends, and hybrid attack incident frequency.
Sustained outperformance in European and US defence equities relative to the broad market functions as a real-time probability signal. Markets are pricing in elevated but sub-restructuring-threshold risk, consistent with the framework’s assessment that monitoring and targeted hedges, not portfolio overhauls, are the appropriate response.
The catastrophic AI-collapse scenario, a systemic event that drags the entire growth complex down, carries a probability estimate under 10%. A sector-specific AI cohort drawdown of 50-70% is a meaningfully different and more plausible scenario, and conflating the two distorts portfolio thinking in both directions.
Three structural differences separate the current environment from 1999:
| Characteristic | Dot-Com Era (1999-2000) | AI Era (2024-2026) |
|---|---|---|
| Earnings / Cash Flow | Broadly absent across leading names | Leading AI beneficiaries generate substantial revenues and cash flows |
| Representative Forward P/E | Near triple-digit levels | Approximately 25-45 range for largest AI beneficiaries |
| Market Cap Concentration | Elevated but lower than current levels | Top-10 S&P 500 concentration near 40-41% |
| Nasdaq Peak-to-Trough Drawdown | Approximately 78% (March 2000 to October 2002) | N/A (no comparable drawdown to date) |
| Systemic Collapse Probability | Realised | Under 10% |
Memory chip prices across DRAM and NAND segments have risen to multiples well above prior-cycle lows from September 2025, reinforcing the earnings-backed nature of the current cycle. The concentration risk is a separate but related concern: AI-linked stocks representing a historically elevated share of total market cap means that even a probability-neutral sector rotation would have outsized index-level effects.
AI valuation concentration risk has a specific structural dimension that the dot-com comparison understates: the top 10 S&P 500 constituents now account for 40-43% of total index market capitalisation, more than 50% above the dot-com era peak concentration of approximately 27%, meaning a probability-neutral sector rotation would produce outsized index-level effects even without a systemic collapse.
A 50-70% drawdown in a narrow AI cohort is fundamentally different from a systemic collapse of the entire growth complex. Conflating the two causes investors to either dismiss the risk entirely or over-hedge against it.
The conditions that would revise the estimate upward are specific and observable: sustained capex cuts from hyperscalers tied to AI and data centre investment, negative operating leverage where capex continues ramping while AI-related revenue growth stalls, and broad multiple compression driven by higher real yields rather than a narrative shift alone.
A probability framework without an operational monitoring protocol is philosophy, not practice. Daily monitoring is the mechanism for Bayesian revision, not a news-scanning exercise. The dashboard organises into four thematic clusters:
Each cluster maps directly to one or more of the four risks, making the monitoring process risk-specific.
Mapping diplomatic headlines onto portfolio exposures before they arrive is the operational complement to probability monitoring: three policy announcements between January and May 2026 moved global equity markets more decisively than any economic data release in the same period, with single-session swings ranging from a 2.06% S&P 500 decline to a 6.87% KOSPI surge, illustrating how geographic and sector-level pre-positioning determines which portfolios capture or avoid the move.
| Risk | Primary Cluster | Specific Indicators | Signal for Upward Revision |
|---|---|---|---|
| US Sovereign Debt | Macro and Credit | Long-end Treasury yields, US CDS spreads, foreign Treasury holdings, auction bid-to-cover ratios | Sustained deterioration across multiple indicators simultaneously |
| China / Taiwan | Geopolitical | PLA exercise headlines, naval asset movements, US/Japan diplomatic signals, arms sales announcements | Large-scale amphibious logistics exercises with anomalous scale or duration |
| Russia / Europe | Geopolitical + Macro | Energy prices, NATO unity signals, Russian force rebuild reports, hybrid attack incident frequency | Accelerating hybrid incidents combined with NATO political fractures |
| AI Tech Bubble | Thematic / Sector | Hyperscaler earnings revisions, capex guidance commentary, AI-leader valuation multiples, AI-cohort volatility | Consecutive quarters of capex cuts or revenue growth stalling against rising costs |
Historical evidence shows that markets generate detectable warning signals before major downturns. Attentive daily monitoring carries genuine predictive utility rather than just reactive value. When an indicator moves materially and persistently, revise the prior upward. When the signal fades, revert toward the base rate.
None of the four risks currently clears the 66% threshold for major allocation shifts. All four warrant monitoring, and all four may justify targeted, asymmetric hedges given the severity of potential outcomes relative to hedge cost. That is a calibrated conclusion, not reassurance.
The framework is designed to prevent two types of error. Over-reaction restructures a portfolio around a 2% probability scenario, locking in opportunity cost that compounds over years. Under-reaction ignores a 2% scenario with catastrophic potential entirely, forgoing cheap hedges that would have asymmetric payoffs if the tail event materialised.
The operational principle is straightforward: hold positions until the assessed conditions actually change, track the dashboard indicators daily as the mechanism for detecting when they do, and revise probabilities upward or downward in response to what the indicators show rather than what headlines claim. The framework’s value is not that these risks are unlikely. It is that “unlikely” now has a precise meaning, a range, a time horizon, and a set of observable triggers that would change the assessment.
This article is for informational purposes only and should not be considered financial advice. Investors should conduct their own research and consult with financial professionals before making investment decisions. These probability estimates are speculative assessments subject to change based on market developments and geopolitical conditions.
The four most widely feared macro risks in mid-2026 are a US sovereign debt crisis, a Chinese invasion of Taiwan, a Russian assault on NATO territory, and a systemic AI market collapse. Each carries an estimated probability in the low single digits over a 12-month horizon, meaning none currently justifies a major portfolio restructuring.
According to the framework outlined in this analysis, a major allocation shift is only justified at or above a 66% probability, roughly double the odds of the alternative. In the 20-40% range, targeted sector tilts are appropriate, while risks below 10% warrant monitoring and cheap asymmetric hedges rather than wholesale portfolio changes.
A full-scale amphibious invasion carries roughly a 1-3% probability over 12 months, but blockades, gray-zone maritime pressure, and coercive political campaigns carry meaningfully higher probabilities and still transmit through semiconductor supply chains and technology portfolios. Treating Taiwan risk as a binary invasion-or-nothing variable causes investors to both overreact to one scenario and underreact to others.
Unlike the dot-com era, leading AI beneficiaries today generate substantial revenues and cash flows, with forward price-to-earnings ratios in the 25-45 range rather than near triple-digit levels. However, the top 10 S&P 500 constituents now account for roughly 40-43% of total index market capitalisation, meaning even a probability-neutral sector rotation would have outsized index-level effects.
The three key signals that would revise the US sovereign debt crisis probability materially higher are sustained acceleration in foreign Treasury divestment, deteriorating auction bid-to-cover ratios across multiple consecutive auctions, and long-end yields rising persistently above levels justified by inflation and growth fundamentals. These indicators moving together, not individually, is the meaningful warning signal.