
Mid-2026’s Biggest Market Risks, Ranked by Actual Probability
3 mins ago

The risks that dominate financial headlines are often the ones least likely to materially alter a well-structured portfolio. They consume more investor attention than the quiet, compounding forces that actually erode returns. In mid-2026, US investors face a media environment saturated with macro catastrophe narratives: a $39 trillion national debt, Taiwan Strait tensions, NATO’s eastern flank, and an AI valuation correction. Each fear is plausible. Most are statistically unlikely to resolve in a portfolio-damaging way within any given investment horizon. What follows is a structured, probability-based framework for evaluating market risk assessment decisions, separating genuinely actionable scenarios from monitoring-only concerns. Readers will leave with explicit probability estimates, time-anchored interpretations, a decision threshold for portfolio action, and a concrete set of indicators to track for each scenario.
Low-probability events generate disproportionate media coverage. A potential US sovereign default or a Taiwan Strait confrontation produces weeks of sustained commentary precisely because the consequences would be severe, not because the event is likely. This creates a systematic gap between perceived risk and statistical likelihood, one that quietly costs investors money.
Without explicit probability estimates anchored to a specific time horizon, there is no rational basis for deciding whether a scenario should drive portfolio changes. A 10% probability over one year and a 10% probability over ten years require fundamentally different responses, yet headlines make no such distinction.
The definition of risk being applied here matters: headline volatility and permanent capital loss are fundamentally different concepts, and conflating them is precisely what leads investors to treat a 30% drawdown in a structurally sound holding as a signal to exit rather than a temporary price event.
All four scenarios assessed in this framework carry probability estimates under 10% over their respective time horizons. That does not make them irrelevant. It means they belong in a monitoring system, not in the driver’s seat of portfolio design.
An investor who stayed defensively positioned from 2011 to 2019 due to Eurozone sovereign debt fears or China hard-landing concerns missed one of the longest equity bull markets in modern history. Those fears received sustained, serious media coverage throughout the entire period. The opportunity cost of treating media intensity as a proxy for investment probability compounded year after year.
Probability estimates in this framework are working tools for structuring decisions, not actuarial calculations. Their value lies in forcing a disciplined question: how likely is this, over what period, and does that justify the capital I would commit to hedging it?
A threshold of roughly 66% probability serves as the benchmark at which a scenario becomes the base case that should drive wholesale portfolio restructuring. At that level, the scenario is approximately twice as likely to occur as not. Below it, the question shifts from “should I restructure?” to “how much, if at all, should I tilt or hedge given the payoff structure?”
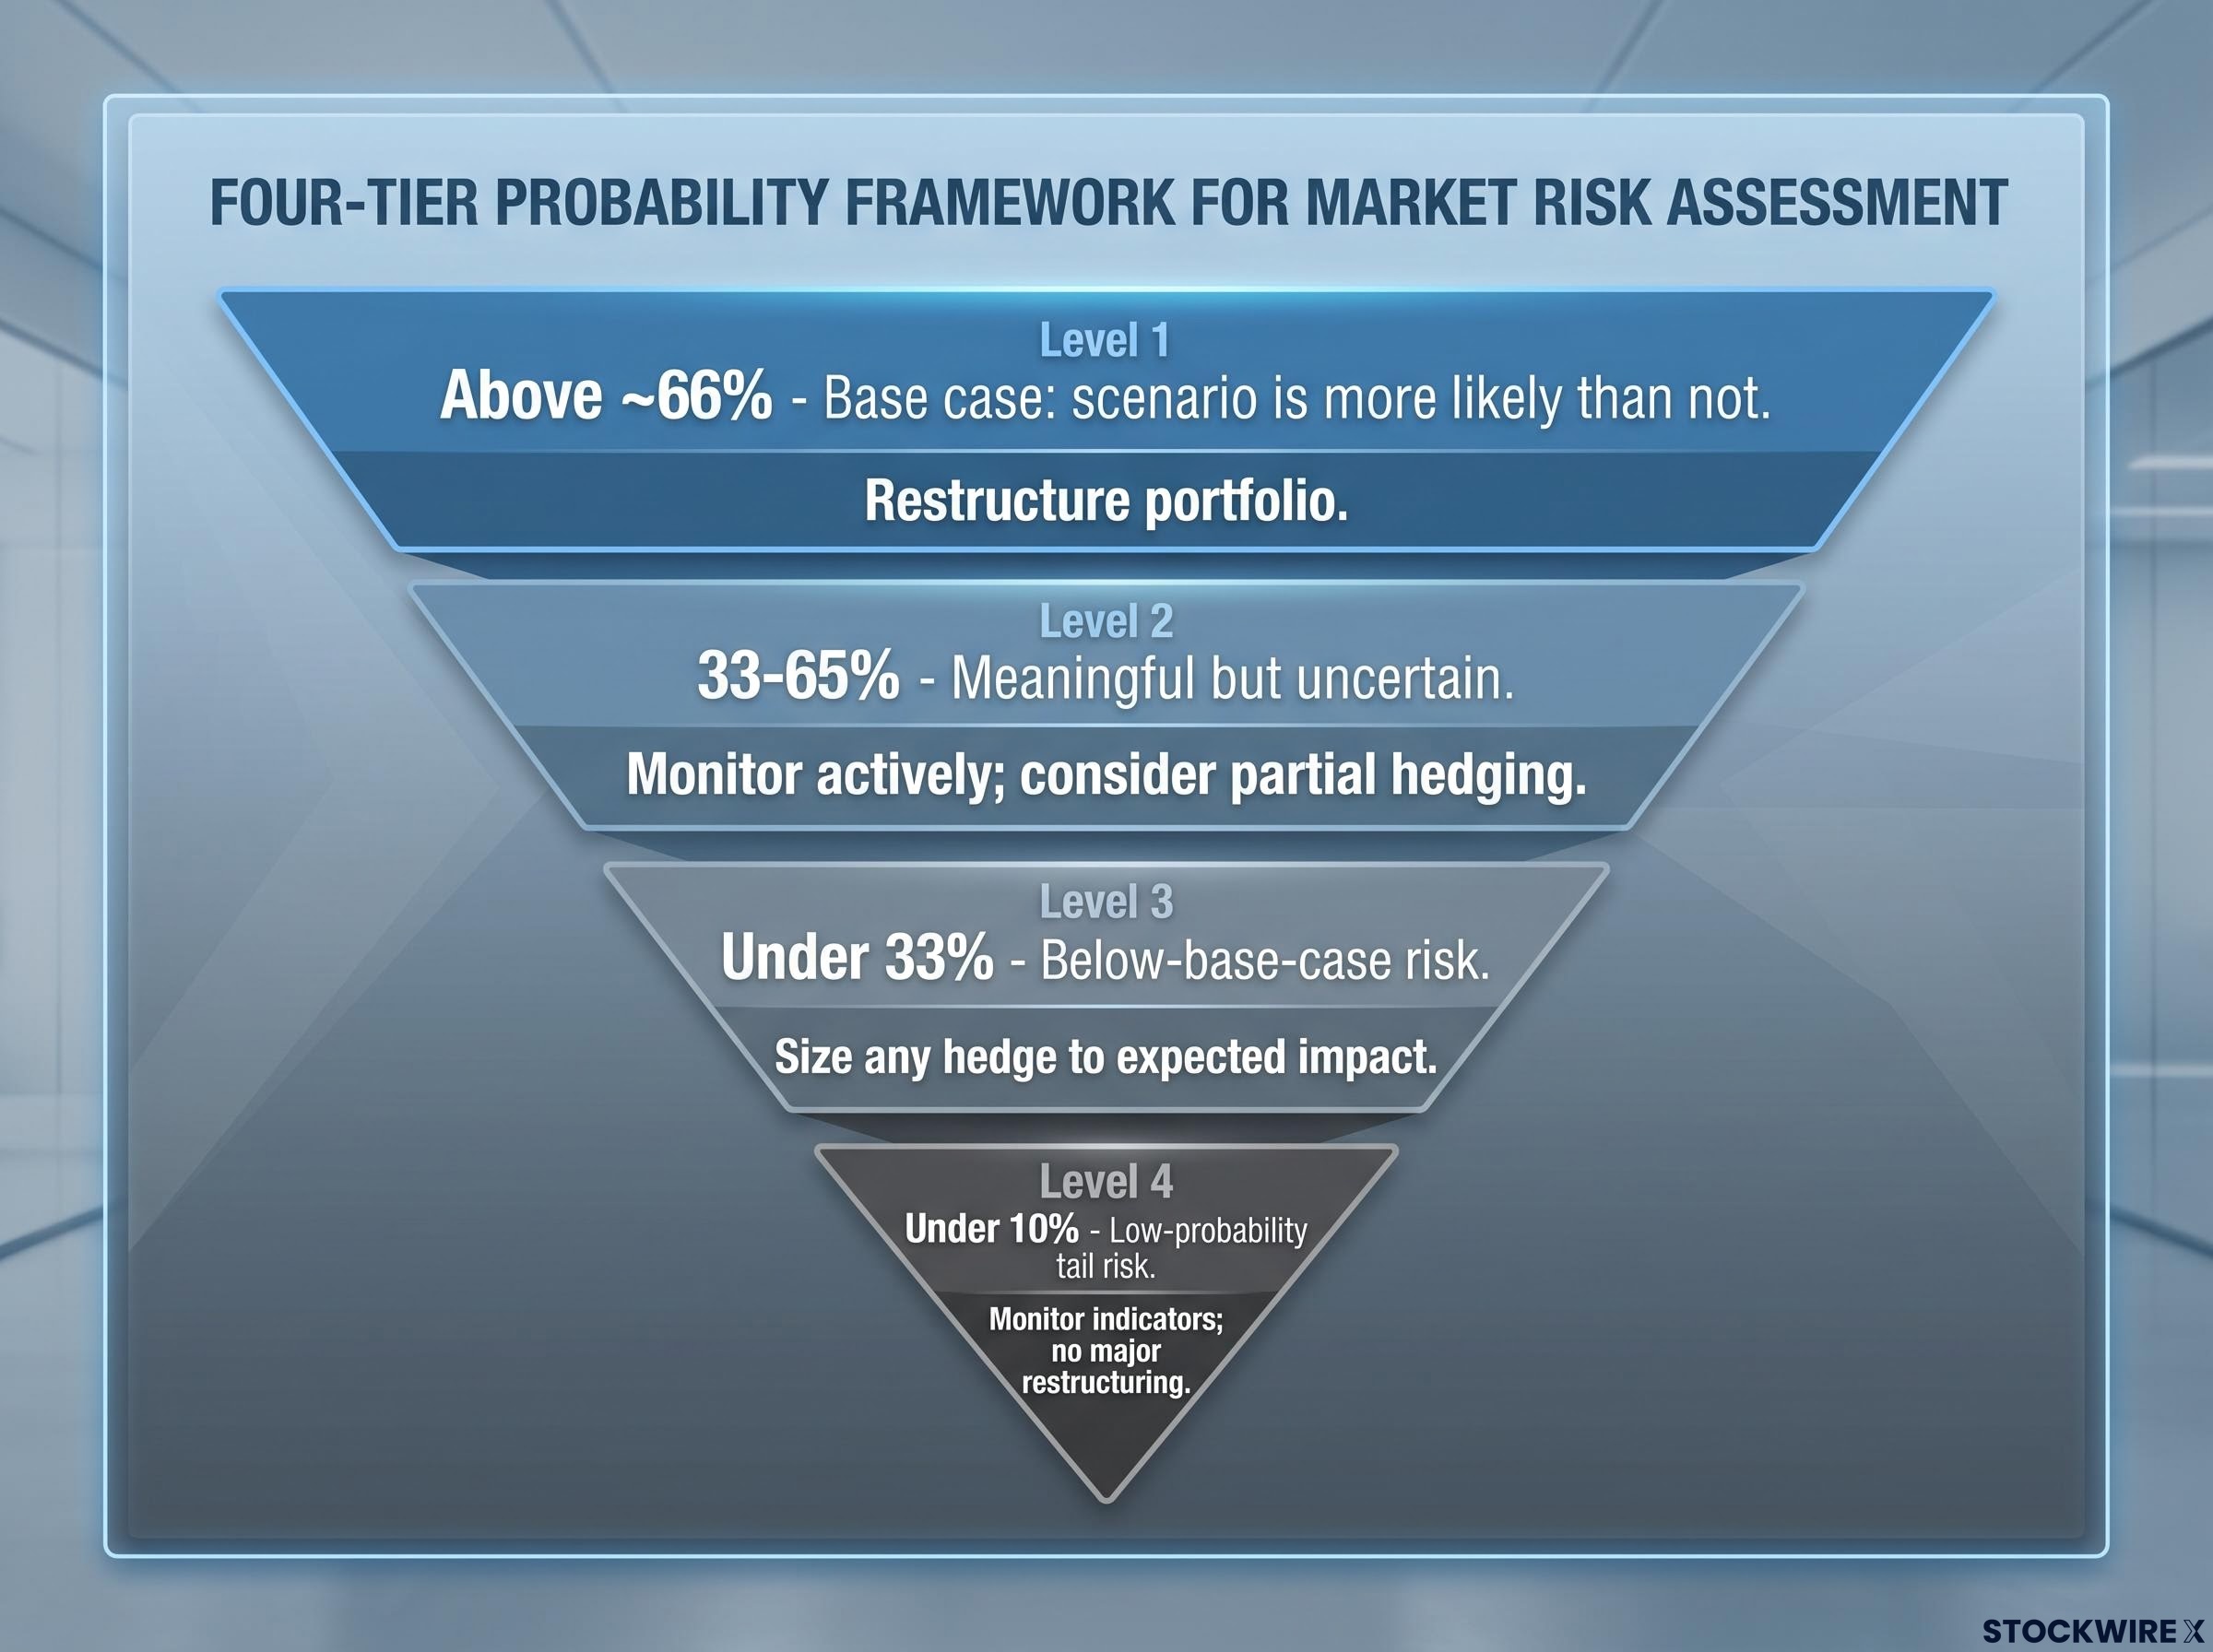
The four-tier framework below maps probability ranges to their interpretations and suggested responses.
| Probability Range | Interpretation | Suggested Response |
|---|---|---|
| Above ~66% | Base case: scenario is more likely than not | Restructure portfolio around this scenario as primary driver |
| 33-65% | Meaningful but uncertain | Monitor actively; consider partial hedging scaled to severity |
| Under 33% | Below-base-case risk | Size any hedge to expected impact, not to worst case; monitor for threshold changes |
| Under 10% (current scenarios) | Low-probability tail risk | Monitor indicators; no major restructuring unless indicators shift |
This table provides a starting architecture. It does not, on its own, capture the full picture.
The 66% threshold governs base-case portfolio design, not all hedging decisions. Expected-value logic introduces a correction: expected impact equals probability multiplied by severity, multiplied by exposure, adjusted for hedge cost and effectiveness.
A 5-10% probability of a truly catastrophic outcome can justify partial hedging even when the scenario sits well below the base-case threshold. The four scenarios below all currently sit under 10%, but their severity profiles differ, and that difference matters for sizing any hedge. A complete sovereign default and a normal sector drawdown in AI names are not equivalent events, even if both carry similar headline probabilities.
The US national debt at approximately $39 trillion generates persistent media and investor concern regardless of the probability of an actual default. That persistence is the problem. It collapses several distinct forms of risk into a single headline fear.
The under-10% probability estimate (over a 5-year horizon) applies specifically to a hard, systemic default: a formal failure to meet debt obligations that triggers a broader financial crisis. This is a narrow definition. The broader spectrum of sovereign stress carries materially higher probabilities and should not be conflated with it:
These softer forms of sovereign stress are real and are managed through standard fixed-income and inflation-hedging decisions, not through catastrophe preparation. Assigning under 10% to hard default should not be read as implying US debt is risk-free.
Monitoring indicators for US debt include CDS spreads on Treasuries, yield curve shape and term premium, foreign central bank holdings and the pace of reserve diversification, and debt ceiling negotiation timelines.
Treasury auction performance, term premium on long-dated bonds, and foreign holdings data from TIC reports are the live signals that would move a soft fiscal-stress scenario toward a harder one, and each of these indicators carries a measurable threshold at which institutional behaviour shifts from buying to reducing.
The Taiwan scenario carries an annualised probability of approximately 2-5% over the next 12 months. At roughly 2%, a military invasion is approximately 50 times more probable not to occur than to occur in any given year. This makes it the kind of risk that warrants structural awareness and indicator tracking, but not wholesale portfolio restructuring.
The distinction matters because investors often conflate any escalation in cross-strait rhetoric with an imminent invasion scenario. Monitoring indicators for Taiwan evolve over weeks and months, not hours, making systematic tracking the appropriate response rather than reactive checking. The indicators to watch include:
The pattern from the previous section reappears here. In both cases, the under-10% estimate applies to a specifically defined severe outcome, not to the broader category of disruption that headlines tend to conflate with it.
For Russia-NATO, the under-10% figure (medium-term horizon) refers to direct military engagement with NATO member states, a scenario distinct from the ongoing Russia-Ukraine conflict. The war in Ukraine carries its own set of investment implications, but those are managed through existing geopolitical diversification, not through preparing for a broader European war. Monitoring indicators include NATO eastern flank posture, escalation patterns in Ukraine (particularly strikes beyond Ukrainian territory), cyber activity against European infrastructure, and diplomatic signalling.
The AI scenario requires the most precise definition of all four. Corrections of 20-40% in AI-exposed names are entirely normal and should be expected at some point. They are not what the under-10% estimate covers. That figure (over a 3-5 year horizon) refers specifically to a 2000-style structural collapse in which the core earnings power and business models of the AI sector are broadly and persistently impaired, not merely prices reverting from elevated levels.
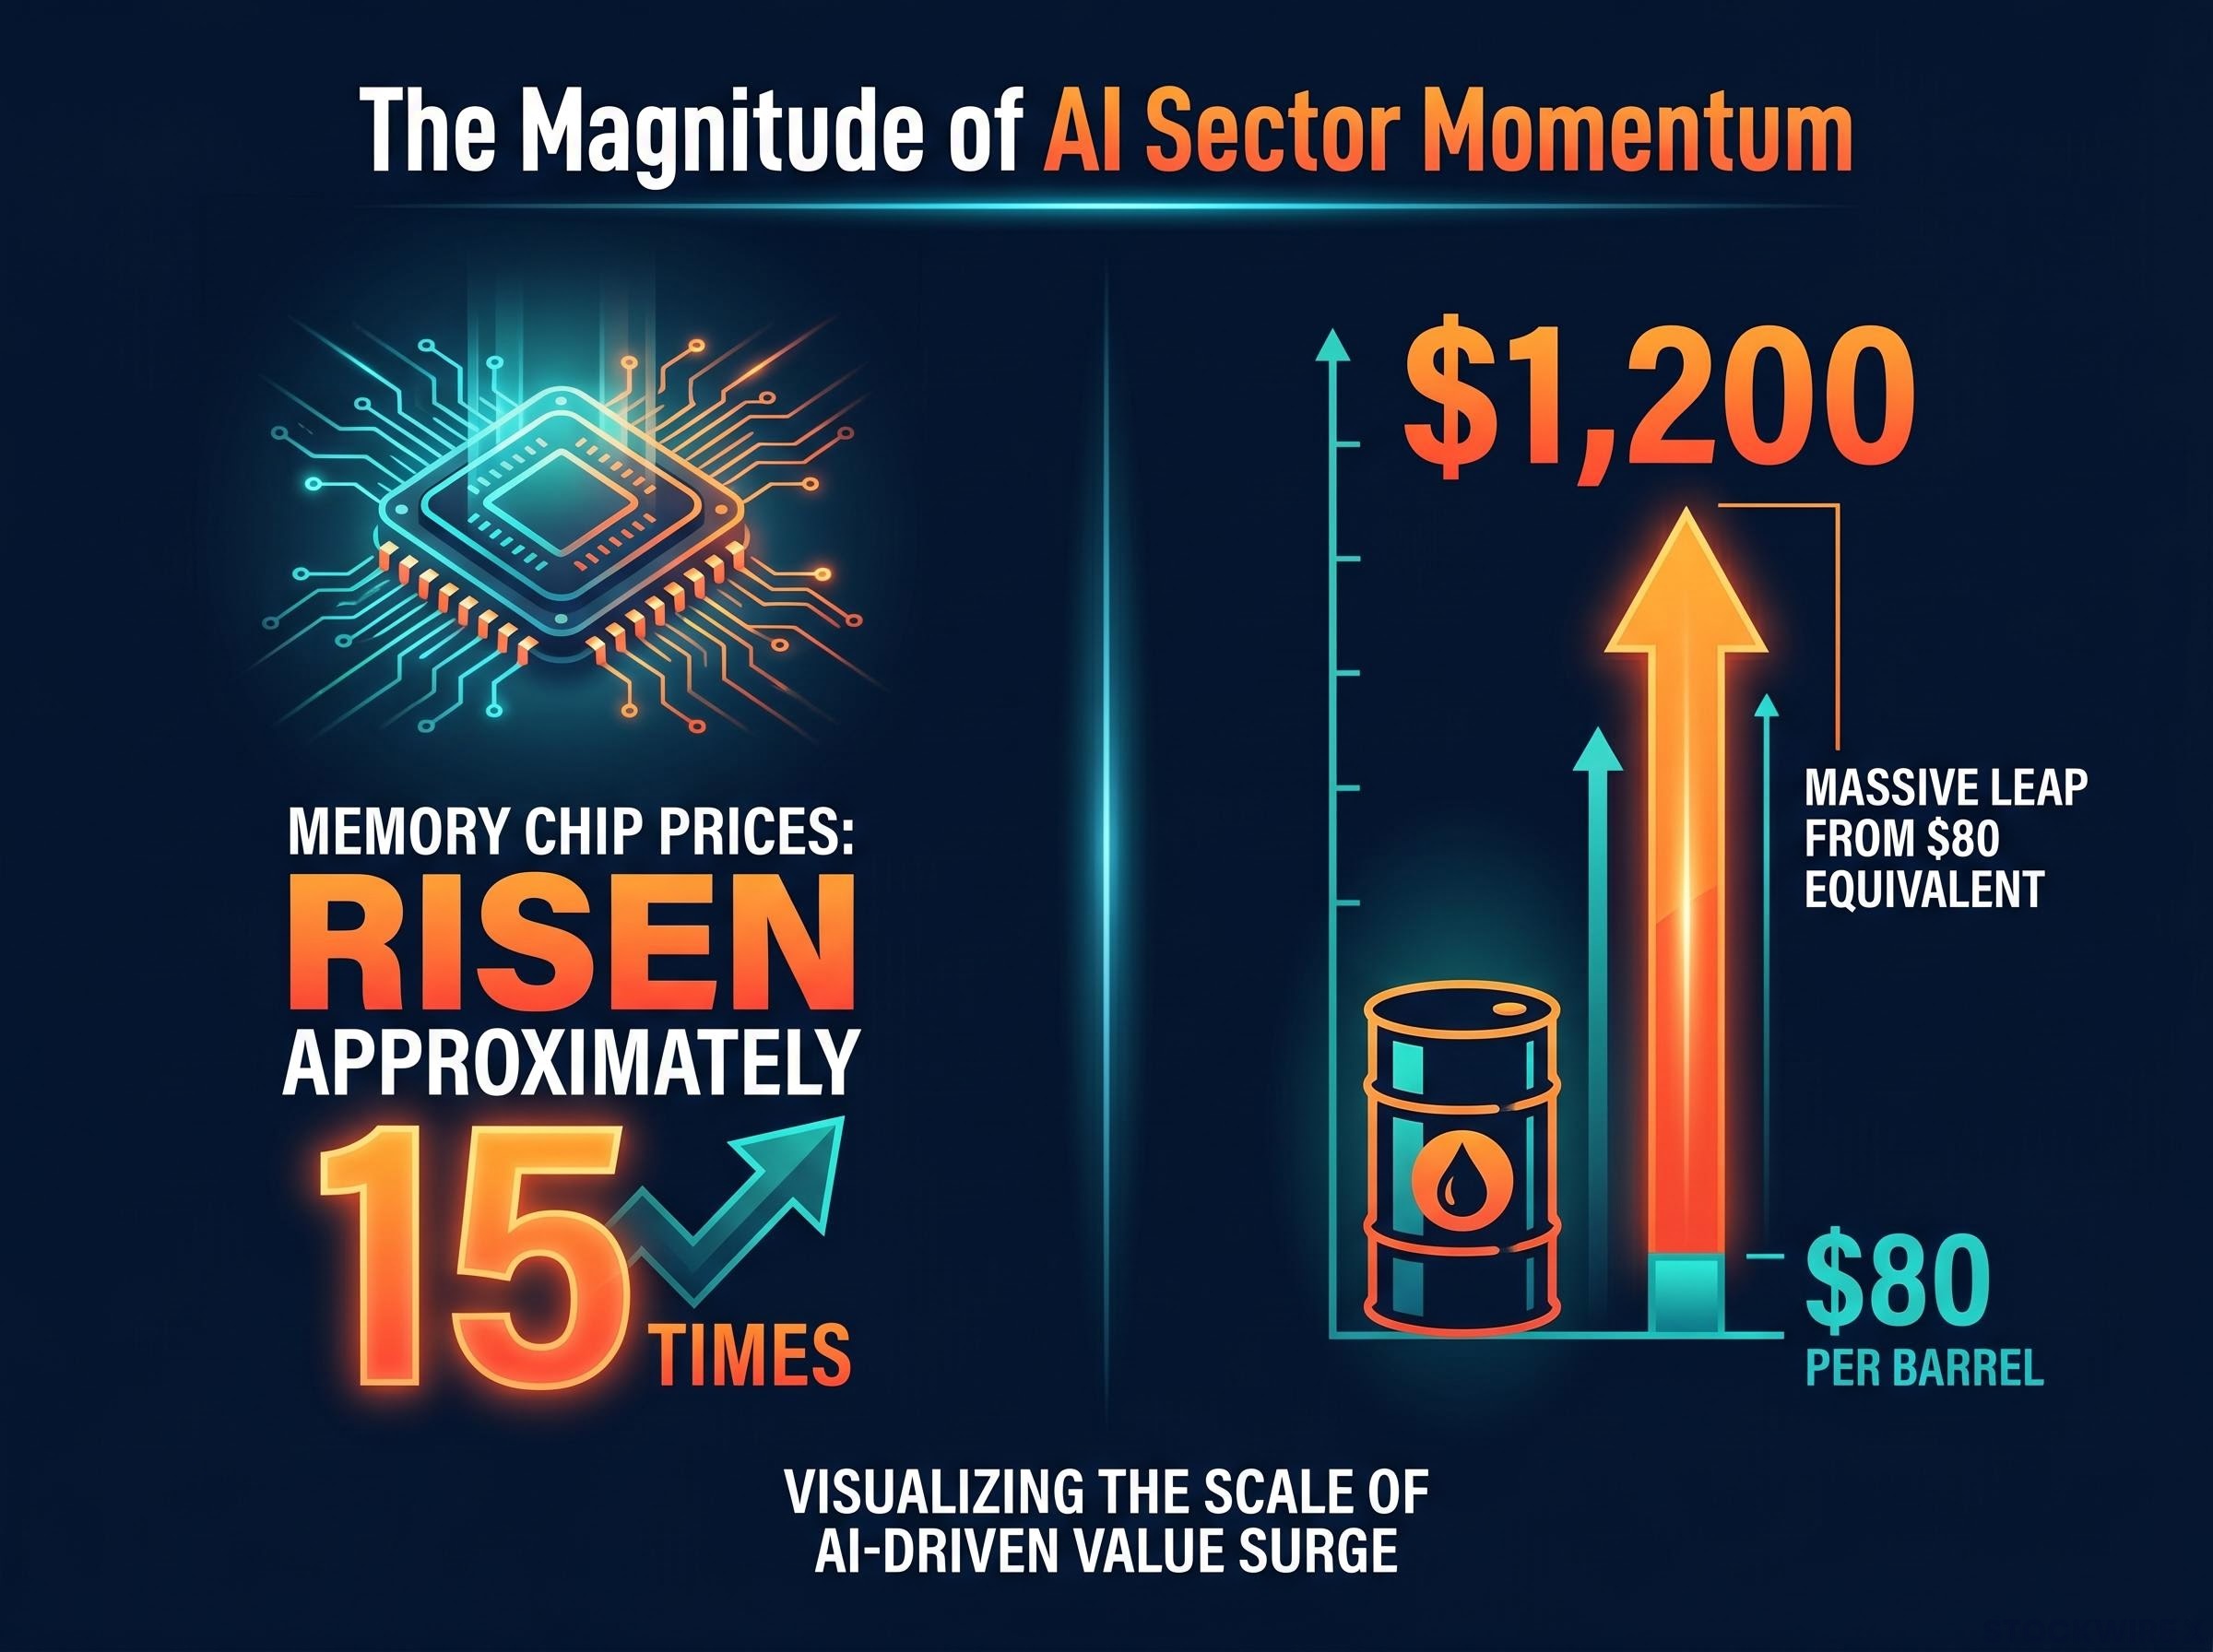
Memory chip prices have risen approximately 15 times, a magnitude equivalent to oil moving from roughly $80 per barrel to approximately $1,200. That scale of momentum illustrates both the opportunity and the concentration risk embedded in AI-driven names.
Conflating a sector drawdown with a structural collapse would cause investors to misread a normal correction as a collapse signal and exit at exactly the wrong moment. The structural signal is different from the drawdown signal, and the monitoring indicators reflect that distinction:
Investors monitoring CAPEX versus cash flow divergence are watching for the structural signal. A price decline alone, even a steep one, does not constitute it.
Systematic monitoring means tracking a defined, small set of indicators, updating probabilistic views as new information arrives, and acting only when those indicators move enough to meaningfully change the probability assessment. It does not mean daily portfolio changes. Most leading indicators for macro risks evolve over weeks and months, not hours. The goal is structural readiness to act, not reactive noise response.
The consolidated summary below provides a single-reference monitoring sheet for all four scenarios.
| Scenario | Probability Estimate | Time Horizon | Key Indicators | Suggested Action |
|---|---|---|---|---|
| US hard sovereign default | Under 10% | 5-year | CDS spreads, yield curve, foreign Treasury holdings | Monitor only; manage inflation and repression risk separately |
| China invasion of Taiwan | ~2-5% | 12-month | PLA deployments, export controls, rhetoric shifts | Monitor only; no restructuring unless indicators shift |
| Russia-NATO direct conflict | Under 10% | Medium-term | NATO posture, Ukraine escalation, cyber activity | Monitor only; existing geopolitical diversification adequate |
| AI structural collapse (2000-style) | Under 10% | 3-5 year | CAPEX vs. cash flows, credit conditions, concentration | Monitor; expect normal drawdowns without treating as collapse signal |
One dimension this table does not capture is interdependency. The four scenarios are not fully independent. A Taiwan crisis could simultaneously:
A portfolio framework treating these as four fully independent risks may underestimate tail correlation in adverse scenarios. Probability estimates can also shift nonlinearly in response to feedback effects, including sanctions, alliance shifts, technological breakthroughs, and policy changes. Regular reassessment is required, not set-and-forget monitoring.
The framework does not eliminate uncertainty. It does not claim precision in the probability estimates. It does not guarantee that low-probability events will not occur. What it does is structure how to think about them, replacing the question “should I be worried?” with “how much mental energy and portfolio capital does this scenario warrant right now?”
Portfolio holdings should only be adjusted when previously assessed conditions actually change, not in response to speculative scenarios. The monitoring system is what connects condition changes to portfolio responses.
The 66% threshold separates monitoring from restructuring. Below it, the framework asks investors to size their responses to the actual probability and severity of each risk, not to the volume of coverage it generates. Above it, the risk becomes the base case. None of the four scenarios assessed here are close to that line.
Investors who use this framework are not predicting the future. They are structuring their attention and their capital allocation around a realistic assessment of where each risk currently sits. That distinction, between prediction and structured attention, is the difference between reacting to whichever macro fear is loudest in a given week and maintaining a portfolio designed to perform across the range of outcomes that actually matter.
For investors ready to convert the probability framework into specific position-level adjustments, our dedicated guide to beta-weighted position sizing walks through how a 50/50 dollar split between a technology ETF and a utilities ETF can produce a 90/10 risk split, and includes a six-step rebalancing workflow that translates volatility targets into concrete sizing decisions.
This article is for informational purposes only and should not be considered financial advice. Investors should conduct their own research and consult with financial professionals before making investment decisions. Probability estimates presented here are working tools for structuring decision-making, not precise quantitative forecasts. Past performance does not guarantee future results.
Market risk assessment is the process of evaluating the likelihood and potential impact of adverse scenarios on a portfolio. Investors use it to decide whether a given risk justifies portfolio restructuring, partial hedging, or simply systematic monitoring based on probability estimates anchored to a specific time horizon.
The framework presented uses a threshold of approximately 66% probability, the point at which a scenario is roughly twice as likely to occur as not. Below that level, the appropriate response shifts from wholesale restructuring to sized hedging or monitoring, depending on the severity of the potential outcome.
A normal AI sector correction of 20-40% reflects prices reverting from elevated levels and is entirely expected at some point. A structural collapse, assigned under 10% probability over a 3-5 year horizon, refers specifically to a 2000-style impairment of core earnings power and business models across the AI sector, not merely a price decline.
The Taiwan invasion scenario carries an annualised probability of approximately 2-5% over 12 months, making systematic indicator tracking the appropriate response rather than reactive portfolio changes. Key indicators to watch include PLA troop and naval deployments, sanctions and export control escalations, shifts in official rhetoric, and US military posture in the Indo-Pacific.
The under-10% probability estimate applies specifically to a hard, systemic default where the US formally fails to meet debt obligations and triggers a broader financial crisis. Softer forms of sovereign stress, including inflationary erosion, financial repression, and gradual reserve currency erosion, carry materially different probabilities and are managed through standard fixed-income and inflation-hedging decisions rather than catastrophe preparation.