Apple’s AI Bet Is a Services Play, Not an iPhone Supercycle
3 hrs ago

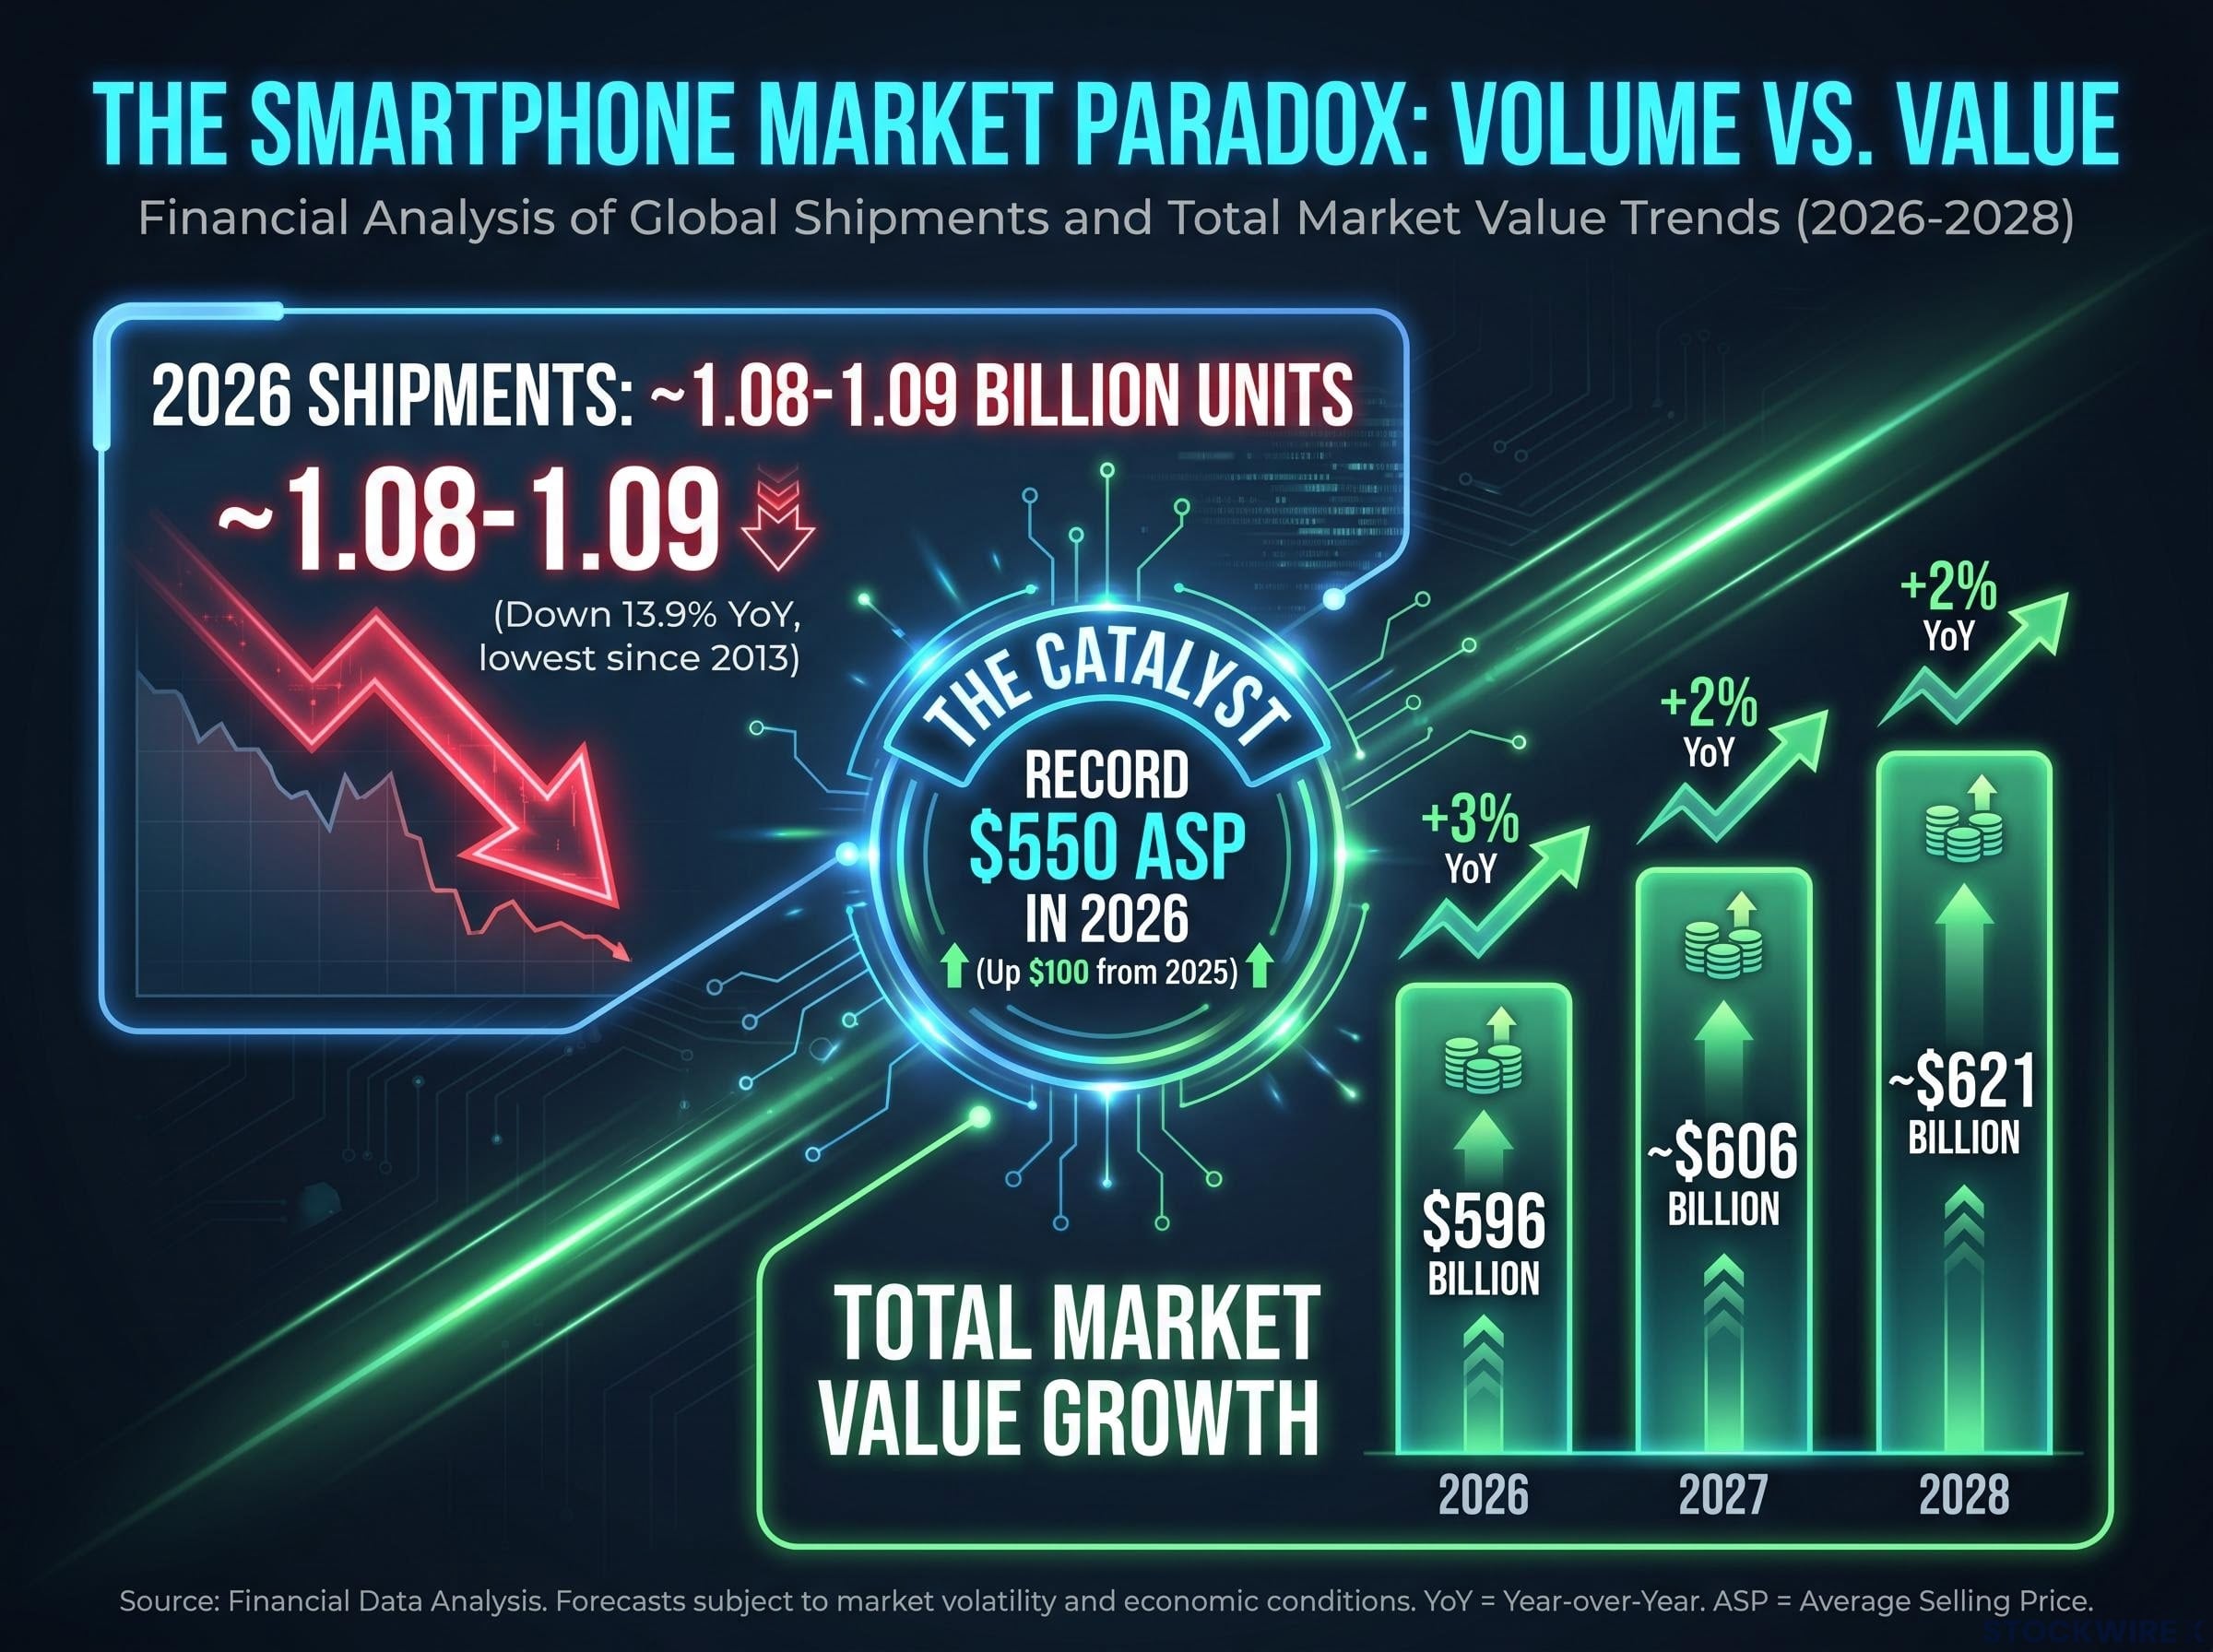
Global smartphone shipments are on track to fall to roughly 1.08 billion units in 2026, the lowest level since 2013. Yet the market’s total value is set to climb to $621 billion by 2028. The contradiction is not a data error. It is the single most important structural signal in consumer technology hardware right now, and it resolves only when the market is examined not as one number but as three distinct tiers moving in opposite directions.
This analysis maps the divergence across price tiers, quantifies the foldable category’s revised but still compelling growth trajectory, and identifies which positions in the smartphone supply chain and device ecosystem stand to benefit, or suffer, as the split between volume and value deepens. For investors and analysts still treating “smartphone market revenue” as a homogeneous figure, the framework that follows is a corrective.
The headline numbers should not coexist. Unit shipments in 2026 are forecast to fall approximately 13.9% year-over-year to roughly 1.08-1.09 billion units, a volume last seen more than a decade ago. At the same time, total market value is projected to reach $596 billion in 2026 (a 3% year-over-year increase), rising to approximately $606 billion in 2027 and approximately $621 billion in 2028.
The Counterpoint Research shipment forecast for 2026 characterises the decline as the worst annual contraction on record, attributing the steeper-than-expected fall to converging memory cost pressures and geopolitical supply chain disruptions rather than purely cyclical demand softness.
The mechanism bridging these two figures is a single metric: average selling price.
A record average selling price of approximately $550 in 2026, up $100 from 2025, is doing the work that volume growth no longer can.
That $100 ASP increase, driven by consumer migration toward premium devices and rising component costs, more than offsets the volume decline at the revenue level. The market is not growing. It is repricing.
Apple’s Q1 2026 results are the clearest live illustration of this dynamic, with premium market share gains of approximately 5% in global shipments recorded while the overall market contracted 6%, a divergence that maps directly onto the structural tier split this analysis describes.
| Year | Total market value | Unit shipment direction |
|---|---|---|
| 2026 | $596 billion (+3% YoY) | Declining (~1.08-1.09 billion units) |
| 2027 | ~$606 billion (+2% YoY) | Stabilising |
| 2028 | ~$621 billion (+2% YoY) | Stabilising |
The analytical implication is direct: aggregate revenue figures mask a structural reorganisation. The useful lens for evaluating any company’s smartphone exposure is price-tier positioning, not market-level totals.
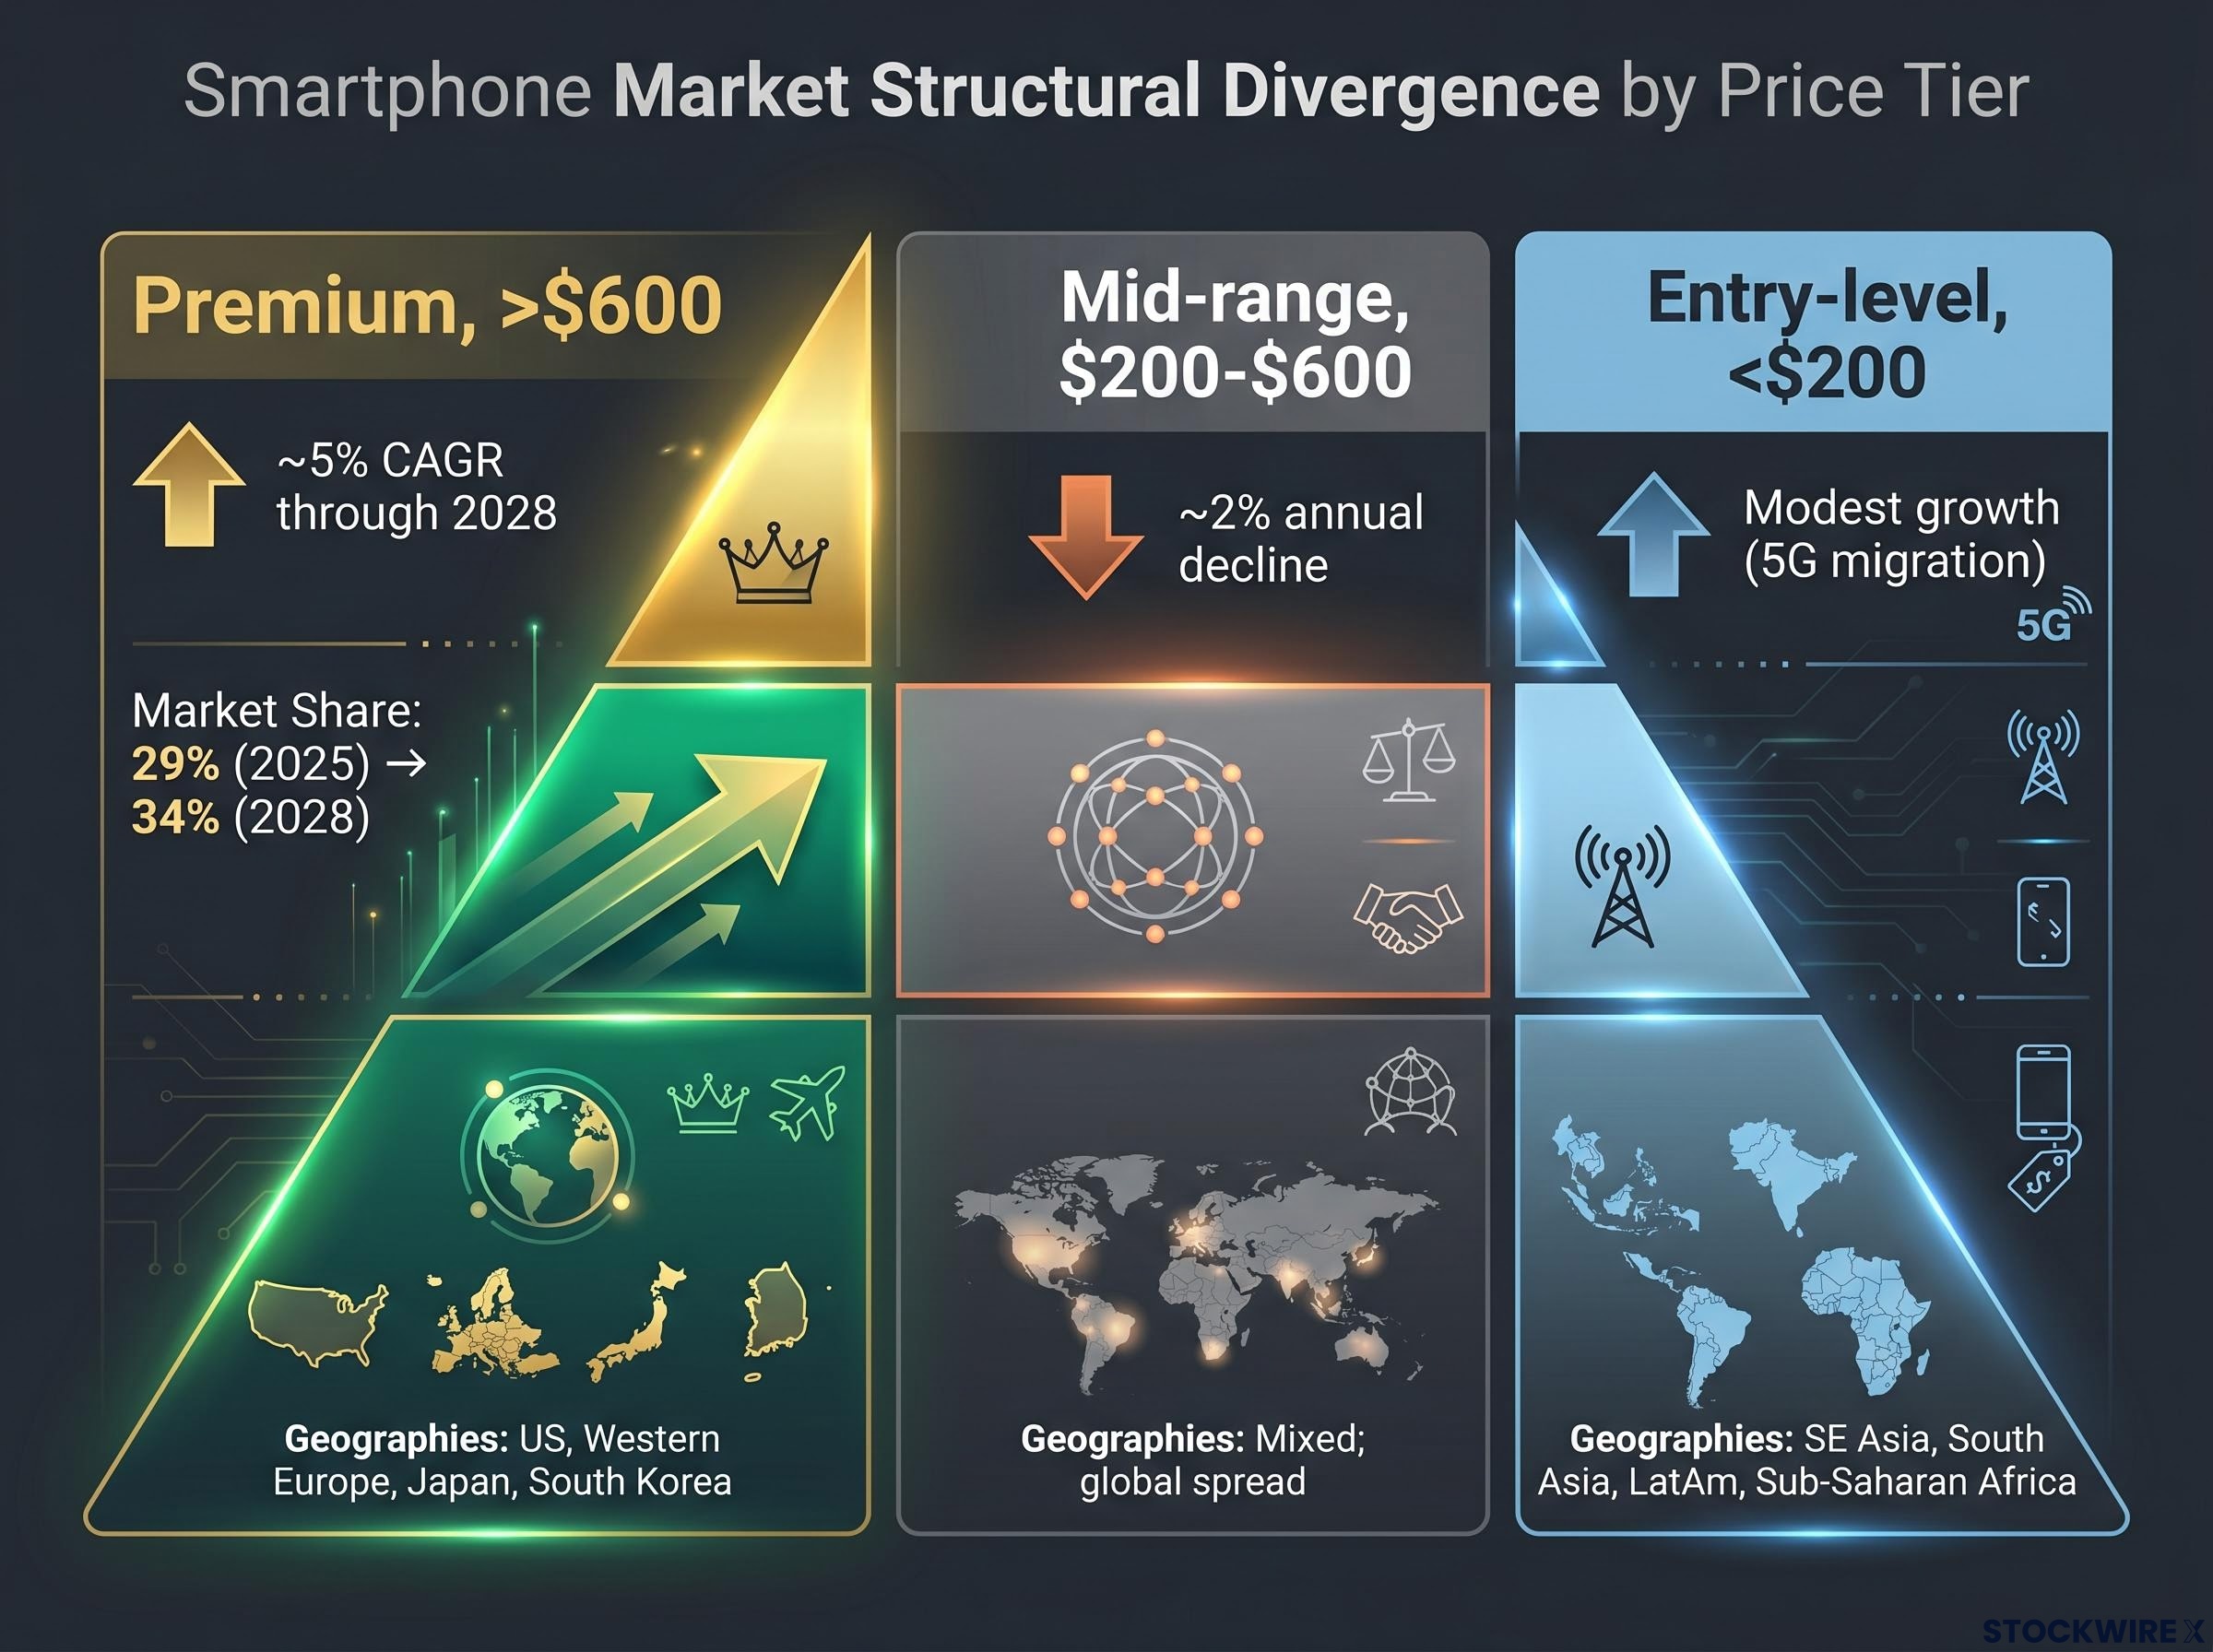
According to Goldman Sachs, smartphones priced above $600 are projected to expand at a compound annual growth rate of approximately 5% through 2028, reaching roughly 402 million units. The premium segment’s share of total shipments is estimated to rise from 29% in 2025 to 34% by 2028.
That growth rate, in a market where overall volumes are contracting, is not incidental. It is sustained by structural forces that reinforce one another:
The premium tier’s volume is not evenly distributed. The United States, Western Europe, Japan, and South Korea account for a disproportionate share of premium device purchases relative to their share of global shipments. These markets deliver outsized revenue per unit.
The investment implication is straightforward. Companies with revenue weighted toward these geographies carry a structural premium-tier tailwind absent from globally diversified or emerging-market-heavy peers. The geographic skew compounds the segment-level advantage.
Apple’s fiscal Q2 2026 earnings showed exactly how this repricing plays out at the company level: record revenue in a declining market, with iPhone revenue up 21.7% year on year, demonstrating that a business anchored in the premium tier can post expanding totals while the volume base it sits within shrinks.
The mid-range segment, covering devices priced between $200 and $600, occupies the worst structural position in the market. Goldman Sachs projected this tier to decline at approximately 2% per year. Two forces drive the contraction. Macro caution is extending replacement cycles as consumers in this band grow more conservative. And feature trickle-down has narrowed the perceived gap between a capable older device and a new one, dulling upgrade urgency.
Strategically, the mid-range is neither inexpensive enough to capture emerging-market volume growth nor premium enough to benefit from aspirational spending and high margins. It is squeezed from both directions with limited pricing power.
Entry-level devices (priced below $200) present a different problem. Volume is supported by the ongoing 4G-to-5G migration across Southeast Asia, South Asia, Latin America, and Sub-Saharan Africa. But this segment is the most exposed to rising DRAM and NAND memory costs. Buyers at this price point are extremely price-sensitive, and OEMs face a binary choice: absorb cost inflation into already thin margins, or pass costs through and risk destroying demand.
The distinction matters for portfolio positioning. Mid-range risk is primarily volume erosion. Entry-level risk is margin destruction. Both warrant underweighting, but for different analytical reasons.
| Tier | Volume trajectory | Pricing power | Primary risk | Geographic centre |
|---|---|---|---|---|
| Premium (>$600) | ~5% CAGR through 2028 | Strong | Saturation in developed markets | US, Western Europe, Japan, South Korea |
| Mid-range ($200-$600) | ~2% annual decline | Weak | Volume erosion, cycle extension | Mixed; global spread |
| Entry-level (<$200) | Modest growth (5G migration) | Minimal | Margin compression from memory costs | SE Asia, South Asia, LatAm, Sub-Saharan Africa |
The initial instinct should be scepticism. Goldman Sachs reduced its foldable shipment projections by 10% for 2026 and 7% for 2027, acknowledging slower initial adoption and pricing constraints. The hype cycle for foldables has outpaced the adoption curve.
The revisions, however, trimmed the pace, not the direction. The medium-term trajectory remains strongly positive:
| Year | Foldable units | Penetration of total shipments |
|---|---|---|
| 2026 | ~41 million | 3.6% |
| 2027 | ~69 million | 5.9% |
| 2028 | ~80 million | 6.8% |
Three catalysts are expected from late 2026 onward. New OEM entrants are expanding form-factor variety and exerting downward pressure on entry pricing within the premium band. Tri-fold hardware is introducing genuine novelty capable of resetting consumer interest. And Apple’s anticipated first foldable device, potentially launching in September 2026, could serve as the category’s legitimacy inflection point.
Apple’s anticipated entry into the foldable category in late 2026 is widely viewed as the inflection point that converts foldables from an enthusiast segment into a mainstream premium category.
For investors, foldables represent a fast-growing niche inside the premium layer with above-market unit growth rates, a source of upside for specialised supply-chain players (flexible OLED vendors, hinge and mechanical-system providers, and materials specialists) regardless of which OEM captures headline market share. All foldable forecasts remain forward-looking projections subject to revision as launch timelines and adoption data become available.
Investors exploring the investment implications of Apple’s foldable entry in more depth will find our deep-dive into Apple’s foldable value share thesis, which examines Citi’s projection that Apple is expected to capture 34% value share versus 22% unit share in foldables during its first year, along with the replacement cycle data and 2027-2028 financial signal windows that frame the multi-year horizon for this category.
The market-level repricing story translates unevenly at the company level. The same headline revenue growth figure can mean structurally opposite things for two businesses in the smartphone ecosystem, depending on where in the price stack their revenues are anchored.
The structurally favoured positions share a common feature: they capture rising value per device.
Advanced chip supply concentration is itself a supply chain risk that premium-tier investors must model separately from component pricing: Apple’s early-stage discussions with Samsung Foundry and Intel Foundry Services over US-based manufacturing illustrate how geopolitical exposure at the leading-edge node level can create a second-order risk layer for companies and their suppliers that does not appear in standard segment analysis.
The structurally disadvantaged positions are tied to volume. Commodity component suppliers in mid-range and low-end bands face converging pressures. Licensing or per-device fee models tied to unit activations rather than average revenue per user are particularly exposed. OEMs competing primarily on price rather than ecosystem differentiation face the sharpest margin compression as memory costs rise.
The analytical framework for evaluating any smartphone-exposed position follows three steps:
DRAM and NAND cost inflation disproportionately affects entry-level and mid-range OEMs, while premium OEMs can absorb or pass through increases. The premium segment’s expansion from 29% to 34% of total shipments by 2028 widens the addressable market for premium-tier suppliers while narrowing it for volume-dependent players.
Aggregate revenue and aggregate unit figures are insufficient analytical inputs. They systematically obscure where value is concentrating and where it is eroding. A market growing 2-3% annually in revenue while contracting 14% in units is not a stable market with modest growth. It is a market undergoing structural recomposition, and anyone using the aggregate figure as a denominator is mispricing exposure.
The correct decomposition follows the same three-step framework applied throughout this analysis: tier exposure, sensitivity mapping, and business model screening.
Foldable penetration growth from 3.6% to 6.8% over 2026-2028 is precisely the kind of fast-moving sub-segment that aggregate figures do not capture. The premium share trajectory from 29% to 34% confirms the structural shift has years to run, not months.
Total market value growth through 2028 is real. But it is not uniformly distributed. It is captured by a narrowing set of positions at the top of the price stack and in the foldable sub-segment, while mid-range volumes erode and entry-level margins compress.
The quantified divergence is stark: a premium CAGR of approximately 5% versus a mid-range annual decline of approximately 2%, with foldable penetration reaching 6.8% by 2028 as an emerging premium-tier growth driver.
Based on current Goldman Sachs projections, the volume-versus-value divergence is expected to continue through 2028, offering investors a multi-year structural thesis rather than a short-cycle trade.
In a market where the average device is worth more but fewer are sold, the analytical question is not whether smartphones are growing but where inside the market value is being created.
Exposure to “smartphones” is meaningless. Exposure to the right slice of smartphones is what separates structural winners from structural losers in the supply chain and device ecosystem.
This article is for informational purposes only and should not be considered financial advice. Investors should conduct their own research and consult with financial professionals before making investment decisions. All projections cited are forward-looking estimates from Goldman Sachs and are subject to change based on market developments, geopolitical conditions, and company performance. Past performance does not guarantee future results.
Average selling price is the mean revenue generated per smartphone unit sold. In the current market, ASP is the critical metric because it explains how total market value can grow to $596 billion in 2026 even as shipment volumes fall to their lowest level since 2013, with the record ASP of approximately $550 doing the work that volume growth no longer can.
The divergence is driven by consumers trading up to premium devices priced above $600, which are growing at roughly 5% CAGR through 2028, while mid-range and entry-level volumes contract. The $100 increase in average selling price between 2025 and 2026 more than offsets the roughly 14% decline in unit shipments at the revenue level.
Goldman Sachs projects foldable shipments to grow from approximately 41 million units in 2026 to around 80 million units by 2028, representing a rise in penetration from 3.6% to 6.8% of total shipments, with Apple's anticipated first foldable device in late 2026 viewed as a potential inflection point for mainstream adoption.
The premium tier (devices priced above $600) holds the strongest structural position, with approximately 5% CAGR through 2028 and share of total shipments rising from 29% to 34%, benefiting suppliers of advanced chipsets, flagship camera modules, high-density memory, and flexible OLED displays.
The article recommends a three-step framework: first, identify which price tier and form factor the company serves; second, assess sensitivity to ASP changes and memory cost cycles; and third, determine whether the business model captures rising value per device or depends on aggregate unit volume growth.