Why Buffett Only Needed 5 Great Opportunities in 60 Years
11 hrs ago
Most investors can recite a stock’s price-to-earnings ratio before they can say whether the company behind it holds more assets than it owes in debt. That gap is precisely what a balance sheet closes. For Australian retail investors analysing ASX-listed companies, the balance sheet is the single most important financial statement for understanding what a business is actually worth, independent of what the market prices it at on any given trading day. With ASX corporate filings freely accessible through the ASX Announcements Platform, the raw material for this analysis is already available to every investor. This guide walks through every section of a balance sheet, explains three derived ratios that convert raw figures into investment signals, and grounds each concept in real ASX company examples so the framework is immediately applicable to due diligence.
The most common misunderstanding about a balance sheet is treating it like a moving picture of the business. It is not. A balance sheet is a snapshot at a single point in time, capturing what a company owns and what it owes on one specific date. That distinction matters because a strong snapshot can mask a deteriorating trend, and a weak one can obscure a recovery already underway.
The question a balance sheet answers is straightforward: what does this company own, and what does it owe? It cannot, on its own, answer whether the company is generating cash or burning through it. That requires the cash flow statement. Getting this boundary right from the start prevents the most common investor error: drawing conclusions about a company’s health from one figure on one date.
Every balance sheet is governed by one equation:
Assets = Liabilities + Equity
In plain terms: everything a company owns is funded either by money it owes to others (liabilities) or money that belongs to shareholders (equity). The two sides must always balance.
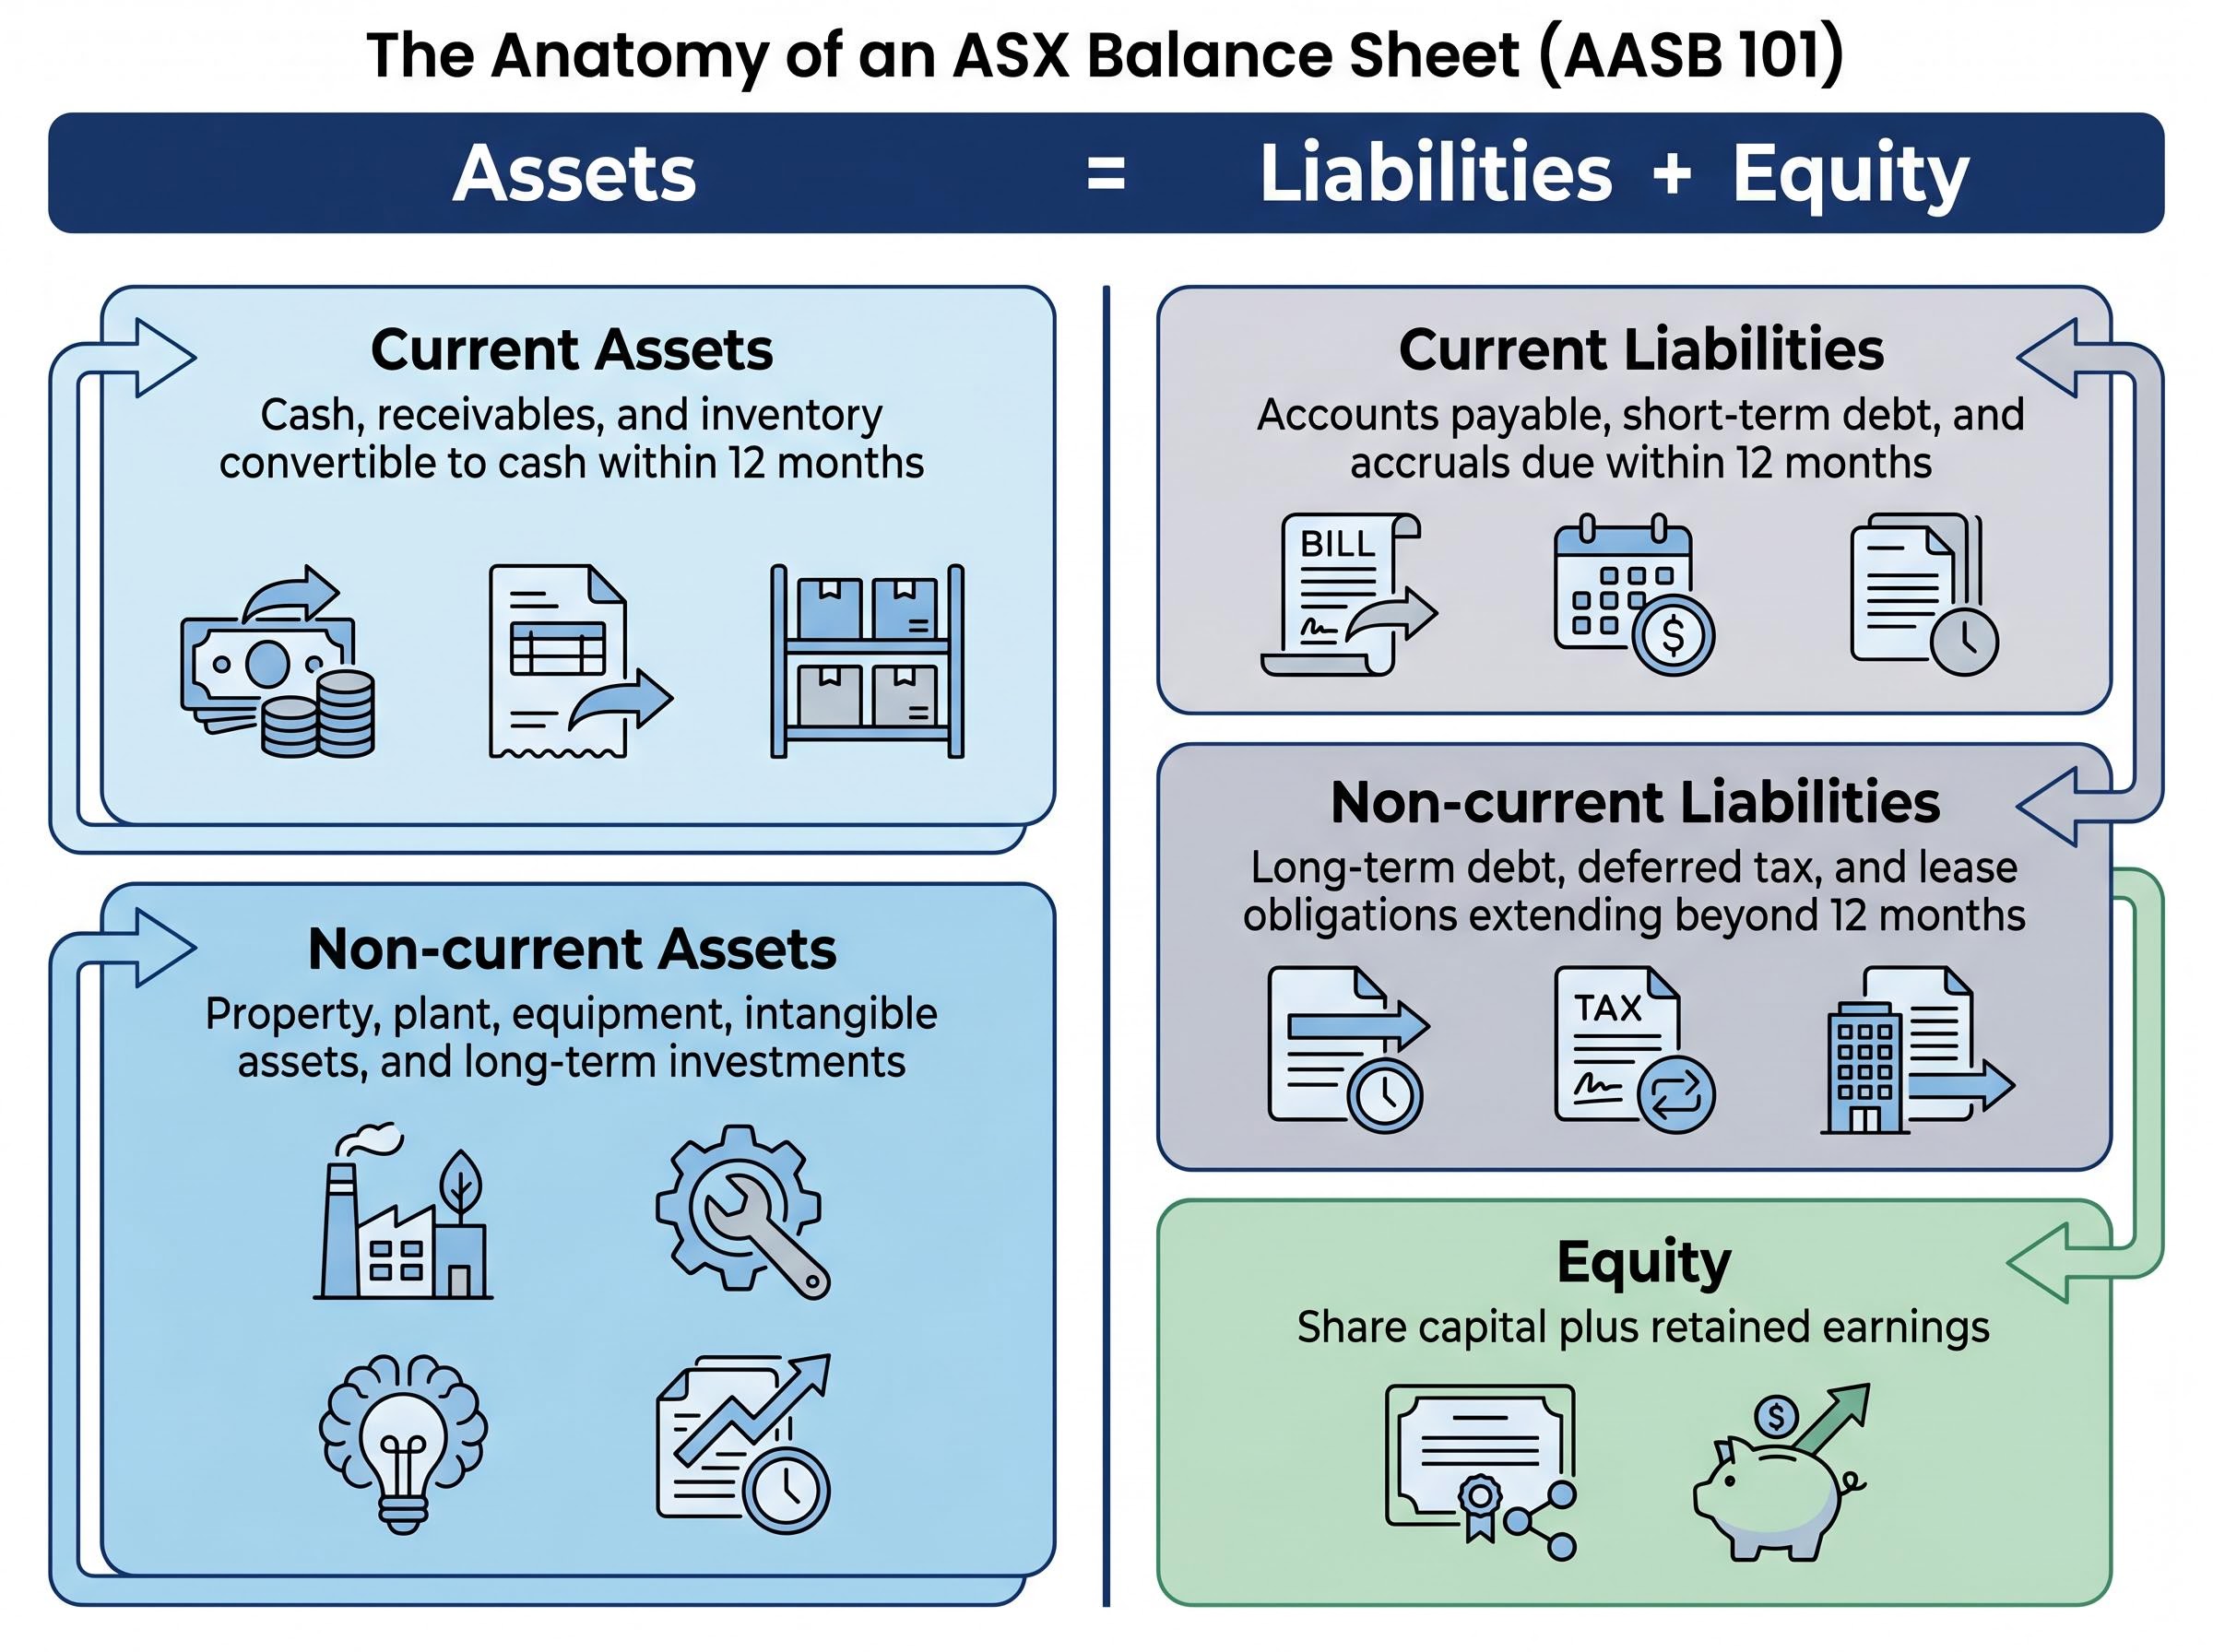
In Australia, balance sheet presentation follows AASB 101 (Presentation of Financial Statements), which aligns with international IFRS standards. ASX-listed companies publish balance sheets in both annual reports and half-year reports, all freely accessible via the ASX Announcements Platform.
The AASB 101 presentation requirements mandate the minimum structure and content of general-purpose financial statements for Australian entities, establishing the classification rules that determine which assets and liabilities are presented as current versus non-current on any ASX balance sheet.
A balance sheet organises information into five categories, grouped under three broad headings. The following table provides a reference map before examining each layer in detail.
| Section | What it contains |
|---|---|
| Current assets | Cash, receivables, and inventory convertible to cash within 12 months |
| Non-current assets | Property, plant, equipment, intangible assets, and long-term investments |
| Current liabilities | Accounts payable, short-term debt, and accruals due within 12 months |
| Non-current liabilities | Long-term debt, deferred tax, and lease obligations extending beyond 12 months |
| Equity | Share capital plus retained earnings: the residual value belonging to shareholders |
Current assets sit at the top of the balance sheet and include cash and equivalents, trade receivables (money owed to the company by customers), and inventory. These are items convertible to cash within 12 months, and their total is the first input for calculating liquidity.
Non-current assets appear below. For a company like BHP Group (ASX: BHP), this category is dominated by property, plant, and equipment, the mining infrastructure that generates revenue over decades. Intangible assets and goodwill also sit here, particularly for acquisitive companies, and warrant separate scrutiny because they can be written down if an acquisition fails to deliver expected value.
Current liabilities mirror current assets in their 12-month threshold. They include accounts payable, short-term debt, and accrued expenses. Non-current liabilities cover long-term debt and lease obligations. Under AASB 16, lease liabilities now appear on the balance sheet for retail and infrastructure companies, a change that can materially inflate apparent leverage for businesses that lease rather than own premises.
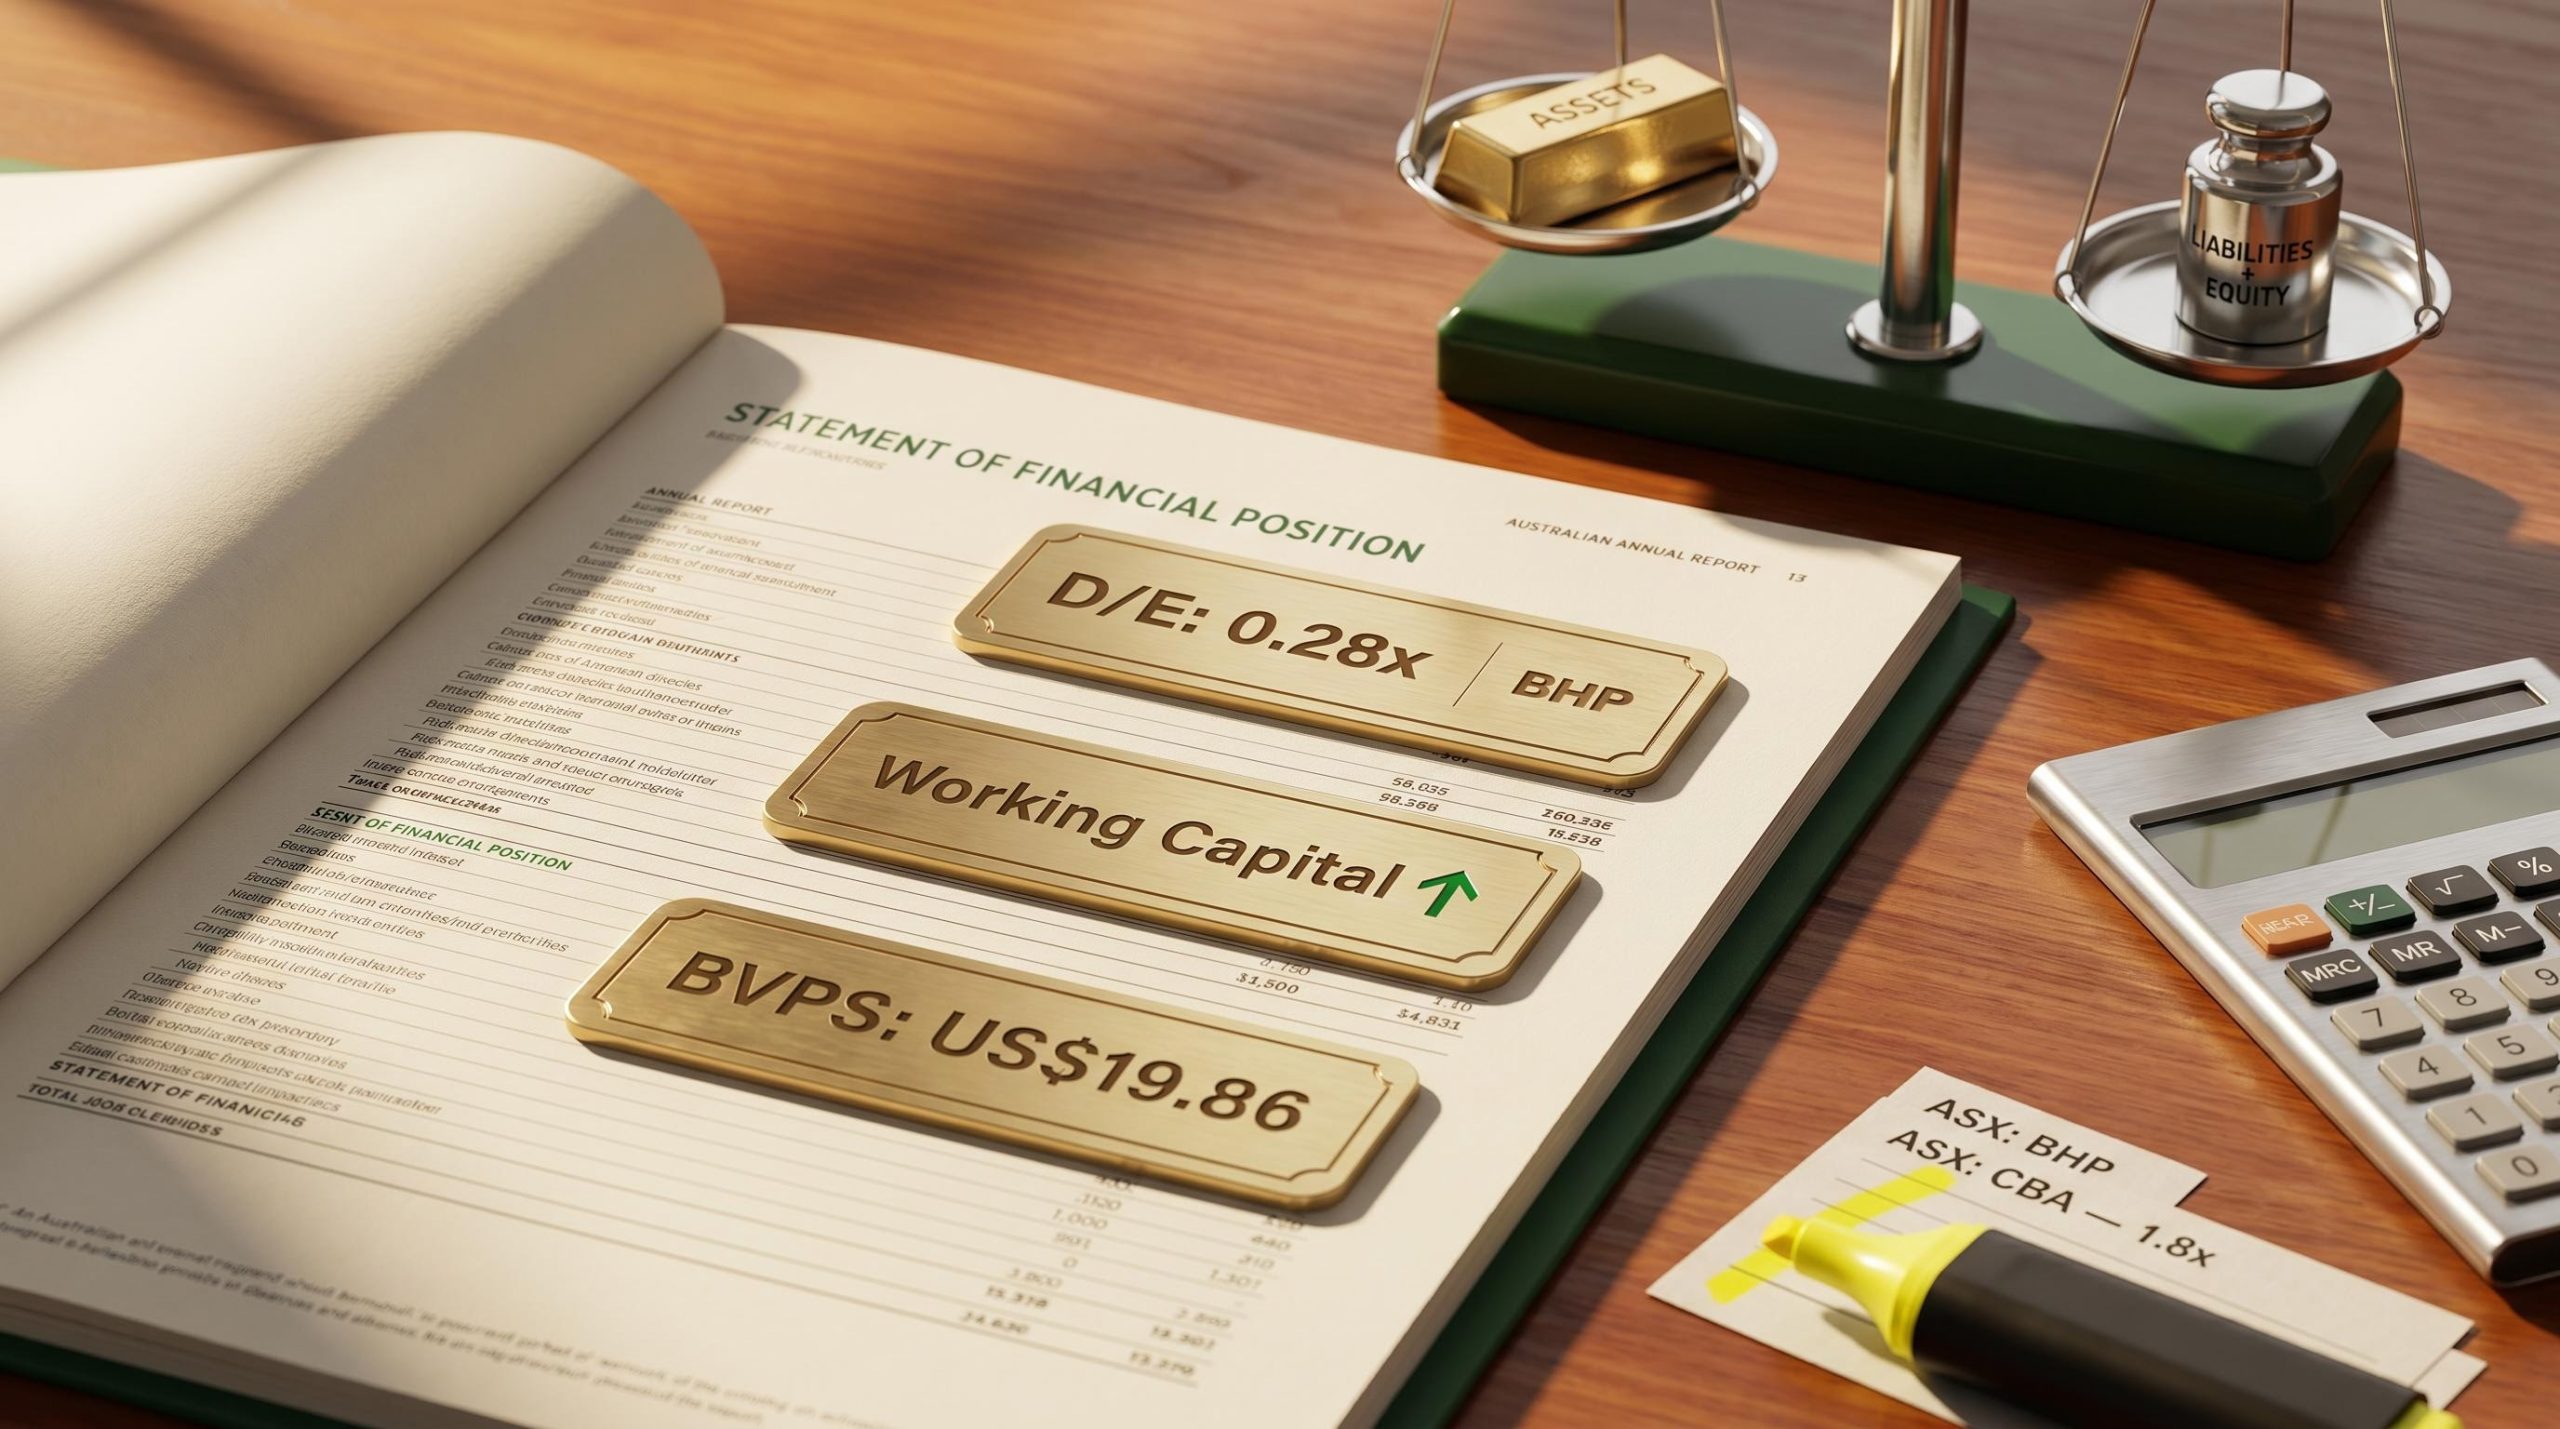
Equity is what remains after subtracting total liabilities from total assets. Its two primary components are share capital (the money raised by issuing shares) and retained earnings (the accumulated record of profits reinvested in the business rather than paid as dividends). BHP’s FY2024 balance sheet illustrates this structure clearly: approximately US$9.1 billion in net debt alongside a debt-to-equity ratio of approximately 0.28x, reflecting a well-capitalised equity position relative to the mining sector.
Reading a balance sheet is one skill. Using it is another. Three calculations convert line items into numbers that can be compared across time, across peers, and across sectors.
Working capital measures short-term liquidity. A positive result means the company can cover its near-term obligations from near-term assets. A negative result signals potential strain. Pilbara Minerals (ASX: PLS) illustrated this directly in its 1H FY2025 half-year report, where working capital moved into negative territory following the lithium price crash, a real-world consequence of deteriorating short-term liquidity in a commodity downturn.
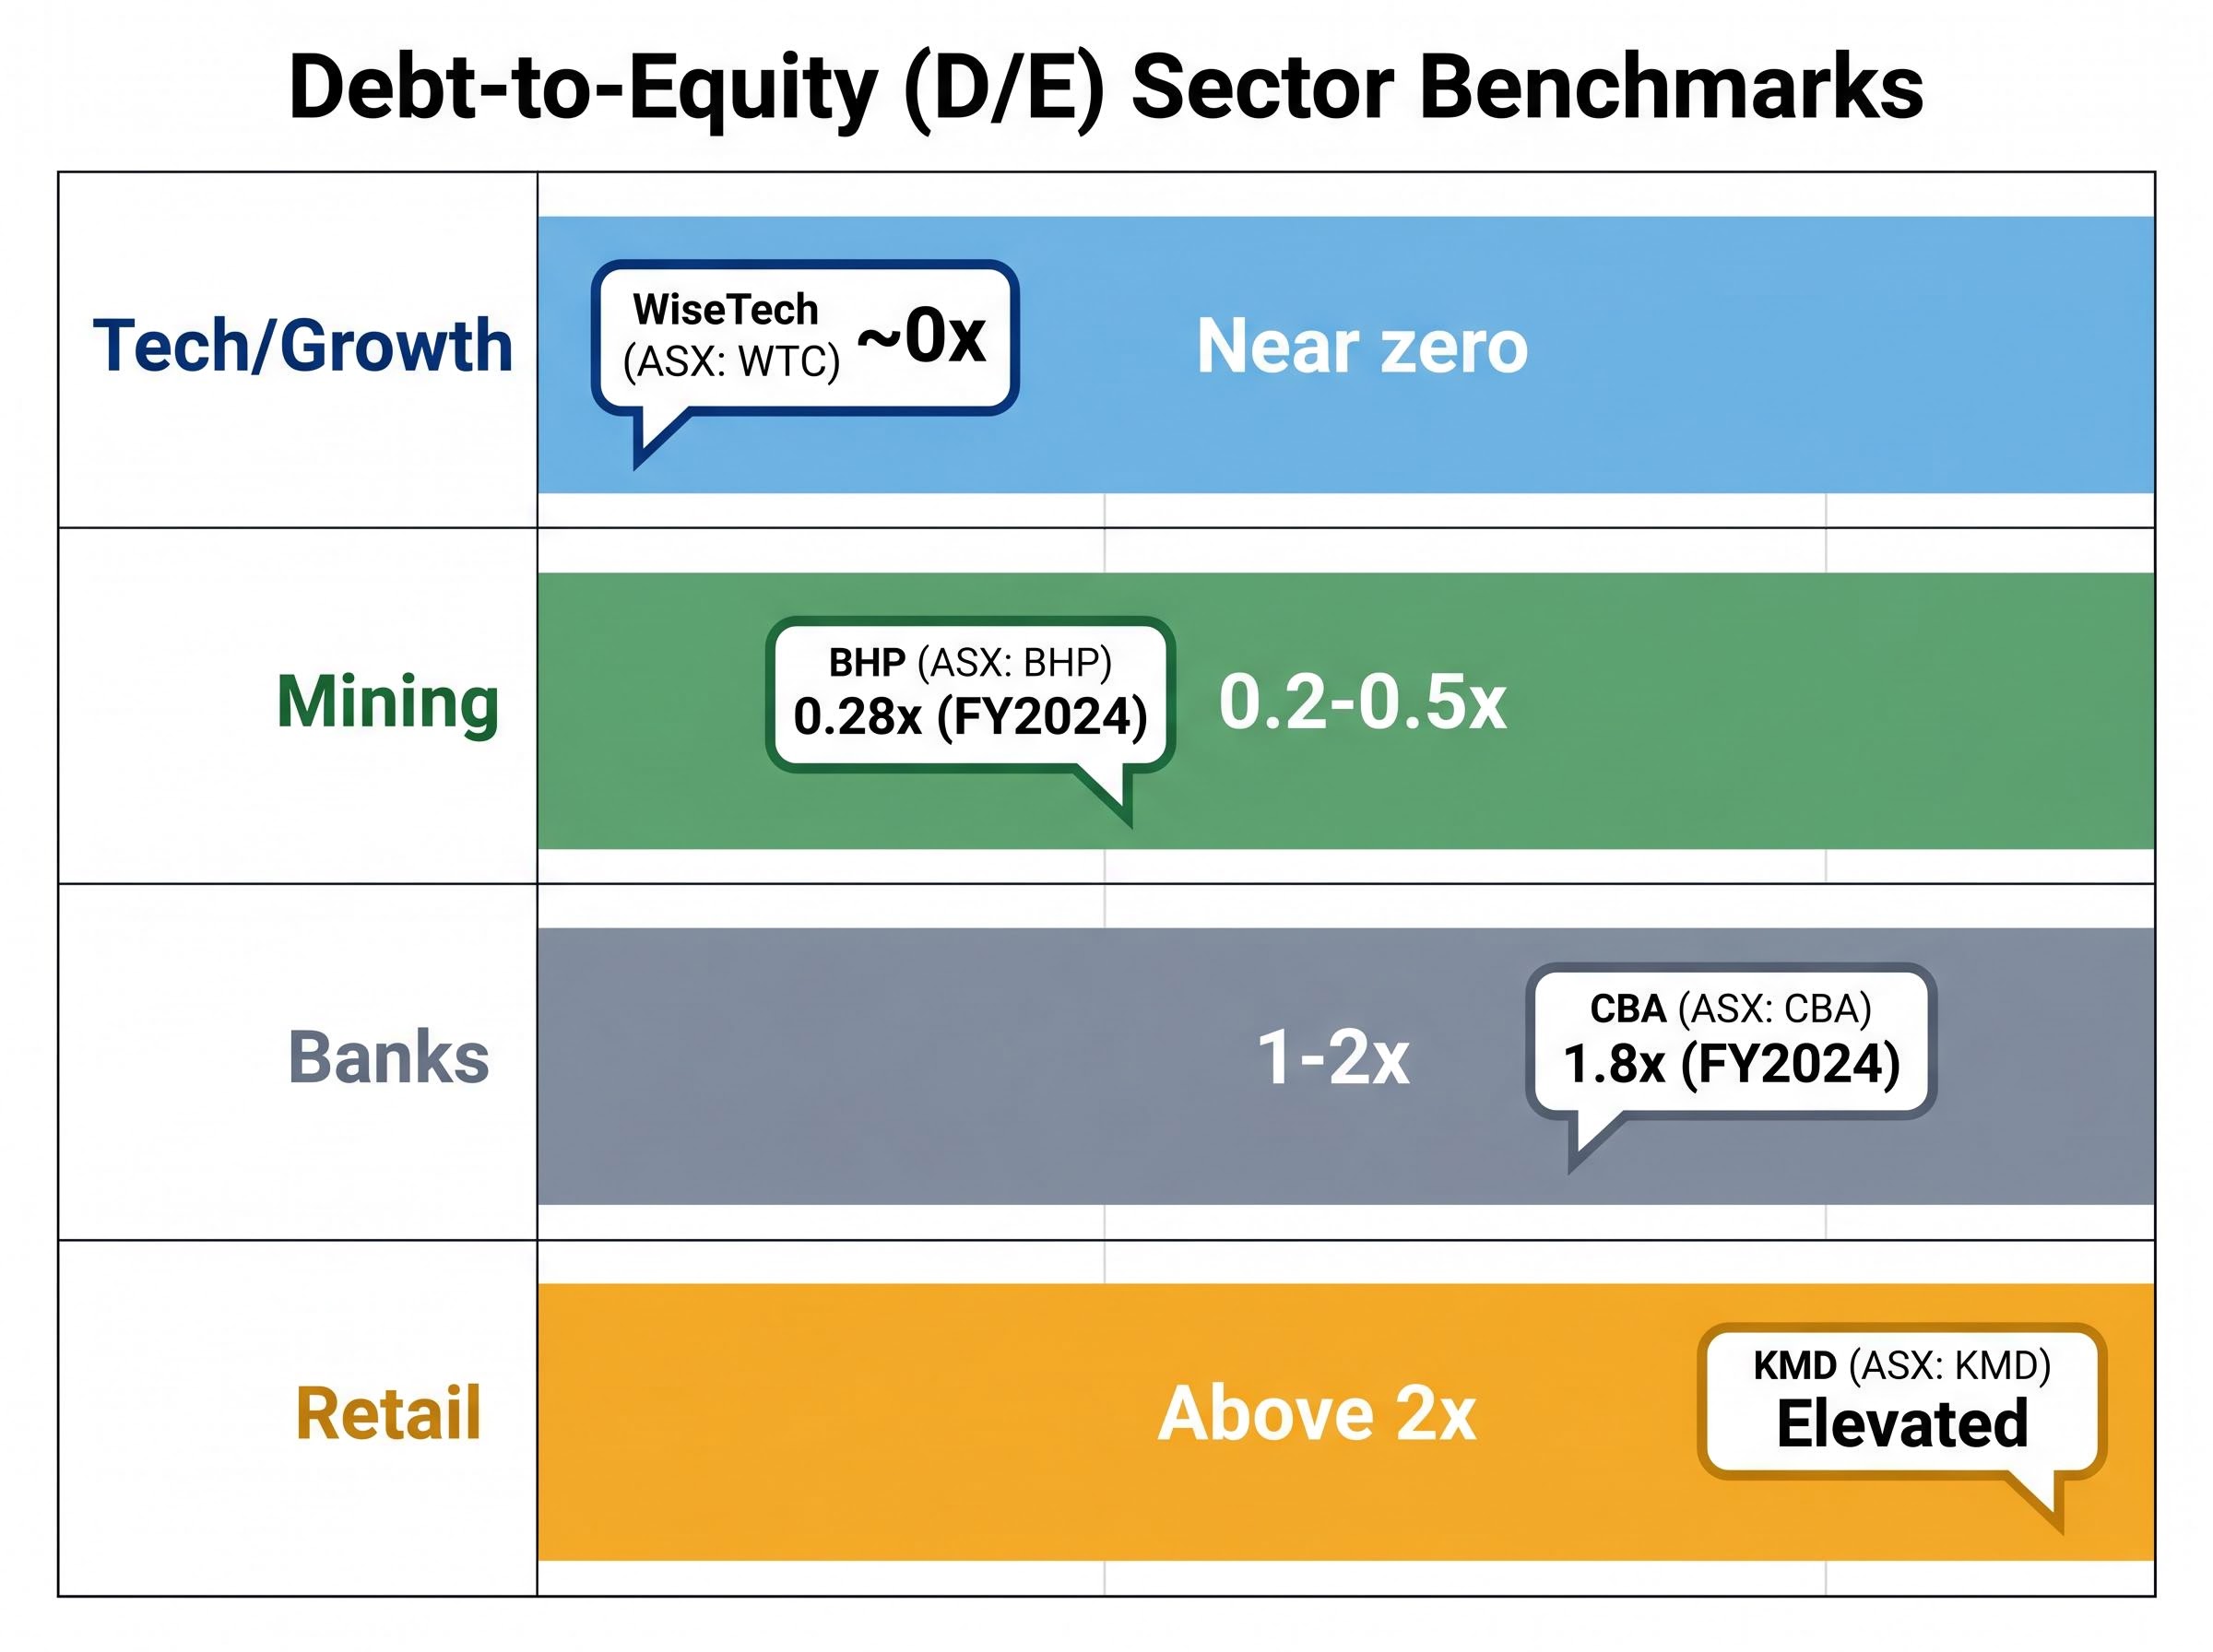
The debt-to-equity ratio measures financial leverage, but the number means nothing without sector context. What counts as healthy varies significantly:
Sector D/E benchmarks (approximate):
– Mining: 0.2-0.5x considered healthy – Banks: 1-2x is the structural norm (leverage is inherent to the business model) – Retail: above 2x warrants scrutiny – Tech/Growth: typically near zero net debt (e.g., WiseTech Global, ASX: WTC, which maintains a cash-rich, near-zero net debt position)
Book value per share compares the accounting value of shareholder equity to the number of shares outstanding. BHP’s FY2024 BVPS of approximately US$19.86 provides a reference point for investors comparing the company’s book value against its market price, a signal of potential over- or under-valuation relative to net asset backing.
The same debt-to-equity ratio can signal strength in one industry and distress in another. Applying a single universal benchmark across sectors leads to systematically wrong conclusions.
BHP carries a D/E of approximately 0.28x, which positions it at the lower end of the mining sector’s healthy range. Commonwealth Bank (ASX: CBA) reported a D/E of approximately 1.8x in FY2024, a figure that would alarm a mining investor but is entirely consistent with regulated banking norms, where deposits fund lending activity and leverage is built into the business model.
Kathmandu Holdings (ASX: KMD) presents a different picture. Its elevated D/E for a discretionary retail business compounds operational risk in a sector where inventory buildups and seasonal cash flow swings already create pressure. Analysts have flagged inventory accumulation and declining working capital as specific risk factors.
Mining companies in a deleveraging phase illustrate why trend analysis over 3-5 years is necessary. A single filing can capture a company mid-cycle, obscuring whether leverage is rising or falling. The direction of travel matters more than any single data point.
Pre-revenue ASX companies, particularly in biotech, require a different balance sheet emphasis: cash runway analysis, derived from Appendix 4C quarterly reports, replaces working capital as the primary liquidity signal when a company has no operating income to offset its cash burn.
The RBA Financial Stability Review (April 2025) described corporate leverage across the ASX as “moderate,” with net debt-to-EBITDA below 3x characterised as healthy for the broader market.
The RBA Financial Stability Review from April 2025 assessed the corporate sector’s overall resilience, characterising net debt-to-EBITDA below 3x as consistent with moderate leverage across the broader Australian market, a benchmark that contextualises individual ASX company readings within the wider economy.
| Company | Sector | Approx. D/E (FY2024) | Working capital | Key takeaway |
|---|---|---|---|---|
| BHP | Mining | 0.28x | Positive | Low leverage; benchmark for mining balance sheet health |
| CBA | Banking | 1.8x | Structural | Leverage consistent with regulated banking norms |
| WiseTech | Technology | ~0x | Positive | Cash-rich; near-zero net debt typical of high-growth tech |
| KMD | Retail | Elevated | Declining | Leverage compounds seasonal and inventory-driven risk |
A framework only becomes useful when it translates into a repeatable process. The following steps convert a balance sheet read from an abstract exercise into something an investor could complete tonight for any ASX-listed company.
Several free and low-cost tools support this process at different levels of experience:
Free tools:
Paid or freemium tools:
ASIC MoneySmart guidance recommends assessing D/E below 2x, checking working capital positivity, and comparing across 3-5 year trends to avoid snapshot analysis errors.
ASIC MoneySmart warns against “snapshot analysis,” recommending investors compare balance sheets across 3-5 years and against sector peers before making investment decisions.
The balance sheet is one leg of a three-part analytical foundation. It must be read alongside the income statement and the cash flow statement to form a complete view of any company. Alone, it answers what a business owns and owes. Combined with cash flow, it reveals whether those assets are generating real liquidity.
Three ratios, working capital, debt-to-equity, and book value per share, are the practical output of every balance sheet read. Each should be benchmarked against sector norms, not universal thresholds, and tracked across at least three consecutive reporting periods before informing a decision.
Book value per share becomes a more complex signal when price discovery on the ASX is increasingly driven by passive ETF flows rather than fundamental analysis, a dynamic the RBA Financial Stability Review has formally identified as a systemic amplifier capable of pushing market prices away from underlying balance sheet values for extended periods.
The ASX Announcements Platform is the primary source. ASIC MoneySmart and ASX Investor Resources provide accessible starting points for continued learning. Building the habit of opening an annual report, locating the Statement of Financial Position, and running three calculations is the single most effective step an Australian retail investor can take to move beyond price-based analysis toward genuine due diligence.
For investors who have developed balance sheet literacy and are now considering whether to use leverage to increase their ASX exposure, our dedicated guide to margin lending costs examines current variable rates above 10% per annum, the mechanical trigger conditions for margin calls, and the structural suitability criteria that ASIC-regulated lenders are required to apply before approving a leveraged position.
This article is for informational purposes only and should not be considered financial advice. Investors should conduct their own research and consult with financial professionals before making investment decisions.
A balance sheet is a financial snapshot showing what a company owns (assets) and what it owes (liabilities) at a single point in time, with the difference representing shareholder equity. It answers the question of a company's net worth on a specific date, but must be read alongside the cash flow statement to understand whether those assets are generating real liquidity.
Working capital is calculated by subtracting current liabilities from current assets, both of which are listed on the balance sheet. A positive result means the company can cover its near-term obligations from near-term assets, while a negative result signals potential short-term financial strain.
A healthy debt-to-equity ratio varies significantly by sector: for mining companies a range of 0.2-0.5x is considered healthy, for banks 1-2x is the structural norm, while for retailers a ratio above 2x warrants scrutiny. Applying a single universal threshold across all sectors leads to systematically wrong conclusions.
ASX-listed company balance sheets are freely accessible through the ASX Announcements Platform by searching a company's ticker and downloading the latest annual or half-year report. CommSec and the ASX Investor App also provide balance sheet data and ratios, including historical trends, at no cost.
ASIC MoneySmart recommends comparing balance sheets across at least 3-5 years to identify trends rather than relying on a single snapshot, which can capture a company mid-cycle and obscure whether leverage is rising or falling. A minimum of three consecutive reporting periods is the standard recommended by Australian investor education sources.