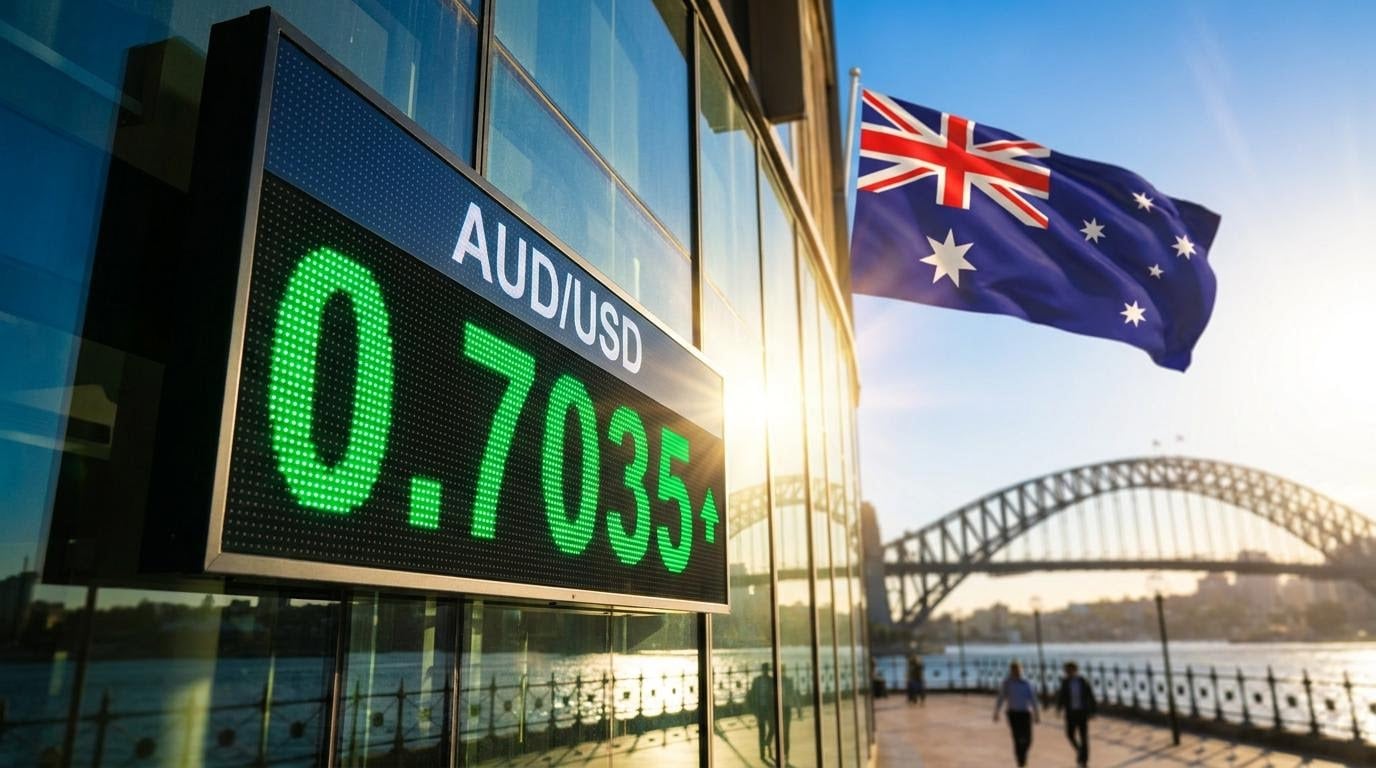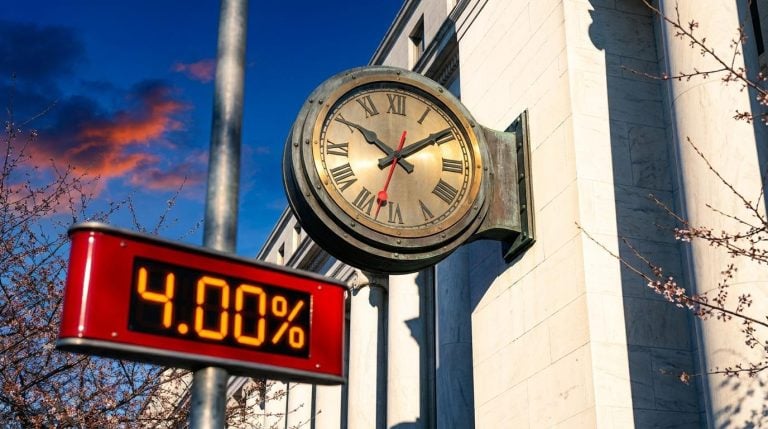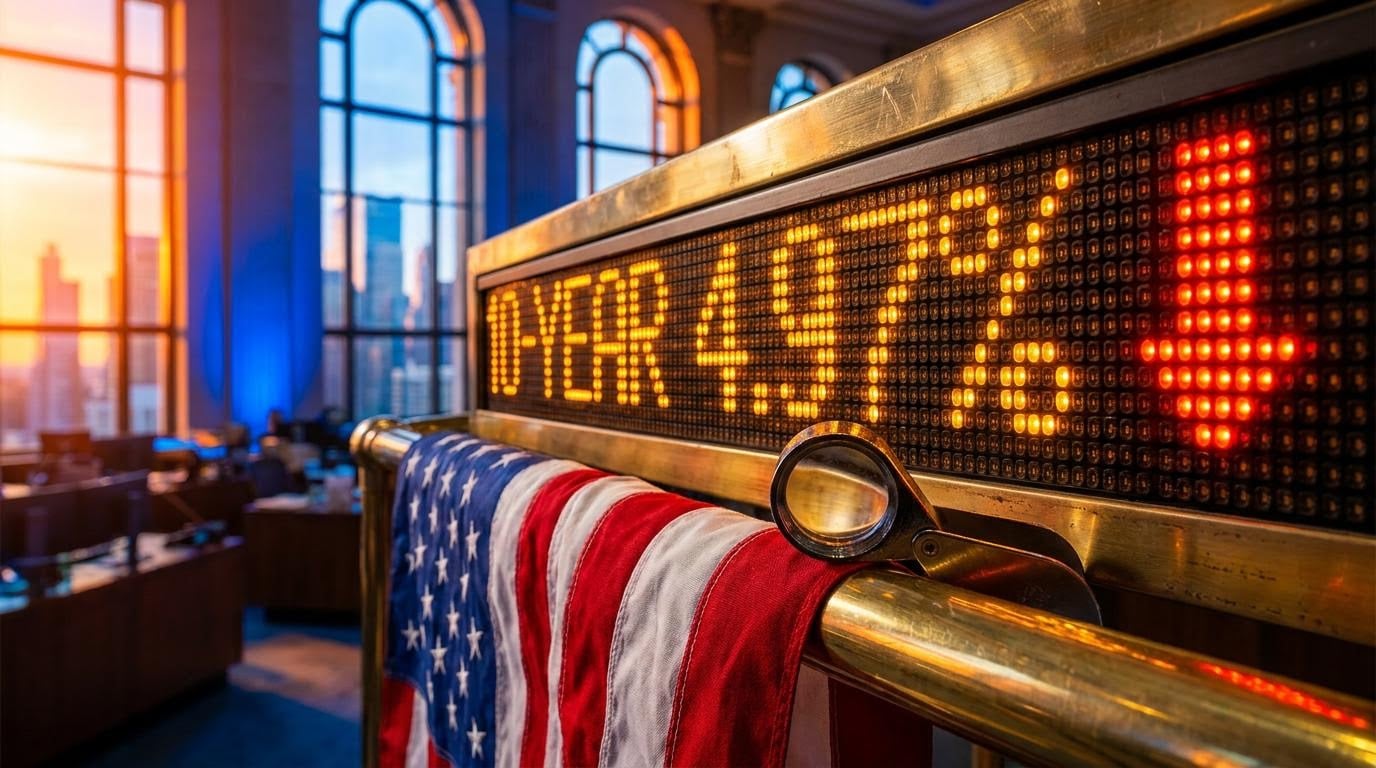
The 10-year Treasury yield fell between 17 and 19 basis points on 22 October, closing near 4.97% after touching roughly 5.31% earlier in the month. Reuters called it the biggest one-day drop since March 2023. Most investors would read that as relief, but one market commentator reads it as an early sign of pre-midterm market stress.
The timing gives that reading weight. The Federal Reserve announces its decision on Wednesday 28 October, and Americans vote in the midterms on Tuesday 3 November. Two catalysts land inside a single week.
The speaker’s thesis is bearish and long-held. This piece tests it against the available data, and it should be read as one person’s view rather than a forecast.
You will see the catalysts that matter over the next fortnight, the two decline paths the speaker expects, and where the evidence backs or weakens each one.
Why are falling Treasury yields a warning, not a relief?
The comfortable story is simple. Yields climbed in early October on inflation worries, higher energy prices, heavy Treasury supply and borrowing for AI infrastructure. Then they eased, which suggests some of that pressure lifted.
The drivers behind the two moves were different, though. The 22 October reversal came as AI and semiconductor stocks sold off and oil climbed, and investors bought Treasuries as shelter.
“A flight to safety.” Mitch Goldberg, ClientFirst Strategy, on the 22 October bond rally
The speaker goes further. On this view, the drop is a risk-off move ahead of the midterms, with US yields boxed in by government debt needs and stress in credit default swaps (contracts that pay out if a borrower defaults). The speaker argues that if markets recover, yields would rise again and cap the rally. No recent named source in the research quantifies broad US credit default swap stress, so that part rests on the speaker’s judgement.
Investment-grade corporate credit spreads, which sit near 0.80 percentage points by one recent measure, offer a cleaner read on systemic stress than the yield figure alone; the speaker’s swap-stress claim is the part that data like this would need to confirm.
Other experts see a more temporary picture. Jim Barnes of Bryn Mawr Trust described a short-lived flight to quality that could reverse as panic eases. J.P. Morgan‘s Nikolaos Panigirtzoglou estimates a roughly $260 billion rise in 2026 net tech-company bond issuance, which he sees as material but manageable.
| Interpretation | Who holds it | Main driver | What would confirm it |
|---|---|---|---|
| Flight to safety | Goldberg, Barnes, the speaker | AI and chip selloff | Yields keep falling while tech stays weak |
| Supply and term premium | J.P. Morgan, Morningstar | Treasury and AI corporate issuance | Yields climb back as issuance continues |
| Valuation buying | Pension funds and insurers | Yields near 5% | Steady demand at auctions |
| Inflation and oil | Rate-hike watchers | Higher oil prices | Rising odds of a December hike |
A falling yield alongside a weak tech tape tells you money is looking for shelter, not signalling confidence. If you hold bonds as a hedge, check why they are rallying before you treat the move as good news.
When big ASX news breaks, our subscribers know first
What does the market’s internal stress look like beneath the index?
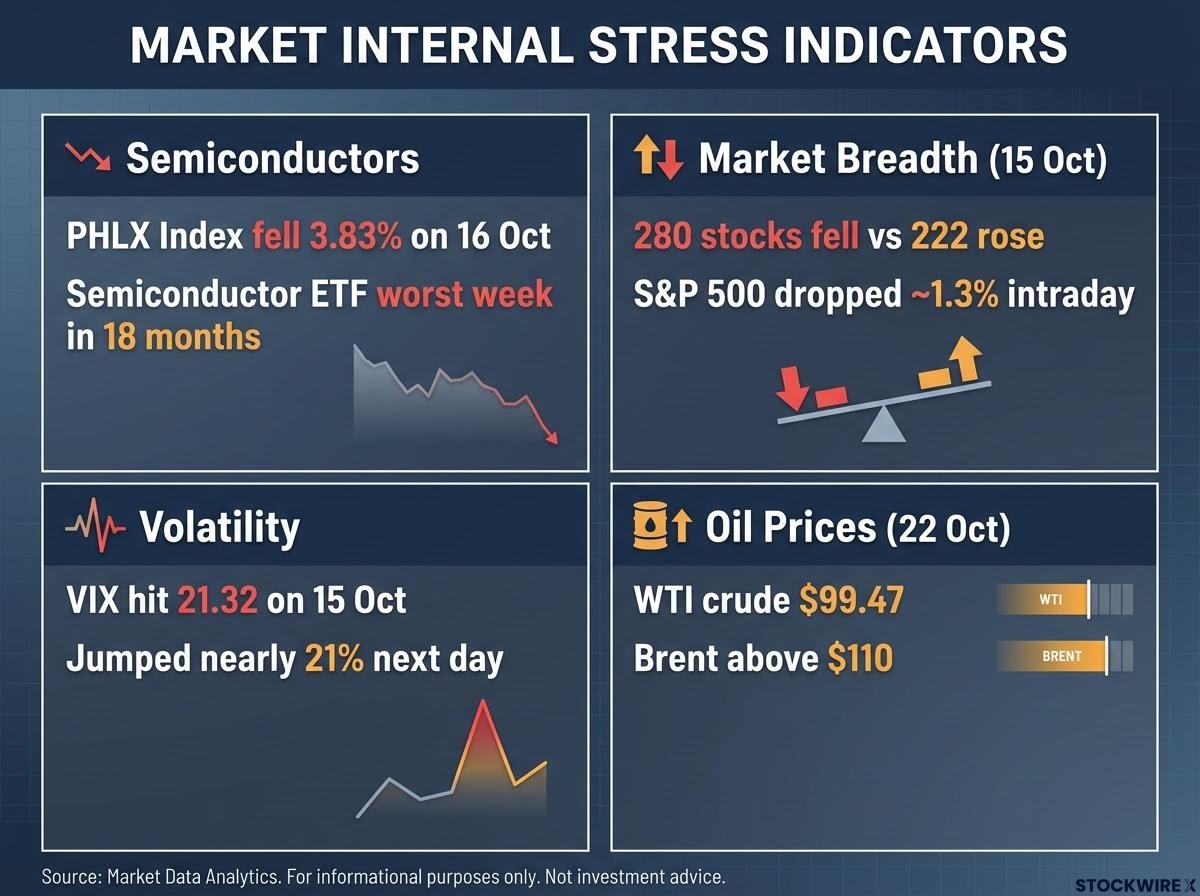
The bond market sent a clear signal, but the equity market is harder to read. Four separate gauges each show part of the picture:
- Semiconductors: The PHLX Semiconductor Index fell 3.83% on 16 October, and the semiconductor ETF reportedly had its worst week in 18 months.
- Breadth: On 15 October, about 280 stocks fell and 222 rose, while the S&P 500 dropped about 1.3% intraday.
- Volatility: The VIX, a gauge of expected swings in the S&P 500, hit 21.32 on 15 October and jumped nearly 21% the next day.
- Oil: WTI crude settled at $99.47 on 22 October, and Brent traded above $110.
Put those together and a pattern emerges. Damage is heavy in crowded AI and chip names, breadth is weak but not indiscriminate, and the VIX is elevated without reaching panic levels.
Money has rotated into software and consumer stocks, but that move is patchier than the rush into bonds. It does not yet look like a clean change in market leadership.
Oil adds a cross-asset risk. Crude near $100 can push stocks and bonds down together, which would break the usual hedge where Treasuries rise when equities fall.
The speaker’s read on dispersion
The speaker argues the headline index is propped up by compressed volatility, which hides a large split between winners and losers. Tech stress, on this view, foreshadows worse outcomes later. The speaker also says administration messaging, which the speaker considers the best market guide of the past two years, has turned quiet or negative, and cites warnings of a depression if Democrats win. Those signals are not supportive.
That is inference, not data. Still, the lesson for your portfolio holds either way: a calm index can mask real damage underneath. If you own tech-heavy index funds, check breadth and dispersion in your holdings rather than trusting the headline level.
Weak market breadth can persist for months beneath a calm headline index, with only about a third of S&P 500 stocks above their 50-day average in recent data, so it works as a condition to monitor rather than a timing signal.
Can the October 28 Fed decision tip the balance?
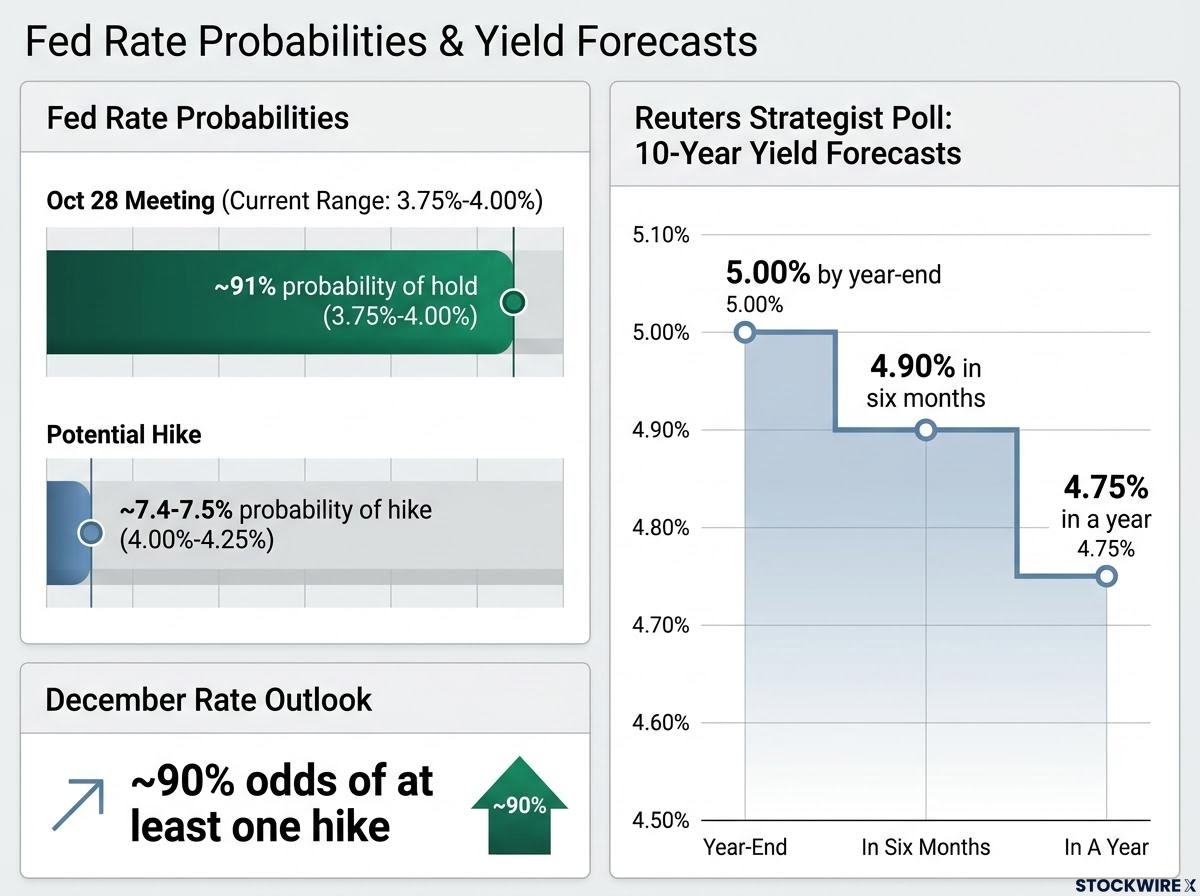
Markets have largely settled on a hold. The Fed raised its target range by 25 basis points to 3.75%-4.00% in September, and the current debate is about pausing versus tightening further, not cutting.
About 91% Reported market-implied probability of no change on 28 October, against roughly 7.4-7.5% for a hike to 4.00%-4.25%
When a decision is that well priced, the decision itself carries little surprise. The risk sits in the language. One report puts the odds of at least one December hike near 90%, and these pricing figures come from market reports that have not been independently verified.
The speaker sees the meeting as a major catalyst. Another hike would risk a further leg down, while a policy reversal could support markets for a few weeks to a month, into the midterms. The speaker also expects hints from Fed officials over the weekend or on Monday, though that is an expectation, not a confirmed event.
On Wednesday, three things matter most:
- The rate decision itself, and whether any officials dissent.
- The tone of the press conference, especially on inflation and oil.
- Signals about a December hike.
A Reuters strategist poll puts the 10-year yield at 5.00% by year-end, 4.90% in six months and 4.75% in a year. If the hold is already priced, any surprise for your portfolio will come from the press conference and December guidance, so those are the details to watch.
Two paths to a year-end decline: where options expiration fits
Before weighing the speaker’s scenarios, it helps to know that history leans the other way.
What history says
Morgan Stanley data shows the S&P 500 has gained an average of about 13% in the 12 months after midterms since 1930. The firm also found the 10-year yield fell an average of 33 basis points in the six months before midterms since 1953, so this month’s drop partly fits a familiar pattern.
UBS observes that markets often trade in a range before Election Day and break higher afterward. The 10-year yield also fell after the 2018 midterms. These are averages, not forecasts, and the Fed, inflation, earnings and oil will decide whether the pattern holds this year.
Returns in midterm election years have tended to improve once political uncertainty clears, and the three exceptions since 1950 were driven by inflation, rate tightening or economic dislocation rather than the vote itself.
The speaker’s two paths
The speaker’s bearish thesis runs against that seasonal pattern. It comes in two versions.
| Feature | Path 1 | Path 2 |
|---|---|---|
| Trigger | A rally into the midterms fails | Gradual stair-step selling |
| Timing | December options expiry (most likely) or January | Starts in October, accelerates in early January |
| Size of decline to year-end | Depends on the failed rally | Under 10% peak to trough |
| What comes later | Decline of at least 20% after January | Decline of at least 20% after January |
Options expiry matters because it changes how dealers hedge. Gamma measures how quickly a dealer’s hedging needs change as prices move. When dealers have positive gamma, their hedging dampens moves, and when they have negative gamma, it can amplify them.
No source in the research ties these mechanics to a specific crash scenario, and expiry is not an automatic trigger. The speaker says both paths can be positioned for cheaply in options. Treat them as scenarios with different timing: a failed rally points to Path 1, while slow slippage points to Path 2. Each tells you which signal would confirm or kill the thesis.
These statements are speculative and subject to change based on market developments. Past performance does not guarantee future results.
Global spillovers and perpetual futures: what is and is not a crash risk
The thesis also extends beyond US stocks and bonds. The two side questions it raises come out very differently under scrutiny.
Is US policy a tax on the world?
The speaker describes US financial repression (policies that hold borrowing costs below where markets would set them) as a tax on the world and a competitive move aimed at China. On this view, US tech and long-duration assets may underperform first, and the rest of the world fares worse as the US recovers. The speaker adds that this depends on successful policy and says they would not bet against the Fed and Treasury.
The research found no source that quantifies these spillovers. The plausible channels are higher global discount rates, dollar repricing, energy inflation and weaker global capital spending tied to US tech. The idea is plausible, but no one has measured it.
Why perpetual futures are not seen as a crash trigger
Perpetual futures are crypto contracts with no expiry date. Traders pay periodic funding rates to hold them, and exchanges automatically close leveraged positions when losses mount. Reports put the 10 October 2025 wipeout at more than $19 billion force-closed across about 1.6 million accounts within hours, a figure that has not been independently verified.
CME Group CEO Terry Duffy has reportedly warned about extreme leverage. An SEC comment document said the evidence is consistent with amplification but does not prove perpetuals cause crashes. For the damage to reach traditional markets, one of these would need to break:
- Common lenders exposed to both crypto and traditional assets
- Forced selling of collateral
- Stablecoin stress
- A loss of confidence in intermediaries
The speaker sees perpetuals as too small and retail-driven to cause a broader crash. For your portfolio, they are a reason to expect sharp weekend crypto swings, not a reason to expect a drag on Treasuries or equities.
What the evidence supports, and what it does not
Parts of the thesis hold up well. Yields reversed on a safety bid, tech stress is concentrated, and the Fed is a live catalyst. The failed-rally scenario at options expiry, the stair-step slide and the 20% decline remain the speaker’s own forecasts.
The counter-arguments carry real weight. J.P. Morgan sees AI issuance as manageable, yields near 5% attract income buyers, and seasonality has historically favoured gains after midterms.
The counter-reading treats yield normalisation after a decade of quantitative easing as the main story, with healthy auction demand suggesting bond buyers have not walked away at levels near 5%.
The decision points are clear. Watch the Fed on 28 October, the midterms on 3 November, oil near $100, the 10-year yield against 5%, and the December and January expiries. Those signals will show which reading wins.
This article is for informational purposes only and should not be considered financial advice. Investors should conduct their own research and consult with financial professionals before making investment decisions.