
How the 10-Year Treasury Yield Drives Your Mortgage Rate
28 mins ago

A $100,000 investment left untouched in the S&P 500 for a decade grew to roughly $272,000. The same investment, missing just 10 trading days out of approximately 2,500, grew to only $153,000. Ten days out of a decade decided the difference between building wealth and barely keeping pace. Market timing, the practice of moving in and out of the market to avoid downturns and capture peaks, remains one of the most intuitive ideas in investing and one of the most consistently damaging. With economic uncertainty and financial media amplifying every market swing, the temptation to “do something” when portfolios fall is persistent and psychologically powerful. This explainer walks through the hard numbers behind missing the market’s best days, explains why the popular counterargument fails in practice, unpacks the behavioural forces that make timing feel rational, and provides concrete systems for staying invested without relying on willpower alone.
The numbers arrive in sequence, and each row makes the previous one harder to dismiss.
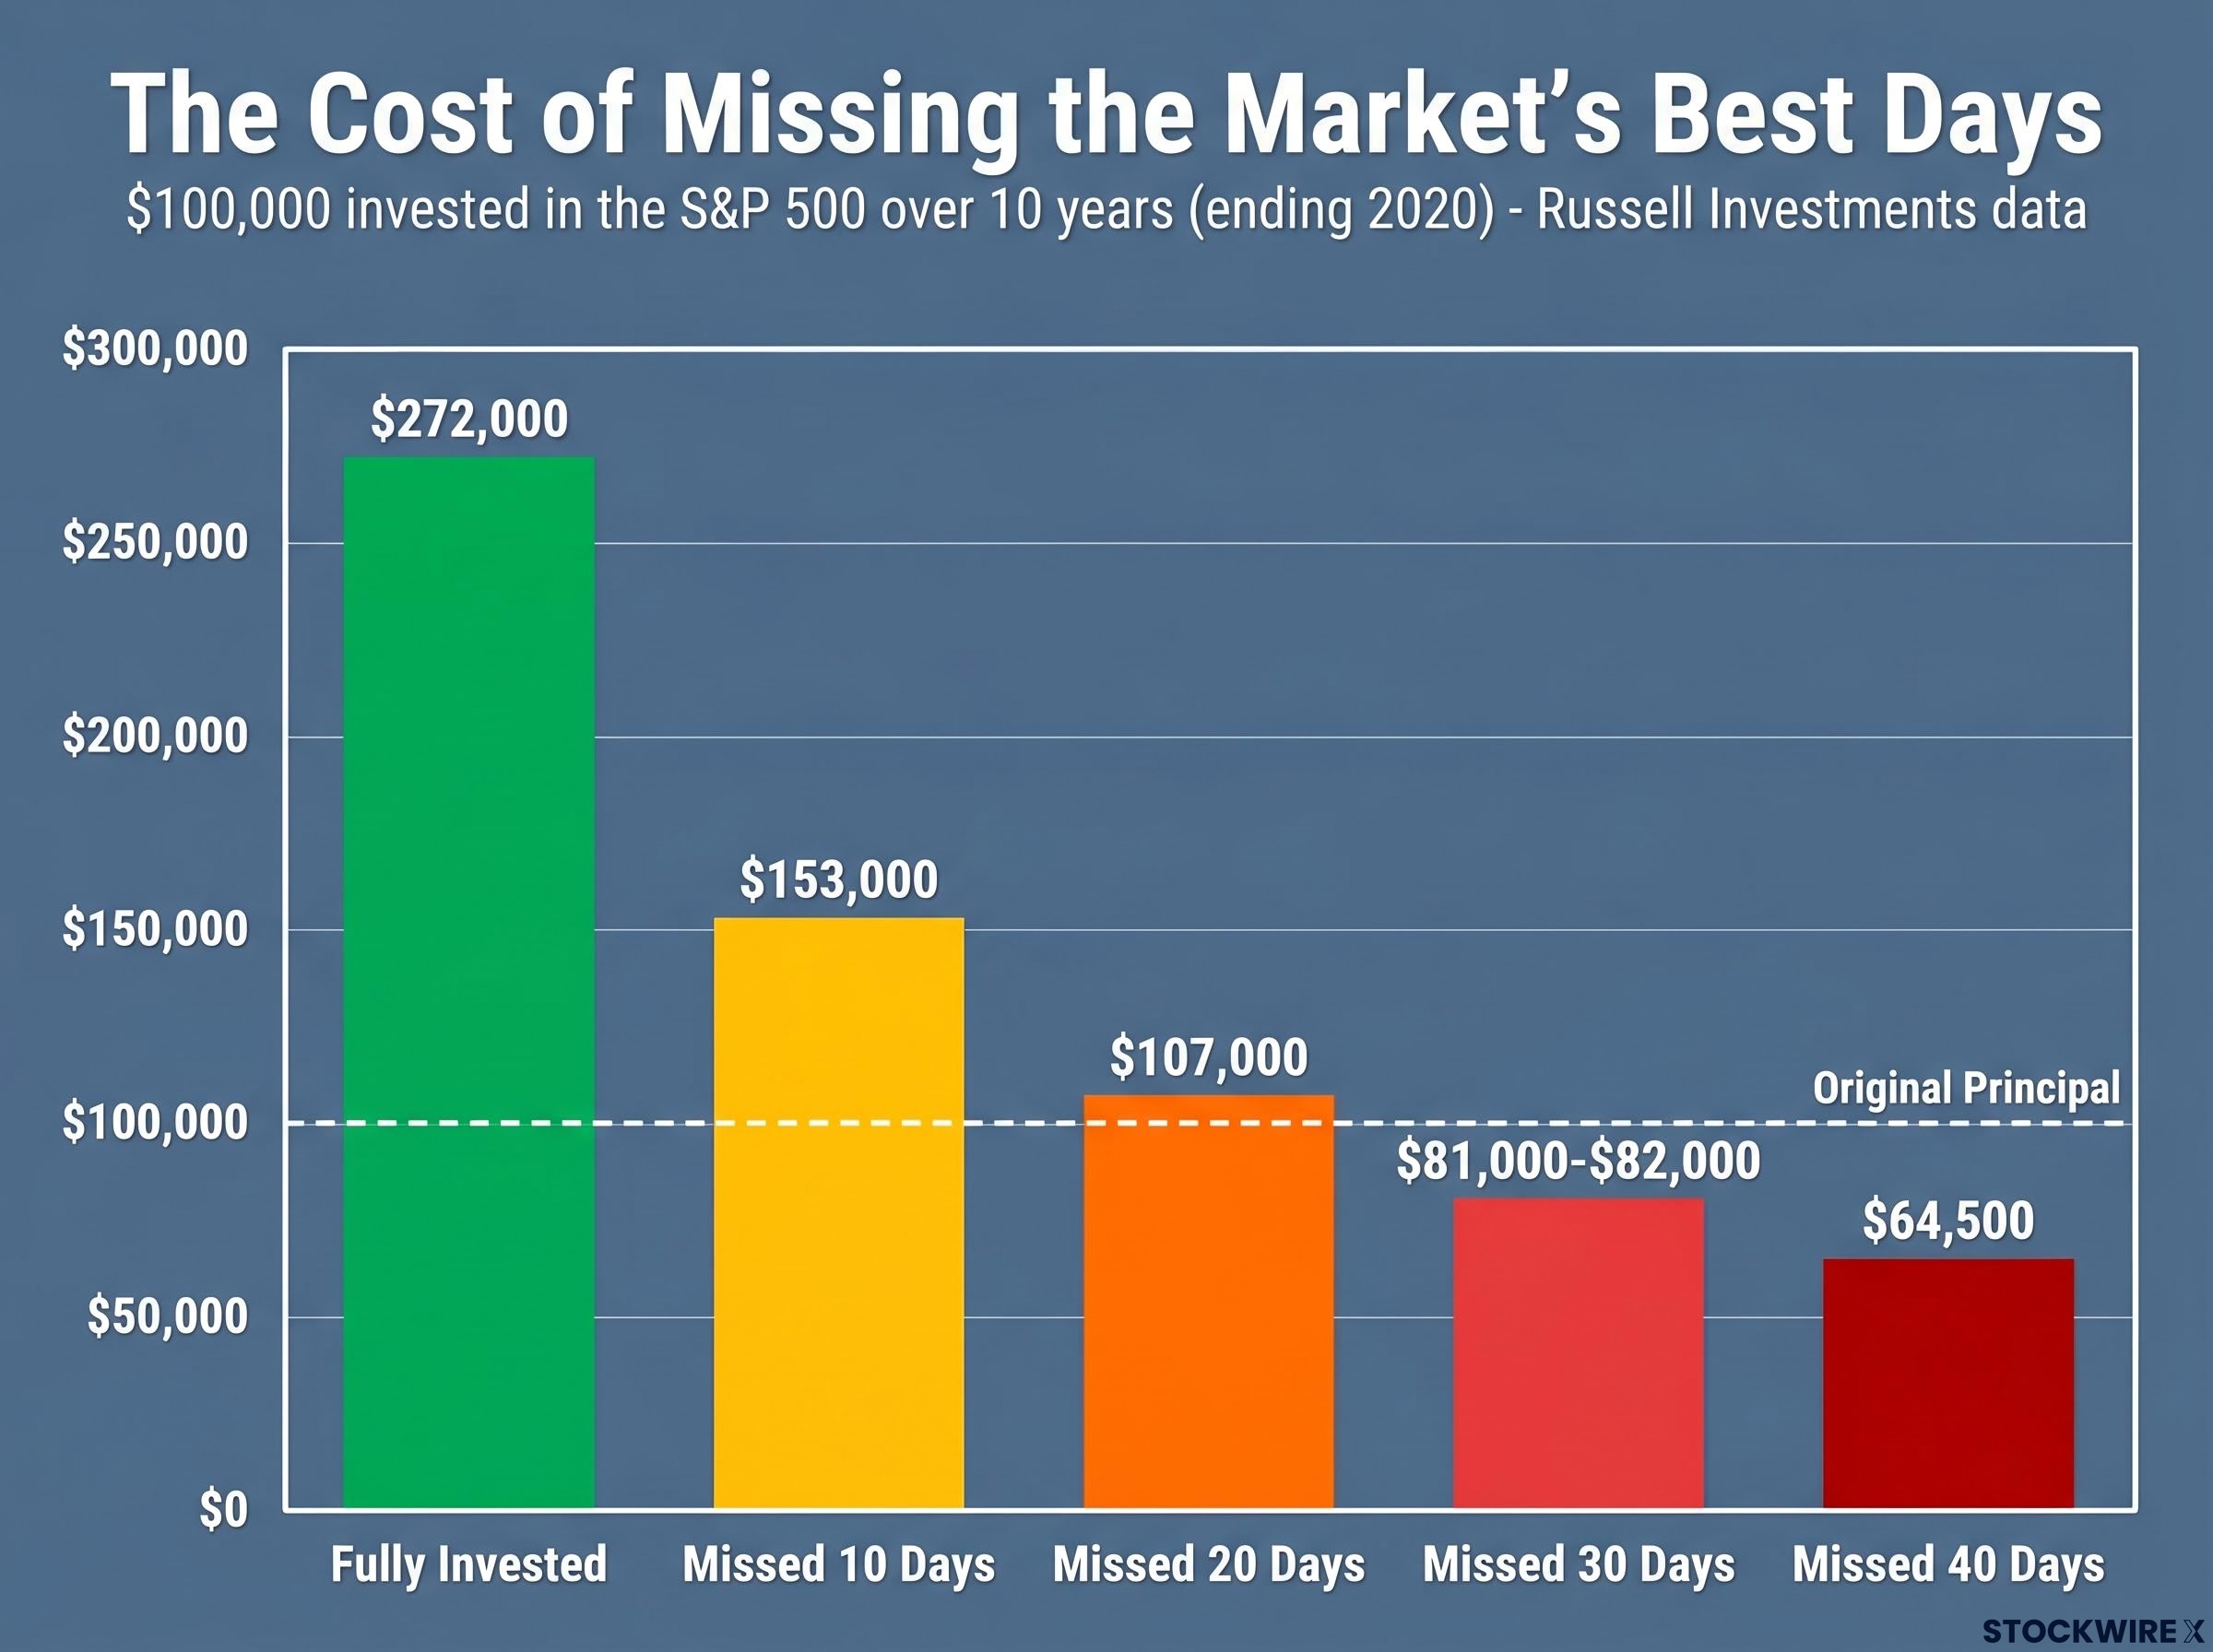
A $100,000 investment held continuously in the S&P 500 over the 10-year period ending in 2020 grew to approximately $272,000, according to Russell Investments research. Miss the 10 strongest trading days during that decade and the same portfolio reached just $153,000, roughly $120,000 less. Miss 20 and the portfolio dropped to approximately $107,000, a gain of only $7,000 over an entire decade. Miss 30 and the balance fell to around $81,000-$82,000, below the original amount invested. Miss 40 and the ending value sat at approximately $64,500.
The Russell Investments market timing research quantifies precisely how each additional block of missed days compounds the damage, with the 30-day and 40-day scenarios showing portfolio balances falling below the original principal invested across the studied period.
| Days Missed | Ending Portfolio Value | Gain or Loss vs. Fully Invested |
|---|---|---|
| 0 (Fully Invested) | $272,000 | Baseline |
| 10 | $153,000 | -$119,000 |
| 20 | $107,000 | -$165,000 |
| 30 | $81,000-$82,000 | -$190,000+ |
| 40 | $64,500 | -$207,500 |
Each additional block of missed days does not simply trim returns. It eventually erases the original principal.
The pattern holds across longer horizons. Over 20 years (2004-2023), staying fully invested in the S&P 500 produced an annualised return of approximately 9.8%. Missing just the 10 best days cut that figure to approximately 5.6%, according to Hartford Funds analysis. Over 30 years, the damage compounded further.
Missing just 10 of the market’s best days over a 30-year period cut total returns roughly in half. Missing 30 best days reduced returns by approximately 84%.
This is not an artifact of one unusual decade. It is a stable feature of how equity returns are distributed across time.
The counterargument sounds perfectly reasonable. If missing the best days hurts so badly, surely missing the worst days would help just as much. An investor who could sidestep the crashes while catching the rebounds would outperform everyone. The logic is symmetrical, intuitive, and wrong in practice.
The problem is clustering. The market’s best days and worst days do not arrive in tidy, predictable sequences separated by months of calm. They occur in close proximity, often within days of each other.
Executing a correct market exit requires getting two decisions right under uncertainty: when to sell and when to re-enter. The first decision feels manageable in the moment, driven by headlines and portfolio pain. The second is where timing strategies collapse.
Re-entry is psychologically harder than exit because conditions only feel safe after prices have already recovered. The investor who sold during a 20% drawdown waits for stability, stability arrives at higher prices, and the re-entry point erases much or all of the benefit of having avoided the downturn. The same environment that makes selling feel urgent is frequently when the most powerful rebounds occur. The game is not merely difficult. It is structurally stacked against the timer.
Crash protection strategies carry their own measurable cost: the traditional 60/40 portfolio lagged the S&P 500 by approximately 14 percentage points in 2024 alone, and low-volatility equity funds underperformed by roughly 10 points during the same period, meaning the price of defensive positioning is paid every year the market advances, not just in the years it falls.
Long-term equity returns are not smoothly distributed across all trading days. They are heavily concentrated in a small number of high-return outlier days, the very days that tend to arrive when fear is at its peak.
A bear market is conventionally defined as a decline of approximately 20% from peak levels. Bear markets are not anomalies or surprises for investors with multi-decade horizons. They are recurring, expected features of market cycles that long-term investors should treat as certainty rather than possibility. Many of the market’s strongest individual days occur inside bear markets or in the immediate aftermath, during the early phase of recovery. The Global Financial Crisis provides a concrete illustration: investors who exited during the drawdown and waited for conditions to “feel safe” before re-entering absorbed the full decline but missed substantial portions of the multi-year rebound that followed.
A portfolio decline that exists on a screen is not the same as a loss deposited in a bank account. An unrealised decline, no matter how large, only becomes a permanent loss at the point of sale.
Unrealised losses only become permanent losses when investments are sold. A 30% drawdown recovered over 18 months costs nothing for the investor who holds through it and everything for the investor who sells at the bottom.
This distinction changes how every drawdown should be evaluated. A notional decline is temporary by definition, lasting only as long as the position is held. A realised loss is permanent. The act of selling during a downturn is what converts one into the other.
Knowing the data is not enough, because the forces pushing investors toward the exit are not intellectual. They are emotional, and they operate below conscious decision-making.
Kahneman and Tversky’s loss aversion research: The pain of a financial loss is experienced as approximately twice as intense as the pleasure of an equivalent gain.
For long-term investors with stable goals, quarterly or annual portfolio reviews are generally sufficient. New investors are specifically advised to consider once-per-year reviews to reduce the odds that short-term volatility triggers a reactive decision. Naming these forces does not eliminate them, but it creates the moment of recognition that separates an impulsive reaction from a deliberate response.
For investors who recognise the pull toward the exit but want to quantify exactly what it costs, our dedicated guide to loss aversion and portfolio costs examines Morningstar’s ‘Mind the Gap’ research showing a 1-2 percentage point annual return shortfall, and walks through three pre-commitment tools designed to interrupt the bias before it reaches the sell button.
Understanding why market timing fails is the diagnosis. What follows is the prescription: four structural systems that make the right behaviour the default behaviour, removing the investor from the decision loop rather than requiring them to override their own instincts in real time.
| Target Allocation | Upper Threshold | Lower Threshold | Action Triggered |
|---|---|---|---|
| Stocks: 70% | 75% | 65% | Sell outperformers, add to underperformers to restore target |
Before acting during any drawdown, run through three questions: Has my goal changed? Has my time horizon changed? Is this fear or a change in fundamentals? If the answers are no, no, and fear, the playbook has done its job.
The three threads of this explainer converge on a single conclusion. The returns are concentrated in a few unpredictable days. The psychology reliably pushes investors to exit before those days arrive. And the systems described above exist to override that psychology by design.
Over the 20-year period from 2004 to 2023, fully invested S&P 500 exposure returned approximately 9.8% annualised. Missing just the 10 best days reduced that figure to approximately 5.6%.
No repeatable track record exists for reliably identifying the market’s best days in advance. The data across decades, across studies, and across starting points tells the same story: a diversified portfolio, held through full market cycles with rules-based maintenance, consistently outperforms timing-driven approaches in long-term wealth accumulation.
The case for staying invested in a diversified index fund rather than rotating actively is reinforced by two decades of SPIVA data on active versus passive investing, showing that over 90% of active large-cap fund managers underperform the S&P 500 over a 20-year horizon, a failure rate that reflects structural disadvantage rather than individual manager shortfalls.
Staying invested is not passive. It is an active, evidence-based choice that requires deliberate structural support: automation, rules, and pre-commitment devices. For American investors building toward retirement, financial independence, or any long-horizon goal, the gap between a disciplined stay-invested approach and a timing-driven one is not marginal. It is frequently the difference between a comfortable retirement and a diminished one.
This article is for informational purposes only and should not be considered financial advice. Investors should conduct their own research and consult with financial professionals before making investment decisions. Past performance does not guarantee future results. Financial projections are subject to market conditions and various risk factors.
The cost of market timing is severe: a $100,000 investment held continuously in the S&P 500 for the decade ending in 2020 grew to approximately $272,000, but missing just the 10 best trading days reduced that figure to $153,000, a difference of roughly $119,000.
The market's best and worst days cluster together; during the 2004-2023 period, 7 of the 10 best days fell within two weeks of the 10 worst days, meaning any strategy that exits to avoid crashes will almost certainly miss the powerful rebounds that follow.
Over the 20-year period from 2004 to 2023, staying fully invested in the S&P 500 produced an annualised return of approximately 9.8%, while missing just the 10 best days cut that figure to approximately 5.6%, according to Hartford Funds analysis.
Investors can automate contributions on a fixed schedule, use dollar-cost averaging to detach decisions from sentiment, rebalance by rule when allocations drift beyond set thresholds, and write a downturn playbook in advance that includes a mandatory 24-48 hour waiting period before making any trade.
An unrealised loss is a paper decline that exists only while the position is held and can recover over time, whereas a realised loss becomes permanent the moment the investment is sold, meaning selling during a downturn is the act that converts a temporary decline into a permanent one.