A company backed by Nvidia and Blackstone, pitched at roughly $44 billion, pulled its ASX listing this month. It was one of the loudest market stories of the year. For the typical Australian portfolio, it changes almost nothing.
That gap matters. The bigger the headline, the stronger the urge to act on it, and the habit of reacting to headlines is one of the most expensive habits in investing.
Three stories have arrived within months of each other: the failed Firmus Technologies IPO, a warning from fund manager GMO about a coming flood of US shares, and fresh trading data from Sharesight and Morningstar. Each one can trigger a reaction, and only some of those reactions are justified.
Used as test cases, these three stories give you a way to sort the signal from the noise and build a filter you can apply to the next headline that lands.
Why did the Firmus IPO fail, and what does it actually prove?
The sweeping reading came quickly. The AI bubble is cracking, the ASX cannot support big listings, and data centres are a trap. The evidence supports a much narrower conclusion.
Start with the deal itself. Firmus, an AI data-centre operator, planned to float about 16-18% of the company at $11 a share, implying a valuation of about $43.7 billion. Bankers reportedly cut the price to $8.25 to rescue it, and the board still withdrew, saying the available terms would not reflect the strength of its business given “recent market volatility and prevailing market conditions”.
Even the basic numbers are contested. Reuters put the raising at about $5 billion, while the ABC reported about $7 billion, possibly reflecting different bases. Morningstar’s source material cited a separate figure of around $30.6 billion that has not been reconciled with the $43.7 billion headline, and currency labels across reports are uncertain.
What is clear is how fast the valuation climbed: from about $1.85 billion in September 2025 to more than US$10.5 billion by August 2026, although dates and currencies differ between sources. Firmus was also expected to carry about US$30 billion of debt against forecast 2028 operating earnings of about US$5 billion, roughly six times.
| Explanation | Who raised it | What it shows |
|---|---|---|
| Price and risk-reward | Lochlan Holloway, Morningstar | The trade-off “didn’t stack up” at the asking price |
| Debt and execution | Holloway; ABC | About US$30B of debt against forecast earnings near US$5B |
| Forecast credibility | The Australian | Doubt over building five data centres by end-2028 |
| Shareholder overhang | Startup Daily | Worry about existing holders selling after listing |
| Selective demand | Simon Warner, Aware Super | Fund managers picking deals rather than buying every AI label |
Filip Tortevski of Wealth Within pointed to fatigue over AI capital spending. Some coverage went further, arguing the real problem was not the headline valuation but fund managers’ doubt that the earnings forecasts were achievable at all.
“Doing their job,” was how Aware Super chief investment officer Simon Warner described investors who passed on the deal.
What the failure does not prove
Repricing an expensive, heavily indebted company is justified. Extending that verdict to every AI business, or to the whole ASX, is not. The thin Australian IPO market is useful context, but the evidence does not show it was the main cause.
Morningstar’s Mark LaMonica called the episode mostly noise for the typical investor, adding that he would not have invested given the debt and earnings uncertainty. One deal’s collapse tells you about that deal’s price and leverage. Selling diversified Australian holdings because of it would rest on a conclusion the evidence simply does not support.
For readers wanting the capacity and leverage detail, our detailed coverage of the Firmus withdrawal shows how little of the promised data-centre capacity had actually been built.
When big ASX news breaks, our subscribers know first
How do headlines push investors into costly trading?
If Firmus mattered so little to most portfolios, why did it feel so urgent? The answer sits in how attention distorts judgement.
Research by Robert Shiller, William Goetzmann, Jungmin Kim and Robert Akerlof found that people overestimate the odds of a market crash when crashes are frequently mentioned in the news. Repetition makes an outcome feel likely. String together “AI bubble”, “record IPO”, “data-centre debt” and “IPO collapse”, and one leveraged company starts to stand in for an entire sector.
The trading data shows where that impulse leads. The State of the Australian Investor 2026 report, by Morningstar’s Shani Jayamanne with Sharesight, analysed about 97,000 investors (described in the source as “over 90,000”), 121,000 portfolios and 7.5 million trades across FY2026.
| Trading frequency | Median return | Mean return |
|---|---|---|
| No voluntary trades | 11.99% | Not reported |
| More than 100 trades | 9.64% | About 14% |
| Whole cohort | 11.2% | Not reported |
About 6.5% of investors traded roughly once every 2.54 market days, in a year when the ASX was open 254 days. The result fits a long line of evidence, including Barber and Odean’s work showing active individual investors tend to do worse after costs. Transaction costs ate into returns, and capital gains tax likely cut after-tax results further in a rising market.
The compounding drag of overtrading comes from brokerage, bid-ask spreads and forfeited capital gains tax discounts, costs that build quietly and help explain why the heaviest traders in the Sharesight data lagged.
The limits are worth holding onto:
- The figures show correlation, not proof that trading caused lower returns.
- The sample covers self-directed Sharesight users, not all Australian investors.
- Individual goals and strategies are not visible in the data.
- After-tax returns were not measured.
Why the average misleads
The heavy traders’ median sat at 9.64%, yet their mean reached about 14%. A handful of big winners dragged the average up while the typical frequent trader lagged the typical non-trader.
That gap is the trap. Frequent trading only looks like a winning approach if you measure yourself against its standout results rather than its typical participant. Jayamanne’s data shows no ideal level of trading, but it does show that feeling busy and informed is not the same as being better off.
What does GMO’s equity-supply warning mean, and how much weight should it carry?
Not every headline is noise. GMO’s July 2026 paper, A Catalyst for the AI Bubble Break, makes a serious case worth hearing at full strength.
Its argument is that the trigger for an AI reversal may not be weak demand for AI at all. It may be an oversupply of shares. GMO names three sources: SpaceX lock-up releases, likely IPOs from Anthropic and OpenAI, and secondary issuance by the hyperscalers funding the build-out. A lock-up is a period after a listing when insiders are barred from selling, and secondary issuance means existing holders selling shares to the market.
The mechanism runs in five steps:
- An IPO adds new shares for public investors to buy.
- Lock-ups hold back selling by founders, staff and early investors.
- When lock-ups expire, those holders can sell, creating a second wave of supply.
- If demand does not keep pace, buyers must be offered lower prices.
- The pressure peaks when several large deals and expiries arrive together.
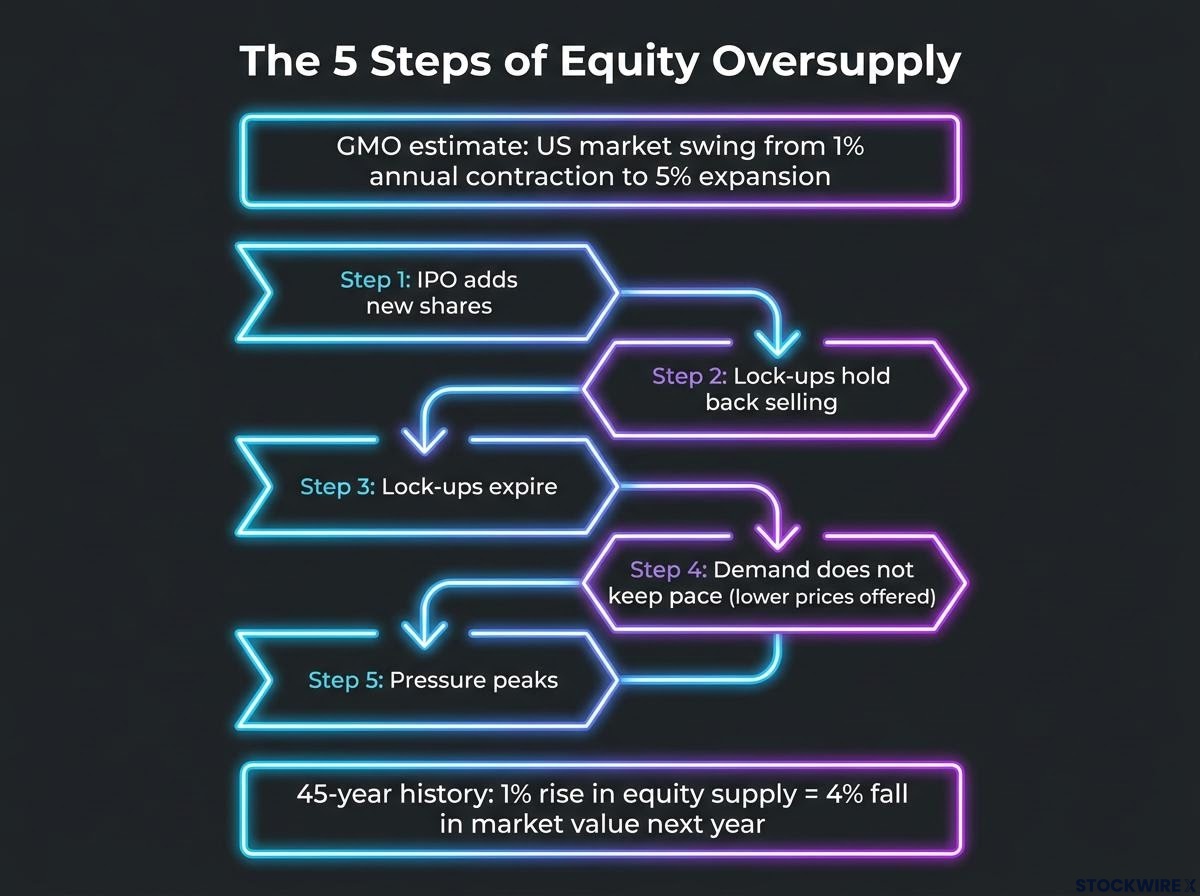
GMO estimates the US market could swing from about 1% annual contraction in share supply to about 5% expansion, a headwind of roughly four to six points.
The historical relationship Over 45 years, each 1% rise in equity supply has been followed by about a 4% fall in market value over the next year, after controlling for valuation.
From this, GMO expects returns about 20% below average over the next 12-18 months. The firm frames it as history used for context, not a prediction of bubbles. Correlation is not causation, new shares that fund productive investment differ from insiders selling, insiders sell for tax and liquidity reasons, and profitable companies can absorb fresh supply. Firmus, where buyers worried about future selling from existing holders, is a small-scale version of the same concern.
What cheaper multiples do and do not tell you
FactSet data puts the S&P 500’s forward price-to-earnings (P/E) ratio at 19.0 as of 16 October 2026, against a five-year average of 19.8 and a ten-year average of 19.1. Forward P/E is the share price divided by expected earnings over the next 12 months. An earlier slide from about 22 to 19, while earnings expectations rose, is known as multiple compression.
Cheaper is not the same as cheap, and 19 times is far from distressed levels. If you hold US exposure through global ETFs, the read is to know how much of your portfolio rides on US large-cap tech, not to treat a 12-18 month estimate as a reason to exit. Past performance does not guarantee future results, and projections like GMO’s are subject to market conditions and other risks.
How can you judge new information against your own goals?
Three stories, three different levels of relevance. A repeatable filter keeps you from treating them all the same way.
Before acting on the next headline, run it through four questions:
- Does it change the company’s cash flows? A falling share price is not a falling business.
- Does it touch your goals? If your plan is a 20-year retirement portfolio, a single IPO rarely matters.
- Is it one data point or a pattern? One failed deal is not a trend.
- What does acting cost? Brokerage, tax and the risk of being wrong all count.
Doing nothing is also a decision, and often a deliberate one. Setting your allocation and rebalancing rules in advance removes much of the pressure to respond in the moment.
Applying the test to AI data-centre exposure
Morningstar estimates more than 200 companies operate in AI data centres, and how they are financed varies enormously. That is where Firmus actually points you.
| Option | Main appeal | Main risk | Balance sheet note | Australian access |
|---|---|---|---|---|
| CoreWeave | Direct exposure to AI compute demand | Leverage, customer concentration | Debt about US$35.6B; Q2 adjusted operating income US$128M vs US$640M net interest | US shares or indirect via funds |
| Amazon, Microsoft, Alphabet | Large existing businesses fund AI spending | Heavy capex, monetisation and competition | Cash-generating core operations | US shares or ASX-listed global tech ETFs |
| Oracle | Growing direct AI infrastructure role | Large financing needs | Rising credit-default-swap costs reported | US shares or diversified tech ETFs |
| Australian alternatives | Local exposure, e.g. NEXTDC, Macquarie Technology | Smaller scale, concentration, valuation | Varies by company | ASX shares, Australian funds and ETFs |
The split is operating leverage against business diversification. CoreWeave’s interest bill dwarfs its operating income, while the giants pay for AI out of established profits. A credit default swap is a contract that pays out if a borrower defaults, so rising costs signal growing worry about Oracle’s debt.
These are routes to the same theme with different risks, not a ranking. US shares also bring broker, currency and tax considerations. The lesson from Firmus is to examine how a holding is financed, not to abandon the theme or chase it.
For investors weighing ASX AI infrastructure exposure, the options span colocation, property and network services, each carrying a distinct risk profile within the same structural trend.
What the Firmus episode changes, and what it does not
Firmus failed because investors would not finance its price, debt and execution assumptions on the terms offered. It was not a verdict that AI investing, or the ASX, had lost its worth.
The three stories add up to one discipline. Read headlines for a change in cash flows, not a change in mood. Treat GMO’s warning as a historical relationship worth weighing, not a forecast to trade on. And recognise that the Sharesight data, on average, rewarded patience over activity.
Before the next big headline arrives, write down what would genuinely change your plan. If the news does not meet that bar, you already have your answer.
This article is for informational purposes only and should not be considered financial advice. Investors should conduct their own research and consult with financial professionals before making investment decisions. Forward-looking statements are speculative and subject to change based on market developments and company performance.