Approved Article With Interlinks
Between 2008 and the early 2020s, the world’s major central banks created more money than at any point in recorded history. The Federal Reserve, the European Central Bank, and the Bank of England alone conjured tens of trillions in fresh electronic money and used it to buy bonds. Yet the part of the economy they were most trying to reach, the one where businesses borrow, expand, and hire, largely did not feel the flood.
That gap between scale and effect sits at the heart of quantitative easing, a monetary policy tool that was not a single rescue but a 15-year structural experiment. What began as emergency crisis management became the default response every time growth faltered.
It touched you whether you noticed it or not. It shaped asset prices, mortgage costs, the risk sitting inside pension funds, and the rise of a private credit market that now quietly touches millions of savers and borrowers.
Here is what this piece gives you: a clear map of how the policy actually worked versus how it was described, why it fell short of its broadest goals, and what the unwinding now means for markets and lending conditions. Understanding that difference is the difference between reading a central bank headline and reading what sits behind it.
How quantitative easing actually worked, and what it was trying to do
At its simplest, the mechanism is easy to grasp. A central bank creates new electronic money and uses it to buy assets, mostly government bonds, from banks and financial institutions. Not from governments directly, and not from households.
That distinction matters more than it sounds. The money entered the financial system, not your bank account.
Central banks reached for this tool when conventional policy ran out of road. Once short-term interest rates hit the zero lower bound, meaning they could not realistically be cut any further, rate cuts lost their power. Buying bonds became the crisis-default instrument rather than a routine one.
The scale was staggering. The Fed’s balance sheet peaked around $8.9 trillion. The ECB’s Eurosystem swelled to nearly €9 trillion in 2022, roughly 70% of euro-area GDP. The Bank of England’s reached approximately £1.12 trillion.
The Federal Reserve balance sheet history published by the Fed itself traces how each successive wave of asset purchases expanded its holdings from under $1 trillion before 2008 to the $8.9 trillion peak, providing the primary data source behind the scale comparisons cited across this analysis.
Even after years of shrinkage, these numbers remain enormous, which tells you something important. This was not a temporary patch. It was a structural rewiring of how financial markets are funded, and it has not fully unwound. It may never return to its pre-2008 baseline.
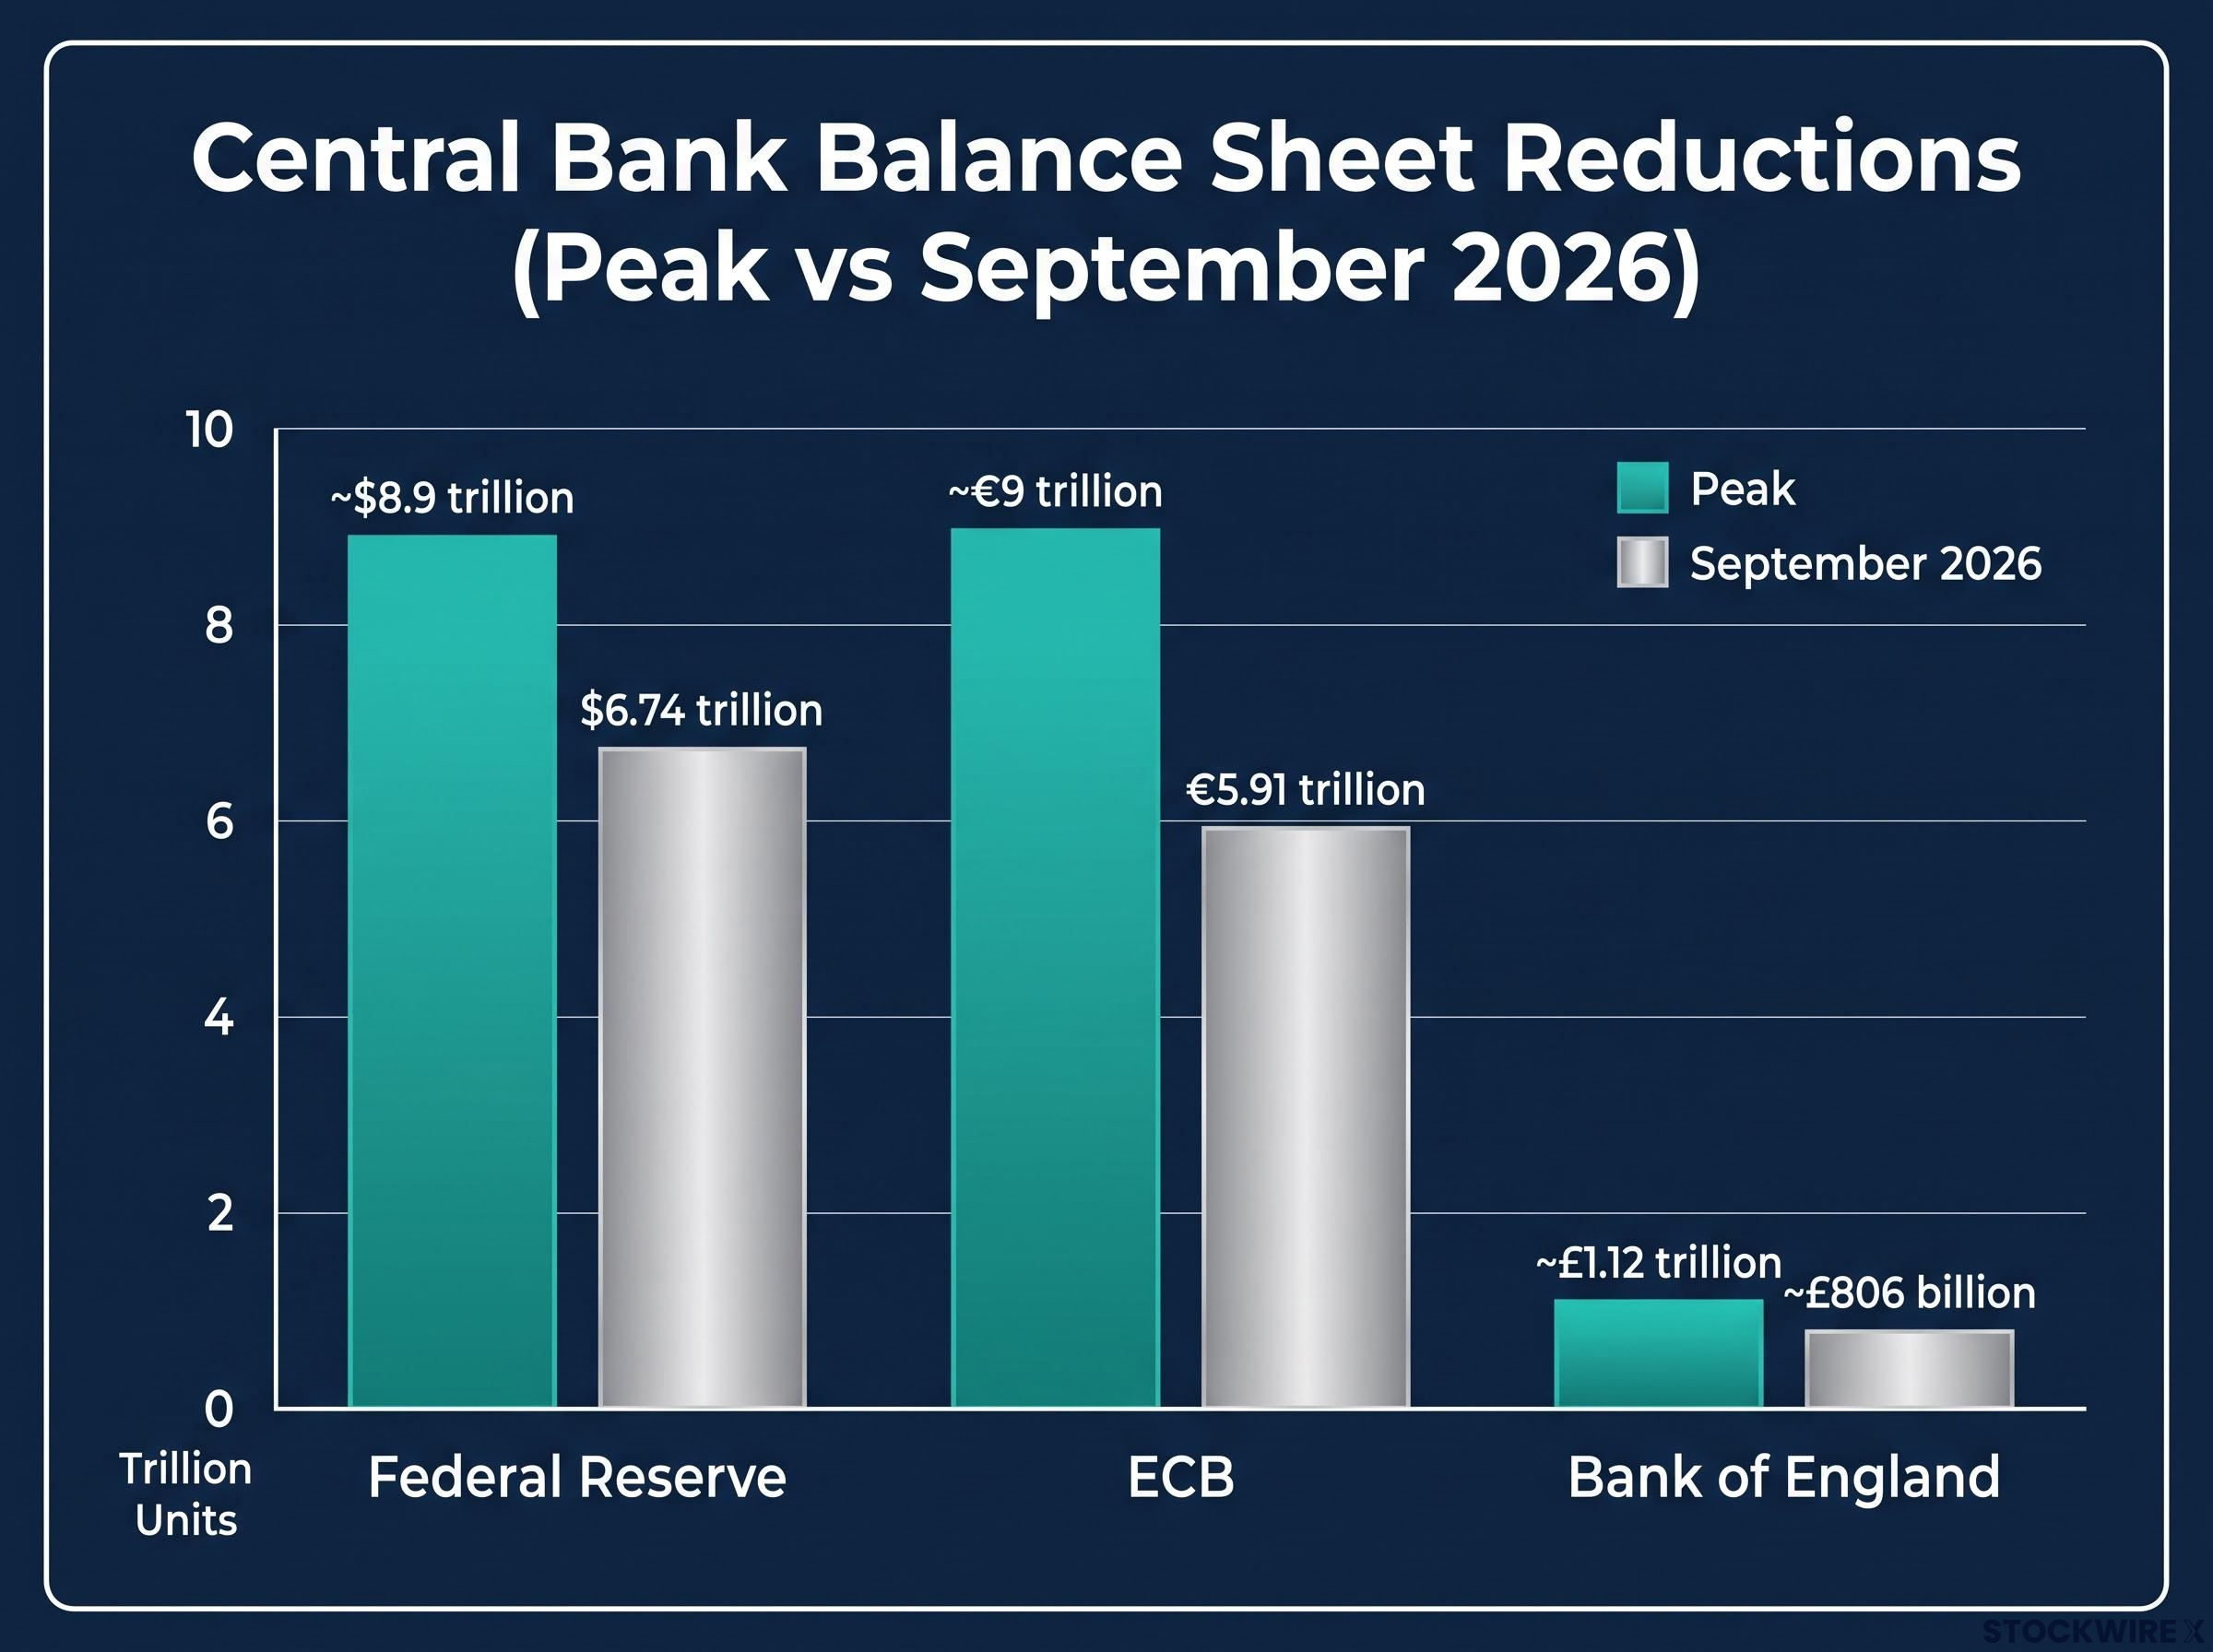
| Central bank | Peak balance sheet | Current (September 2026) | Approximate reduction |
|---|---|---|---|
| Federal Reserve | ~$8.9 trillion | $6.74 trillion | ~$2.2 trillion |
| ECB (Eurosystem) | ~€9 trillion | €5.91 trillion | ~€3.1 trillion |
| Bank of England | ~£1.12 trillion | ~£806 billion | ~£310 billion |
When big ASX news breaks, our subscribers know first
The transmission channels QE relied on
So how was all that money supposed to help the economy? Through four main channels.
The first was yield compression. By buying bonds in bulk, central banks pushed bond prices up and their yields down, dragging borrowing costs lower across the whole economy.
The second was portfolio rebalancing. With safe government bonds now paying so little, investors were nudged toward riskier assets like shares and corporate debt, lifting their prices too.
The third was signalling, reinforcing forward guidance that rates would stay low. The fourth was straightforward asset-price support.
Notice what these four channels share. They all operate through financial markets, not through a direct injection of credit into your local business. That single fact explains much of why the real-economy effects were more limited than the policy’s billing suggested.
Why the bank lending channel largely failed to materialise
The logic seemed airtight. Cheaper borrowing costs, banks flush with reserves, investors chasing yield: surely lending to households and businesses would surge. The money was there. The models predicted it. And yet the loans did not follow as designed.
The first reason is uncomfortable for the theory. Banks make money on the spread between what they pay for short-term funding and what they charge for long-term loans. QE deliberately flattened that spread by crushing long-term yields, which reduced the incentive to lend at exactly the moment it was trying to encourage lending.
Yield curve dynamics complicate the QT picture further: a steepening curve that widens term spreads can actually loosen credit supply by improving bank net interest margins, creating conditions where QT’s nominal tightening coexists with genuine easing in lending incentives.
The second reason was timing. After the global financial crisis, banks were focused on rebuilding their capital adequacy, meaning the cushion of capital regulators require them to hold against losses. So the excess reserves QE created were absorbed into strengthening balance sheets rather than pushed out as new loans.
The third reason emerged from the data itself. UK bank-level studies, including work published in the BoE Quarterly Bulletin and by CFM/LSE researchers, found no evidence that banks receiving deposits from non-bank financial institutions during gilt purchases increased lending to households or businesses.
Japan told the same story earlier. Federal Reserve research into Japan’s 2001-2006 programme found banks simply swapped central-bank liquidity for interbank borrowing once conditions stabilised, rather than extending fresh credit.
The reasons the lending channel stalled stack up like this:
- QE flattened the yield curve, shrinking the profit margin that motivates new lending
- Post-crisis banks prioritised capital repair over expanding loan books
- Excess reserves stayed trapped in the financial sector rather than reaching borrowers
- Where deposits did flow to banks, studies found no matching rise in loans to the real economy
That does not mean QE achieved nothing. Its stimulus arrived, just through a different door.
The Bank of England’s own evaluation found that early programmes lowered yields by roughly 50-100 basis points, delivering an estimated GDP boost of around 0.5-0.8%. The macro-financial channel worked even where the lending channel did not.
For you, the practical read is this. The recovery after 2008 showed up powerfully in asset prices and financial conditions, but far more slowly in small-business credit access or wage growth. If you ever wondered why markets healed faster than paycheques, this mismatch is a large part of the answer.
What QE redirected capital toward, and the structural costs it left behind
If banks were not lending the money out, where did the capital go? It drifted, steadily and structurally, toward asset appreciation and private markets.
As bank lending margins compressed and post-crisis regulation tightened, borrowers who once relied on banks turned elsewhere. That gap was filled by private credit, meaning loans made directly by investment funds rather than banks.
The growth has been extraordinary. Private credit was a niche of roughly $250-$380 billion in 2010. By the mid-2020s it had become a multi-trillion-dollar industry, and estimates now range widely depending on who is counting.
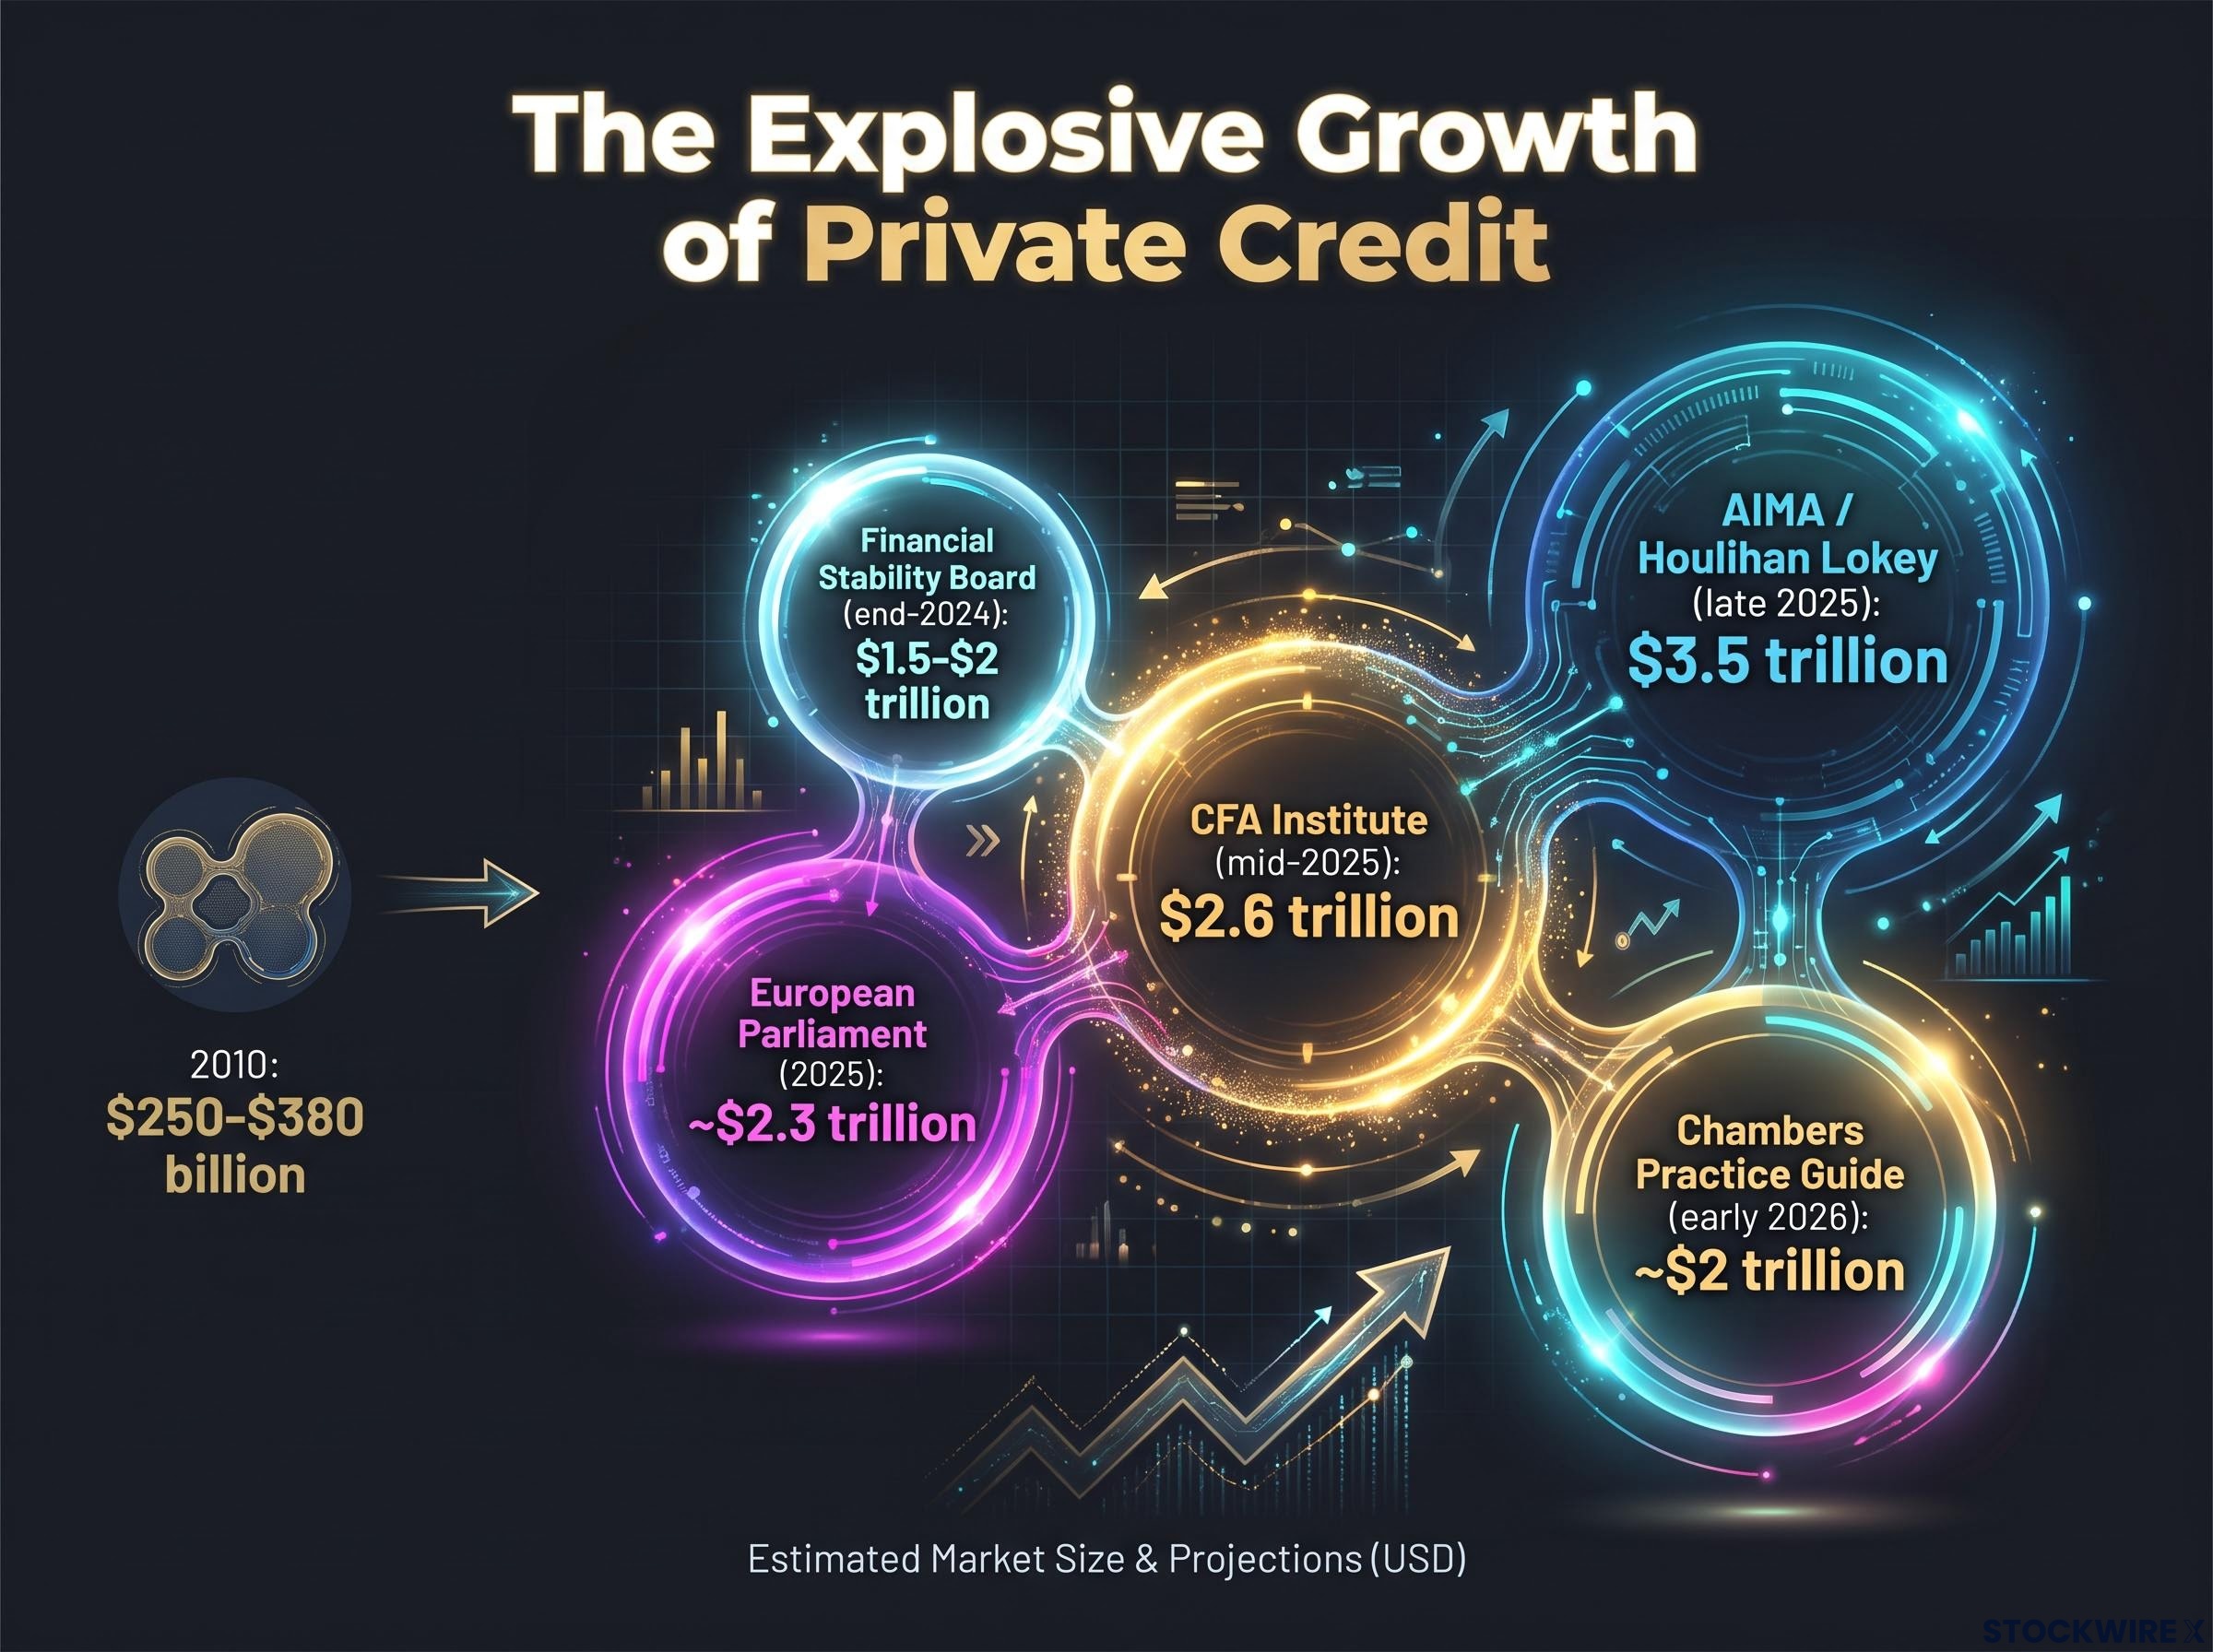
| Source | Estimated private credit AUM (date) |
|---|---|
| Financial Stability Board | $1.5-$2 trillion in lending (end-2024) |
| European Parliament | ~$2.3 trillion (2025) |
| CFA Institute | $2.6 trillion (mid-2025) |
| Chambers Practice Guide | ~$2 trillion (early 2026) |
| AIMA / Houlihan Lokey | $3.5 trillion (late 2025) |
This market is partly the shadow of QE, growing into the lending space that compressed bank margins vacated. It now carries systemic importance that was never part of any central bank’s original design, and if you hold pension savings, insurance products, or credit funds, some of your exposure now sits here.
The ECB spillover assessment of approximately 425 billion euros concentrated across European insurers, banks, and pension funds shows that the regulatory perimeter concern is not abstract: a severe shock in private credit could produce second-round losses through equity revaluations that exceed the initial direct hits.
The structural costs: inequality, zombie firms, and misallocated capital
The distributional side is the part policymakers rarely advertised. QE mechanically lifted the prices of equities, housing, and bonds, and because asset ownership is heavily concentrated among wealthier households, the gains flowed disproportionately to them. Wage earners and savers, meanwhile, watched deposit returns stay near zero. European Parliament reviews and ECB analyses have acknowledged that sustained purchases created bond scarcity and inflated valuations above fundamentals.
There is a second, quieter cost. BIS and IMF researchers have warned that prolonged ultra-low rates kept unviable “zombie” firms alive on cheap credit, delaying restructuring and dragging on productivity. Capital that might have flowed to more dynamic businesses was propping up dying ones instead.
The unwinding challenge, and why the UK and Japan show two very different exit paths
The experiment is not over. The exit is underway, and it is proving far harder than the entry.
Quantitative tightening (QT) is QE in reverse. Central banks let bonds mature without reinvesting the proceeds, or actively sell holdings back to the market, draining reserves and returning bonds to private investors. In theory, a clean rewind. In practice, the financial system built around a decade of cheap central-bank money cannot re-absorb that debt at speed.
The three principal risks make the caution understandable:
The Fed’s MBS portfolio illustrates this structural lock-in with unusual clarity: low-coupon bonds purchased during the pandemic era now carry extension risk that pushes meaningful runoff into the mid-2030s, making a full return to pre-2008 balance sheet levels a multi-decade project rather than a near-term policy option.
- Liquidity shortages, as reserves drain out of the banking system
- Yield-curve pressure, as private buyers demand higher returns to hold the returning bonds
- Balance-sheet losses, as interest costs on central bank liabilities rise faster than income from older, low-yielding assets
The UK offers the cautionary tale. In 2022, QT timing collided with leveraged pension strategies known as liability-driven investment, and the resulting stress in the gilt market forced the Bank of England into emergency bond-buying that directly contradicted its own tightening stance. The BoE has since trimmed its balance sheet from £1.12 trillion to roughly £806 billion, a reduction of around £310 billion, but the episode showed how quickly an accident can happen even at a modest pace. The Fed’s own 2019 repo market stress made the same point on the other side of the Atlantic.
Japan’s uniquely complex exit from equity ownership
Japan’s problem is different, and stranger. The Bank of Japan did not just buy government bonds. It bought private risk assets, accumulating enormous holdings of equity ETFs and property trusts.
As of January 2026, the BoJ held ETFs worth ¥37.18 trillion at book value and J-REITs worth ¥654.7 billion. Its annual disposal target for ETFs sits at just ¥330 billion. At that pace, the unwind will take decades, not years.
That caution appears to be working so far. Despite ETF sales beginning in January 2026, the MSCI Japan and TOPIX indices outperformed the MSCI World Index between 31 December 2025 and 16 September 2026, suggesting the slow drip has not weighed materially on Japanese equities.
The takeaway for you is that QT is not simply QE played backwards. Whether you hold gilts, pension assets, or global shares, the pace of this unwind will shape borrowing costs and valuations for years. This is live market risk, not background macroeconomics.
This article is for informational purposes only and should not be considered financial advice. Investors should conduct their own research and consult with financial professionals before making investment decisions.
What QE’s mixed legacy means for the next crisis
The honest verdict is neither triumph nor failure. QE prevented deflation, supported employment through brutal downturns, and measurably lowered yields, delivering that estimated 0.5-0.8% GDP boost the Bank of England credits to its early programmes. But it also entrenched wealth inequality, fed a $2.3-$3.5 trillion private credit market that barely existed before, and left an exit problem with no clean historical template.
The forward implication is sobering. With all three major central banks still in QT as of September 2026, and balance sheets still multiple times their pre-2008 size, there is less room to reload without deepening the distortions already in place.
Treasury-led money creation through short-term bill issuance absorbed by commercial banks now operates as a parallel liquidity channel outside central bank balance sheets, meaning the QE era did not end cleanly in 2022 but shifted its locus rather than its fundamental dynamic.
The key things to carry forward:
- QE worked through asset prices and financial conditions, not through bank lending
- It shifted enormous credit risk into private markets outside the regulatory perimeter
- The gains flowed disproportionately to asset owners
- Unwinding it is slow, fragile, and unprecedented in scale
Here is the practical takeaway. When a central bank announces QE in the next crisis, the useful question is not “will this boost lending?” It is “what assets will this inflate, and who owns them?” That is the channel through which the effect will actually reach you.
Past performance does not guarantee future results. Financial projections are subject to market conditions and various risk factors.