
There is a second round of quantitative easing running through the global financial system right now. No central bank has announced it. No press conference has framed it. Yet the money-creation engine is humming, and it is running through a channel most investors are not watching.
You have heard of quantitative easing, the central-bank programme of buying assets to inject money into the economy. What you may not have heard is that a functionally similar process is already underway again, this time driven by government treasuries rather than central banks.
The backdrop makes it puzzling. US gross federal debt crossed $40 trillion in August 2026, 10-year Treasury yields are sitting near 4.8%, and nominal GDP across the US, UK, Japan, and the eurozone is expanding at its fastest pace since the mid-1980s.
If growth is strong and rates are already high, why are governments leaning harder into short-term borrowing, and what does that do to everything else you own? After reading this, you will have a working model of why bond yields remain structurally elevated, why equity valuations face persistent headwinds, and what the slowing global liquidity cycle actually signals for how you position a portfolio. Consider it a lens that most market commentary skips straight past.
How governments are creating money without calling it QE
Start with the plumbing, because the mechanic is where the whole picture holds together.
When a government funds its spending by issuing short-term Treasury bills (government debt that matures in a year or less) and commercial banks buy those bills, something quietly expands. The banks add the bills to their balance sheets and, in doing so, create new deposits. That adds to the broad money supply without a single central-bank asset purchase.
Bank of England research on money creation confirms that commercial banks generate the vast majority of money in circulation by expanding their balance sheets when they purchase assets, including government debt, a process that adds to broad liquidity independently of any central-bank action.
Why do banks want short-term government paper in the first place? Because short-duration assets match their deposit liabilities, the money customers can withdraw on demand. T-bills fit that need almost perfectly, which creates steady structural demand for them.
The Treasury-led money creation described here operates alongside, not instead of, central bank rate mechanics, which govern how overnight policy rates transmit through bank funding costs into mortgages, business loans, and ultimately every asset class a portfolio holds.
Here is the three-step mechanic in plain terms:
- The Treasury issues short-term bills to fund spending.
- Commercial banks absorb those bills and expand their balance sheets, creating new deposits.
- The government spends the proceeds, releasing those deposits into the real economy.
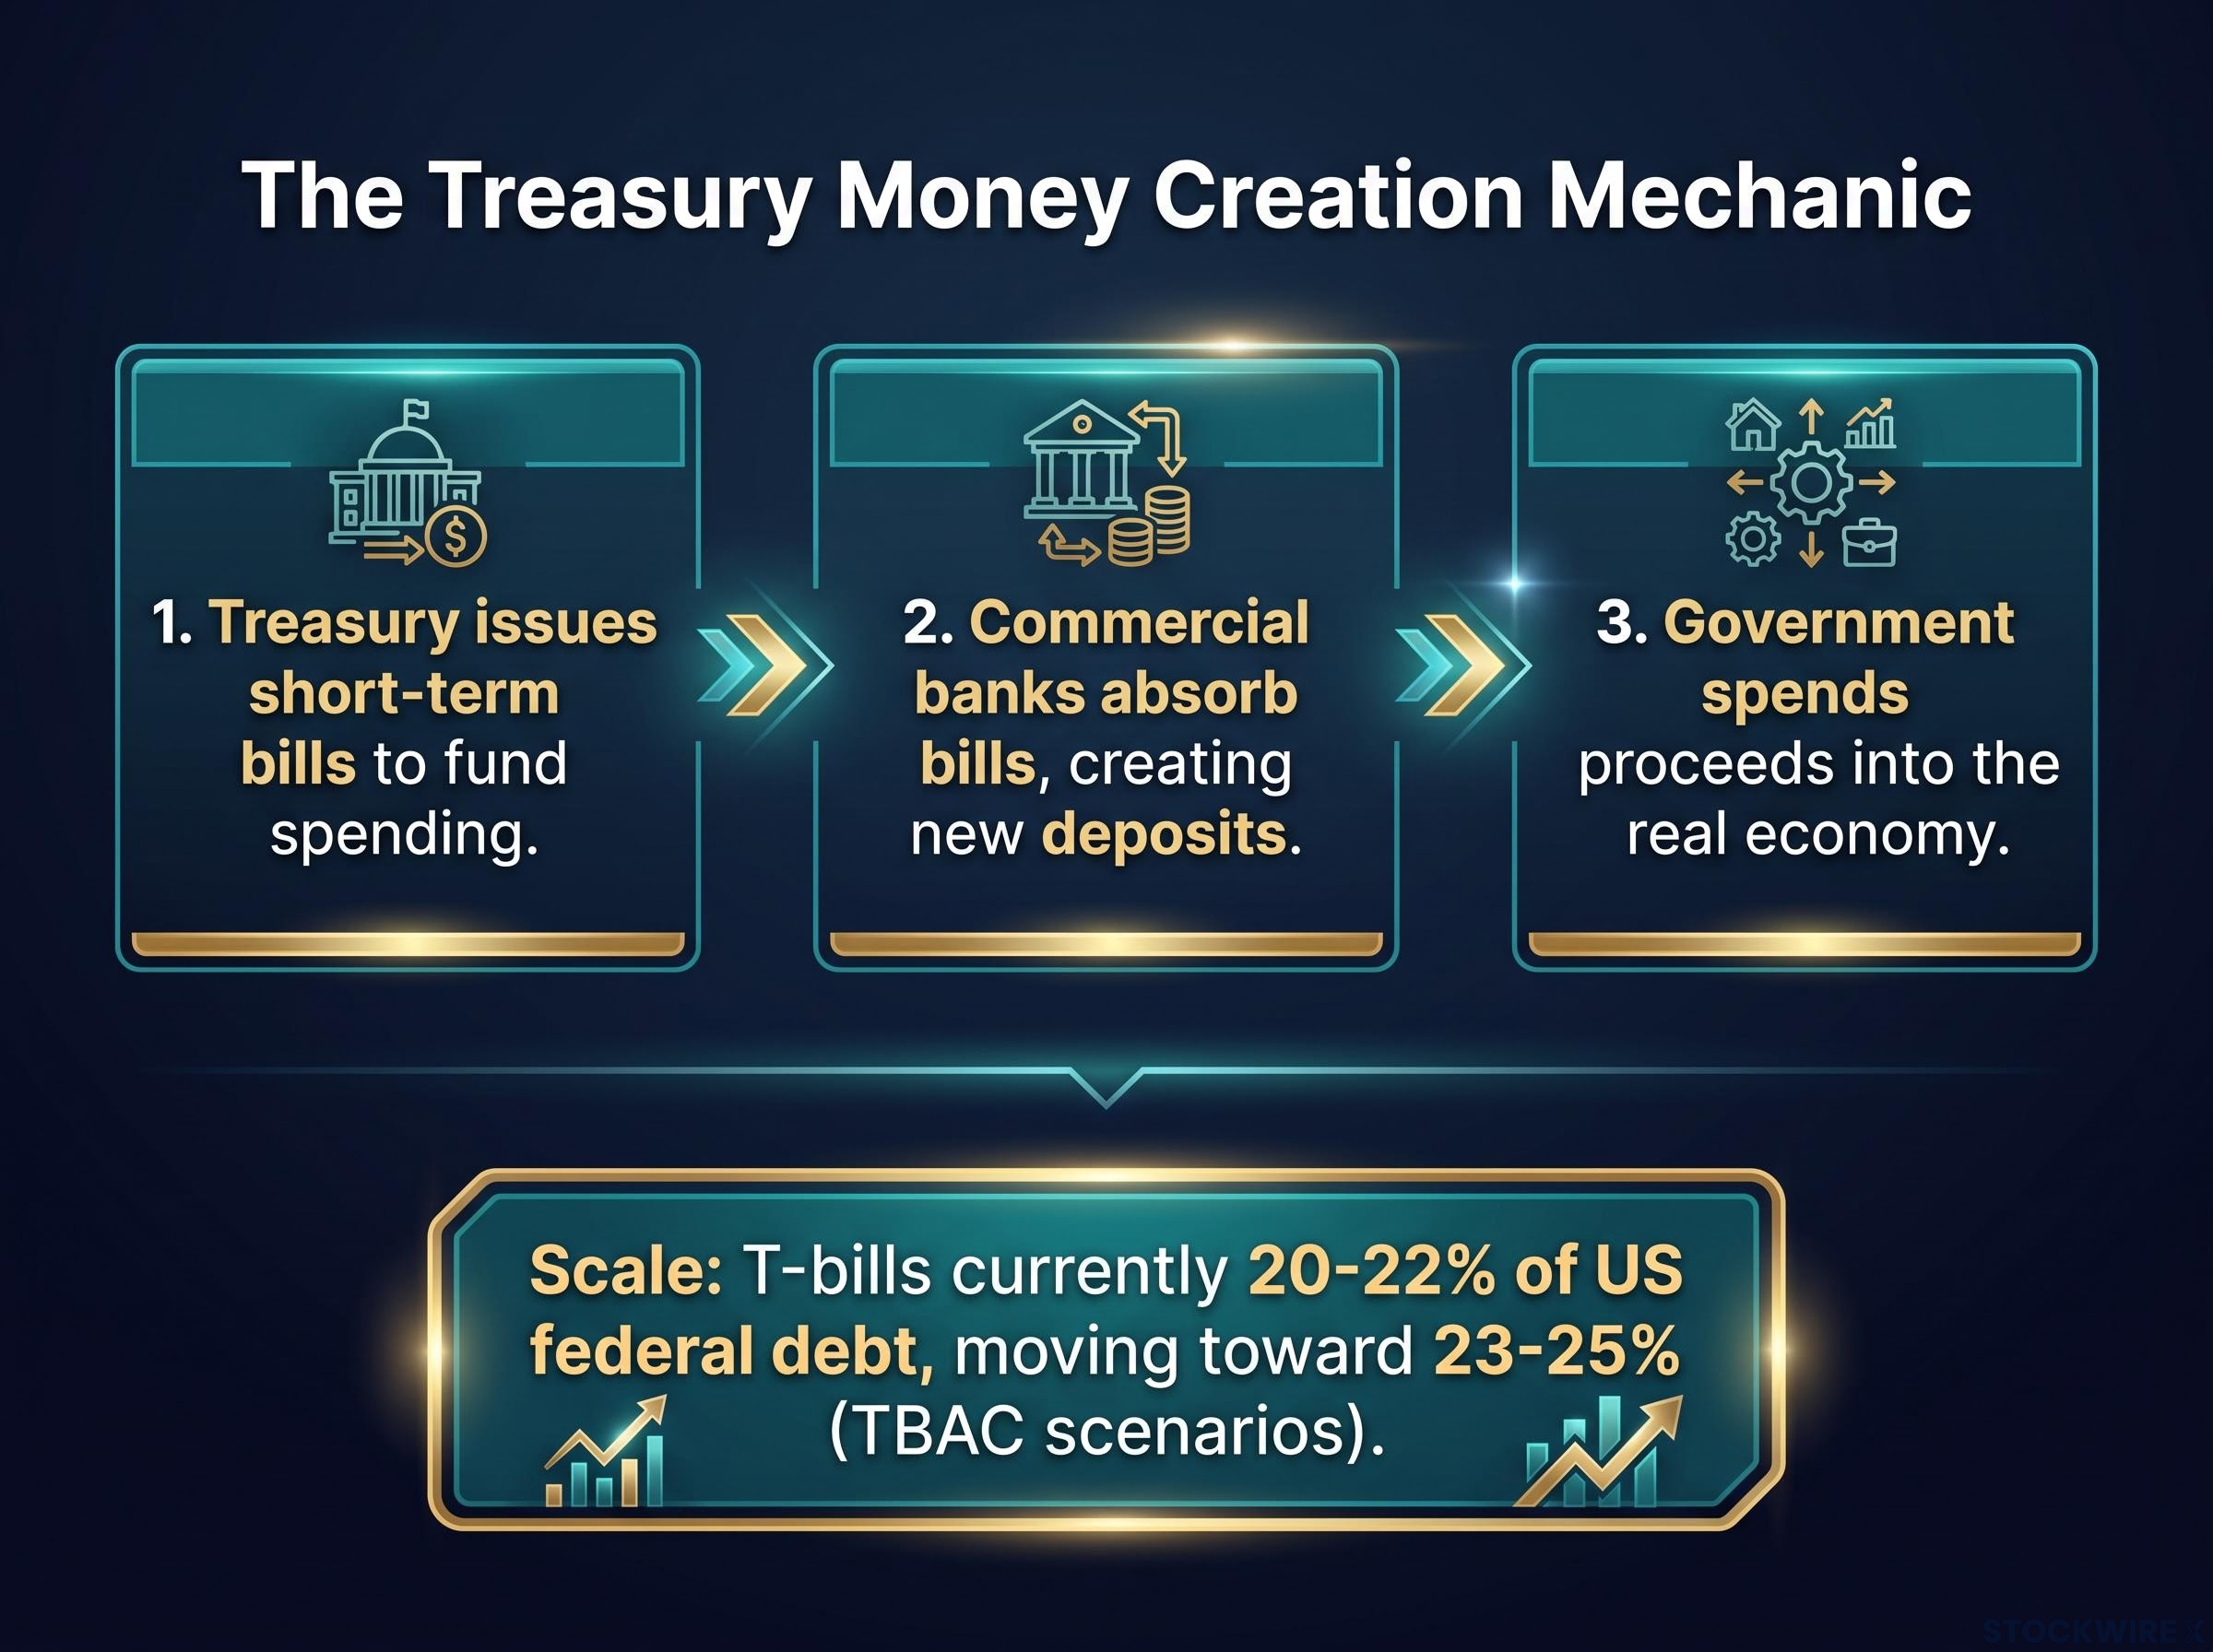
Empty step, no. That third step is where the Treasury General Account (TGA), the government’s own cash account, does its work. Heavy bill issuance followed by rapid fiscal spending pushes reserves and deposits into the banking system, functioning mechanically much like traditional QE.
The scale is already meaningful. Treasury bills currently represent roughly 20-22% of outstanding marketable US federal debt. Treasury Borrowing Advisory Committee (TBAC) modelling shows scenarios pushing that share toward 23-25% to fund ongoing fiscal packages.
How money actually gets created Research from the Bank of England and the Bank of Canada confirms that most money in a modern economy is created as commercial bank deposits when banks make loans or buy assets. When banks absorb newly issued government debt, they expand their balance sheets and add to broad liquidity, even if the central bank’s policy rate never moves.
One caveat matters, and central-bank analysts and IMF economists are right to press it. Because bank reserves are now remunerated (banks earn interest on them) and banks operate under strict liquidity and capital rules, this mechanism often reallocates money rather than explosively expanding it. Treating it as pure money-printing risks overstating its immediate inflationary punch compared with historical episodes.
The practical takeaway for you is simple. If you are watching central-bank balance sheets to judge whether QE is on or off the table, you are watching the wrong instrument. The action has moved to the Treasury’s issuance calendar.
When big ASX news breaks, our subscribers know first
Why nominal GDP growth is widening the gap between where yields are and where they should be
Now layer growth on top of the plumbing, and a strange gap opens up.
Nominal GDP, which is real growth plus inflation, is running at its fastest pace since the mid-1980s across the US, UK, Japan, and the eurozone. Solid real activity is stacking on top of persistent inflationary pressure. China is the exception, with its bond yields trending down rather than up.
Here is where it gets uncomfortable. Bond yields across the US, Japan, and Europe are sitting roughly one percentage point below where nominal growth rates would theoretically place them.
| Economy | Approx. Nominal GDP Growth | 10-Year Yield (approx.) | Estimated Gap |
|---|---|---|---|
| United States | Fastest since mid-1980s (mid-single digits, estimated) | 4.8% | Yield ~100bps below nominal growth |
| United Kingdom | 4.1% year-on-year (Q2 2026) | Elevated (estimated) | Yield below nominal growth |
| Japan | 4.3-4.7% year-on-year (Q2 2026) | Elevated (estimated) | Yield below nominal growth |
| Eurozone | Mid-single digits (estimated) | Elevated (estimated) | Yield below nominal growth |
The 10-year US Treasury yield reached 4.818% in early September 2026 before settling near 4.786%. The UK posted nominal GDP growth of 0.8% quarter-on-quarter and 4.1% year-on-year in Q2 2026. Japan ran at roughly 1.2-1.3% quarter-on-quarter, an annualised 5-5.5%.
Eurostat Q2 2026 GDP growth data places eurozone quarterly expansion at 0.6%, part of the same nominal growth acceleration that is widening the gap between where long-dated sovereign yields sit and where rising economic output would theoretically price them.
The central tension Bond yields across the US, Japan, and Europe sit approximately 100 basis points below the level current nominal GDP growth would dictate. That gap is not an accident.
The mid-1980s comparison sharpens the point. Back then, inflation-wary bond investors, the so-called bond vigilantes, drove yields above nominal growth and slowed the economy. Today the relationship is flipped: yields sit structurally below nominal growth, and the market has not yet forced that gap to close.
US fiscal health metrics beyond the headline debt-to-GDP figure, particularly the interest-to-revenue ratio currently running in the 17-19% range, offer a more precise read on how much fiscal headroom the Treasury actually has before markets force a reckoning with the nominal-growth-to-yield gap described here.
The term premium tells the same story. That is the extra yield investors normally demand for holding longer-dated bonds, and it is tracking well below its long-run average of about 1.5 percentage points. Analysts expect it to revert toward that average over the coming years.
What this tells you is that current yields are not really a market-clearing price. They are a managed variable. Policymakers appear to be tolerating below-equilibrium rates to keep debt refinancing manageable, and that political choice is what keeps your bond holdings afloat while quietly eroding your real returns. It also changes how you should read a long-duration bond position: it may be a carry trade against a policy ceiling rather than a clean bet on rate normalisation.
What the global liquidity cycle’s deceleration actually signals
Yields and growth give you a snapshot. The liquidity cycle gives you the direction of travel, and that is what turns a static picture into a positioning decision.
Global liquidity moves in a rhythm of roughly five to six years, closely tied to the way global debt maturities cluster in that same five-to-six-year range. Right now the cycle is in late-cycle deceleration: the growth rate of liquidity has peaked and is slowing, even though the absolute level continues to rise gradually.
That distinction matters. You are not standing at a cliff edge. You are on a long downslope, and the risks that accumulate here are late-cycle risks that build quietly rather than snap suddenly.
Liquidity has two places to go: financial markets, where it tends to settle first, and the real economy, which absorbs it during expansions. Right now, strong real economies are competing directly with financial markets for the same pool of liquidity.
That competition explains the odd mix you are seeing. Bond markets are weak, commodity prices are recovering as the real economy pulls liquidity toward it, and equity markets are caught in a tug-of-war between the two.
Fragile market conditions in mid-2026, characterised by narrow AI-linked index leadership, concentrated passive exposure among the five largest US names, and private credit stress building outside the equity volatility signal, create the precise late-cycle environment where the pace of a yield move matters far more than its ultimate level.
Three historical episodes frame where this leaves you:
- Mid-1980s bond vigilantes: yields ran above nominal growth and cooled the economy; today the dynamic is inverted, leaving an open question about whether markets eventually force yields up to close the gap.
- Japan’s lost decade: early QE-style operations stabilised markets but could not manufacture nominal growth without deeper structural repair, a reminder that liquidity can prevent crises but not conjure growth.
- Post-GFC QE: central banks acted as a direct backstop, which is precisely the feature today’s version lacks.
How today’s setup differs from post-GFC QE
The structural difference is the backstop. After the 2008 crisis, central banks ran QE directly and stood behind the market, expanding both central-bank and commercial-bank balance sheets while absorbing stress themselves.
Today’s Treasury-led version places large volumes of government paper onto bank balance sheets without that safety net. That makes the system more sensitive to strains in the repo market (the short-term funding market where banks and investors borrow against securities overnight) and to sudden bank-funding shocks.
The implication is sharper than it first appears. A disorderly unwind of leveraged basis trades, set off by an inflation scare or a rapid yield move, is arguably a more acute systemic risk right now than the absolute level of yields itself. Knowing the cycle is decelerating rather than reversing tells you the positioning choices you make now on duration, risk assets, and cash will compound over the next 12-24 months in the direction the cycle is already pointing.
What elevated yields and late-cycle liquidity mean for equity and bond positioning
This is where the framework earns its keep. Not with a buy-or-sell verdict, but with a way to read the tug-of-war so you can apply your own view to it.
Start with the valuation side. A 100-basis-point rise in real 10-year Treasury yields has historically been associated with roughly a 7% drop in the S&P 500 forward price-to-earnings multiple, the ratio of share price to expected future earnings.
The valuation headwind, made concrete Every 100-basis-point increase in real yields has historically knocked around 7% off the S&P 500’s forward P/E multiple. That compression is often already at work even when the index level looks resilient.
That is the catch. Market resilience frequently masks multiple compression, because the P/E derates before earnings estimates come down. The headline index can look steady while the valuation quietly gives ground.
Now the counterweight. Earnings expectations keep rising, led heavily by US technology and AI-related spending. And because many large corporations locked in fixed-rate, long-maturity debt, moderately higher yields do little direct damage to their earnings per share, leaving the net effect roughly neutral.
Read those two facts together and the equity story clarifies. The headwind is primarily a valuation-multiple story, not an earnings story. That is a distinction generic “rates are bad for stocks” commentary tends to blur.
| Factor | Direction of Pressure | Current Assessment |
|---|---|---|
| Yield level (valuation multiple impact) | Negative | ~7% P/E compression per 100bps rise in real yields |
| Earnings trajectory | Positive | Rising, led by US tech and AI spending |
| Policy support offset | Positive | US administration using liquidity management to support markets |
| Bond supply dynamics | Negative | Persistent deficits meeting diminishing demand |
| Pace of yield moves | Negative (if rapid) | Speed, not level, is the primary risk-asset threat |
On the bond side, the supply picture is heavy. US gross federal debt crossed $40 trillion in August 2026, with over $32.4 trillion held by the public. Persistent deficits meeting weakening demand raise the risk of disorderly yield moves rather than a steady drift, and it is the speed of a yield move, not its precise level, that most threatens risk-asset stability.
There is a partial offset worth noting. The current US administration is motivated to support equity market levels and is using liquidity management as a primary policy tool, which cushions some of the valuation headwind. In Europe, quality growth companies have seen broad-based multiple compression from macro uncertainty and rising rates, and some analysts frame that earnings-versus-valuation disconnect as a potential long-run entry point rather than a signal of earnings trouble.
The takeaway is to keep two risks separate that are usually lumped together: valuation risk in equities, which is real and rate-sensitive, and earnings risk, which is currently modest. And recognise that your bond allocation is more exposed to the pace of rate moves than to today’s yield level.
What to watch as the cycle moves toward its next inflection
You now have the framework. The point of an explainer is to keep working after the date it was written, so here are the signals that will tell you when these dynamics are shifting, well before the financial press labels the turn.
- The T-bill share of outstanding debt. This is the primary gauge of Treasury-led liquidity intensity. If the share moves materially toward or above 25% (TBAC scenarios point at 23-25%), the money-creation mechanic intensifies; if it falls back, the liquidity impulse from this channel fades.
- Term premium repricing. Watch for a reversion toward the long-run average of roughly 1.5 percentage points. That move would imply meaningfully higher yields and is the most likely mechanism to finally force the nominal-growth-to-yield gap to close.
- Repo market and basis-trade stress. History shows it is sudden funding dislocations, not gradual yield drift, that precede sharp risk-asset corrections in late-cycle conditions. This is your systemic-stress tripwire.
- China’s yield trajectory. Falling Chinese bond yields against a backdrop of global yield pressure point to a different domestic liquidity dynamic. A reversal of that trend would carry cross-asset implications worth tracking.
Read those four together and you have a way to see the late-cycle deceleration described here begin to tip toward an actual inflection, rather than reacting after the move is priced in. The T-bill share and term premium are your leading indicators; repo stress is coincident to early-lagging; China is a tail-risk qualifier.
Repo market dynamics are evolving structurally alongside the Treasury-led liquidity cycle: Deutsche Bank projects that intraday tokenized repo could drain roughly $250 billion in precautionary reserves from the Federal Reserve, a shift that would materially alter the plumbing through which short-term funding strains propagate when leveraged basis trades unwind.
That is the practical value here. You leave not with a prediction but with a short checklist that turns understanding into something you can act on quarter after quarter.
This article is for informational purposes only and should not be considered financial advice. Investors should conduct their own research and consult with financial professionals before making investment decisions.
Past performance does not guarantee future results. Financial projections are subject to market conditions and various risk factors. These statements are speculative and subject to change based on market developments.