Most investors assume that when the 10-year Treasury yield rises, financial conditions are tightening. At his recent press conference, Fed Governor Kevin Warsh repeatedly framed rising long-term yields as the market doing the tightening work, suggesting long rates were effectively substituting for Fed action. That assumption is plausible on the surface. It is also almost certainly wrong in the way it is being applied right now.
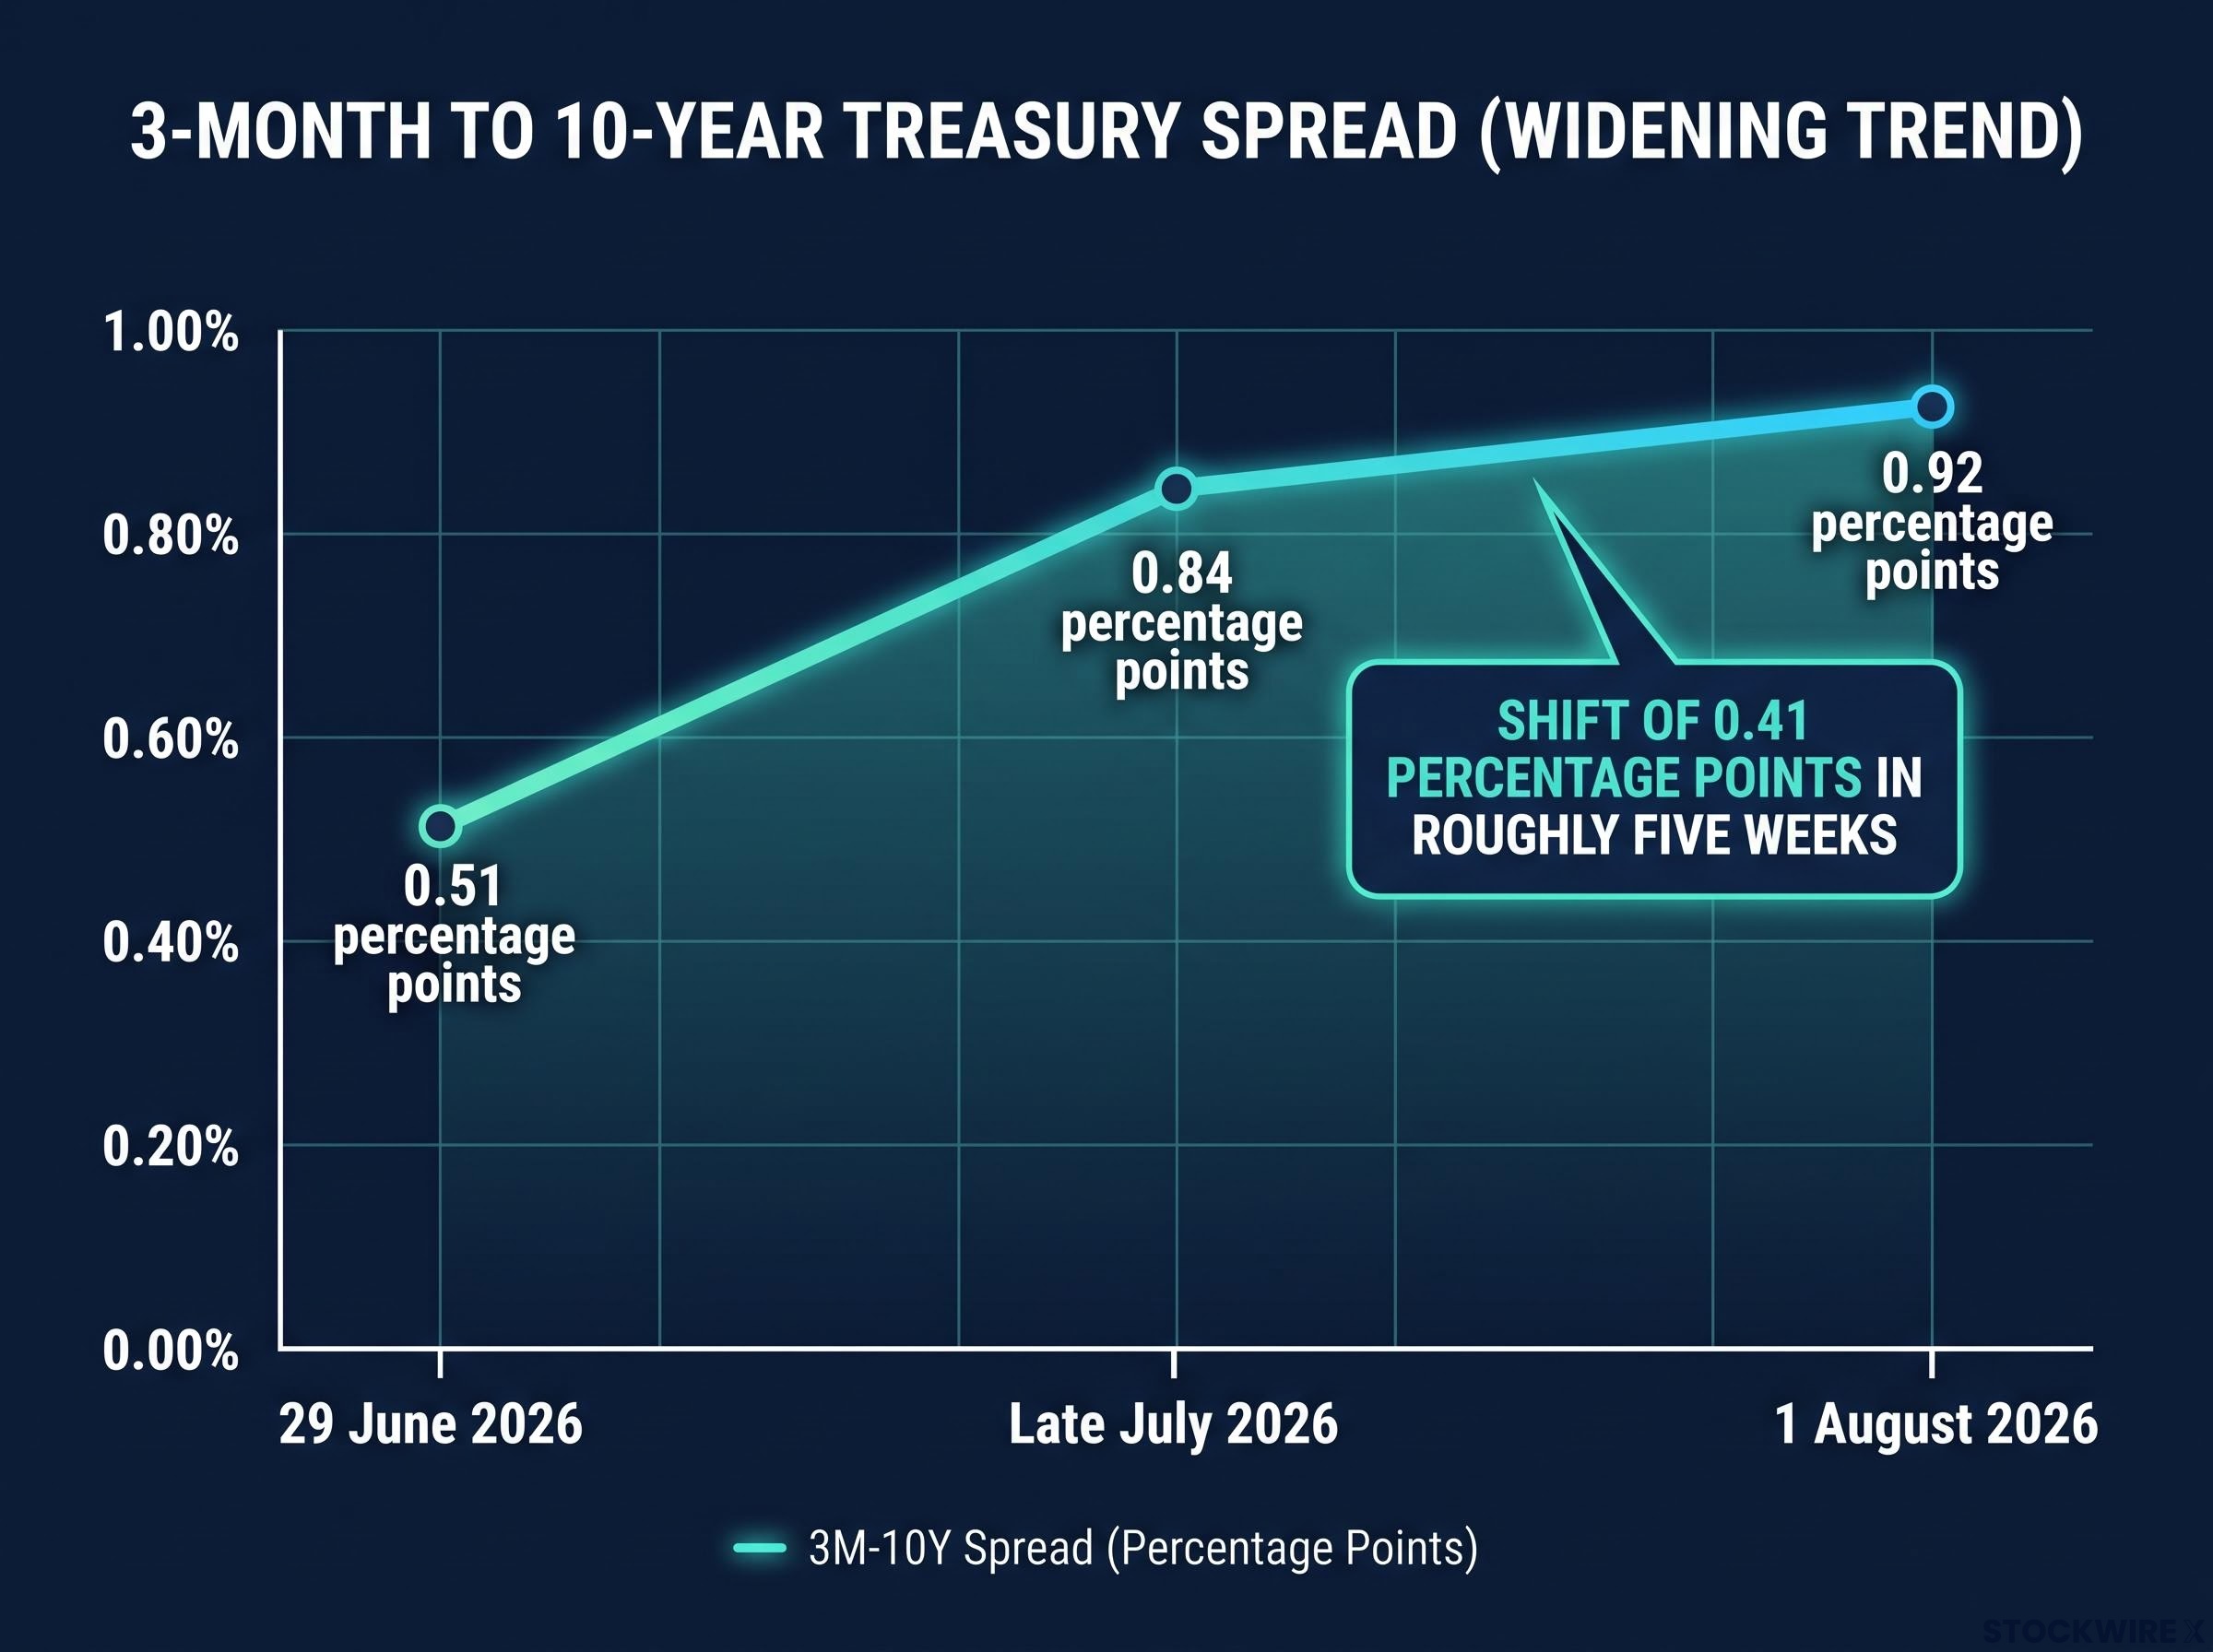
Over recent weeks, the 3-month to 10-year Treasury spread has widened considerably, moving from 0.51 percentage points in late June to 0.92 percentage points by early August 2026. That shift represents a notable steepening, and understanding its direction is essential: a curve moving this way signals easing credit supply conditions, not tightening ones. The confusion has consequences: if policymakers misread a steepening curve as evidence that conditions are already tight, they may hike short-term rates further, compressing the very spread that is currently keeping credit supply healthy.
Here is how the yield curve actually works from a bank lending perspective, why a steeper curve tends to loosen credit supply rather than tighten it, what the real policy risk looks like from here, and which signals to watch for early warning that this risk is becoming more than theoretical.
The yield curve just widened sharply: what the numbers actually show
The 3-month to 10-year Treasury spread, the specific metric the Federal Reserve Bank of New York tracks in its recession probability model, has moved sharply over the past month. The sequence tells the story:
- 29 June 2026: The spread sat at 0.51 percentage points
- Late July 2026 (close of the Fed’s July meeting day): The spread had widened to 0.84 percentage points
- 1 August 2026: The spread reached 0.92 percentage points
That is a shift of 0.41 percentage points in roughly five weeks. This is not background noise.
The Federal Reserve Bank of New York uses the 3-month to 10-year Treasury spread specifically in its 12-month recession probability model. When this spread inverts, meaning short-term rates exceed long-term rates, it has preceded every US recession in recent decades. The direction of this metric carries institutional weight.
A curve moving this fast demands a clear read on what direction it is actually pointing. The conventional interpretation, that rising long-term yields equal tighter financial conditions, is the one most commentary reaches for. It is also the one that breaks down once you understand how banks actually make lending decisions.
When big ASX news breaks, our subscribers know first
How a yield curve actually works, and why the 3-month to 10-year spread is the one that matters
A yield curve plots Treasury yields across different maturities. In a normal environment, longer maturities carry higher yields than short-term bills, because investors demand a premium for locking their money up for longer. When you plot those yields on a chart from shortest to longest maturity, the line slopes upward.
The 3-month to 10-year spread is the critical measure because it reflects the arithmetic that drives bank lending decisions: short-term rates determine what banks pay to obtain funds, while long-term rates determine what they earn when they deploy those funds as loans. That relationship carries a specific, decades-long track record as a recession signal, and the New York Fed publishes a formal probability model built around it.
The Fed’s actual control levers are narrower than most commentary assumes: the Fed directly sets only the overnight interbank rate, while mortgage rates, business loan rates, and consumer credit rates respond to market forces that the Fed influences but does not dictate.
| Curve shape | Typical 3m-10y spread | Historical signal |
|---|---|---|
| Steep, normal | Clearly positive (+0.5% to +1%+) | Credit supply tailwind; markets expect ongoing growth |
| Flat | Near 0% | Late-cycle signal; bank margins compress; slower growth ahead |
| Inverted | Negative | High recession risk within 12-24 months; has preceded every recent US recession |
Net interest margin: the profit motive that drives bank lending
Net interest margin is the return a bank generates by borrowing at short-term rates and deploying those funds as loans priced off long-term rates. Think of it as the spread a bank captures on each loan it writes: the difference between its cost of funds and the yield it earns on what it lends out.
A wider spread between short and long rates translates directly into a larger margin on every new loan originated. As that margin expands, writing new loans becomes an increasingly attractive use of capital, which encourages banks to extend more credit rather than less.
Why a steeper curve means looser credit conditions, not tighter ones
Start with the part that is genuinely true. Higher long-term interest rates do make mortgages, corporate bonds, and long-term borrowing more expensive for households and firms. If you are refinancing a home or issuing corporate debt, a higher 10-year yield raises your cost. That is a real demand-side headwind, and it should not be dismissed.
But it is only half the equation.
When long rates rise relative to short rates, something else happens simultaneously: the term spread widens, bank net interest margins improve, and each new loan becomes more rewarding to originate. Banks respond to that improved economics by making more credit available, not less. Lending conditions ease on the supply side even as borrowing costs rise on the demand side.
A flat or inverted curve reverses that logic entirely. When short rates approach or exceed long rates, the margin available on new loans shrinks toward zero or disappears. Banks do not require a regulatory directive to pull back from lending; the profit case for making new loans simply evaporates. That deterioration in lending economics is why inverted curves are followed, with a lag, by genuine credit contraction and eventually recession.
| Dynamic | Who it affects | Effect on financial conditions |
|---|---|---|
| Higher long-term rates (demand side) | Borrowers: households, firms | Tighter: borrowing costs rise |
| Steeper curve (supply side) | Lenders: banks, credit institutions | Looser: lending margins widen, more credit supplied |
Both things are simultaneously true. Higher long rates raise borrowing costs, and a steeper curve loosens credit supply. The net effect depends on which force dominates. That is why a single-axis reading of “higher rates equal tighter conditions” is the conceptual error at the centre of this debate.
Fisher Investments views the current monetary environment as modestly accommodative, noting that broad money supply is expanding at a pace consistent with mid-1990s norms, a period not associated with overheating or runaway inflation. A gently upward-sloping curve in this context is seen as a backdrop that supports continued lending activity and economic expansion rather than one that signals constraint.
When you understand the demand-versus-supply distinction, you can evaluate future rate commentary with a sharper framework than most financial media provides. Most headlines report the level of the 10-year yield. The shape of the curve between short and long rates tells you more about what is actually happening to the availability of credit in the economy.
What happens if the Fed misreads the curve and hikes too aggressively
The risk is not that conditions are already tight. The risk is that a misdiagnosis of current conditions could cause the Fed to create the tightening it incorrectly believes already exists. Those are not the same situation, and the distinction matters.
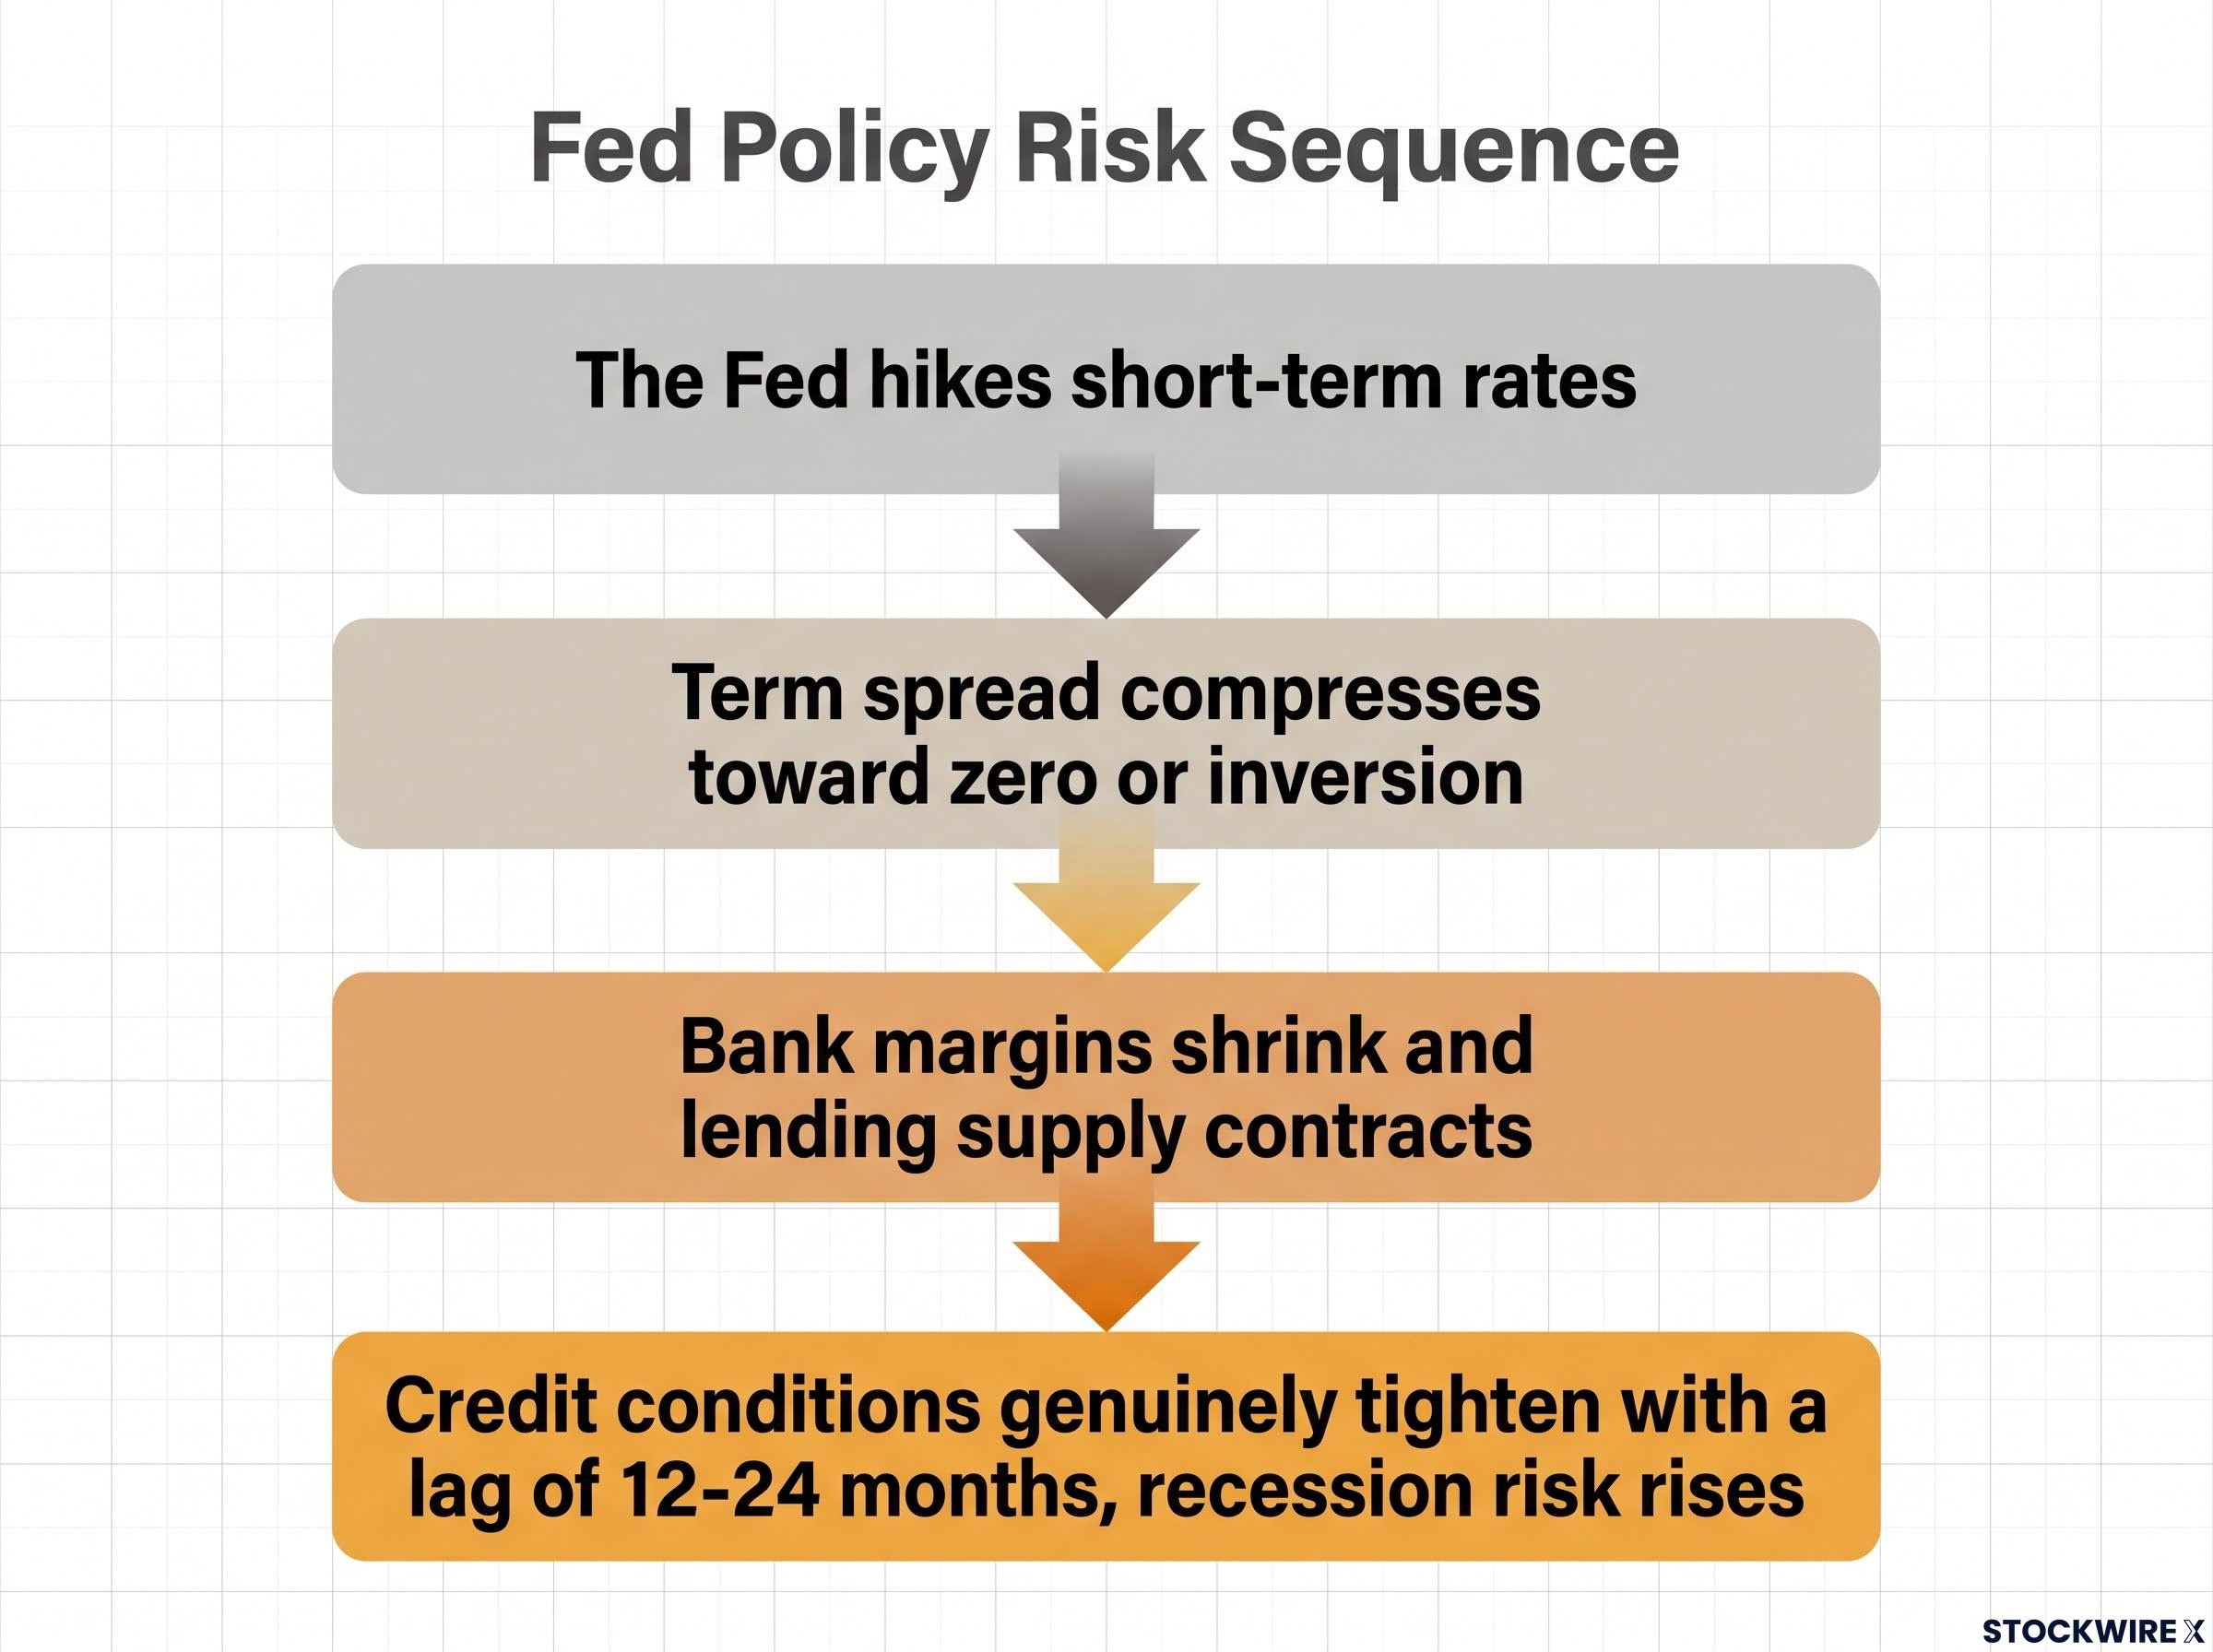
The specific sequence works like this:
- The Fed hikes short-term rates further, citing high long-term yields as evidence that financial conditions are already tight and more restraint is needed
- The term spread compresses toward zero or inversion, as the 3-month yield rises while long rates may not rise proportionally
- Bank margins shrink and lending supply contracts, because the economics of writing new loans deteriorate
- Credit conditions genuinely tighten with a lag of 12-24 months, and recession risk rises materially through the same mechanism the yield curve literature has documented for decades
This is precisely the chain of cause and effect that has preceded past downturns. When Warsh characterises rising long rates as “doing the Fed’s tightening,” the relevant question is whether policymakers are also considering the term spread and its impact on bank margins, or whether they are looking only at the absolute level of long-term yields.
Warsh’s rejection of forward guidance, formalised at his first FOMC press conference in June 2026, means that the specific language used in policy statements now carries greater interpretive weight than it did when the Fed anchored expectations through published rate projections.
Is this a forecast or a warning?
Fisher Investments frames this scenario as a risk worth monitoring rather than an outcome to expect, and makes clear that it does not presently justify changes to investment positioning. The risk is projected as potentially relevant over a one-to-three-year horizon from mid-2026.
The value of identifying this risk now is not in making portfolio changes today. It is in knowing what signals would confirm that the risk is becoming more than theoretical, so you are not caught by surprise if the rhetoric begins translating into actual rate decisions.
Three signals worth watching before the next Fed decision
If the policy risk outlined above is a possibility rather than a probability, the question becomes: what would change that assessment? Three specific, observable indicators give you the earliest read.
- The direction of the 3-month to 10-year spread. A constructive reading: continued steepening or a spread that holds clearly above zero, indicating healthy bank margins and credit supply. A concerning reading: renewed flattening toward zero, particularly if driven by short-rate hikes rather than falling long rates. The direction of the spread matters as much as the current level. A spread narrowing from 0.92 back toward 0.30 would be a fundamentally different signal than the current trajectory.
- Fed rhetoric on long rates versus the term spread. A constructive reading: Fed statements that distinguish between the level of long-term yields and the spread between short and long rates, acknowledging the role of bank margins. A concerning reading: commentary that collapses the distinction between high long-term yields and tight conditions, focusing solely on borrowing costs while overlooking what the spread between short and long rates means for banks’ willingness to lend.
The red flag to watch for is Fed language that judges the degree of monetary tightness purely by the height of long-term yields, with no reference to how the shape of the curve, specifically the gap between funding costs and lending rates, affects credit supply. When that framing appears in policy statements, it suggests the conceptual error Fisher Investments has identified may be actively shaping rate decisions.
- Bank lending standards. A constructive reading: lending standards that remain steady or ease alongside a steep curve, consistent with the supply-side logic described above. A concerning reading: if lending standards tighten despite a steep curve, that may indicate credit stresses unrelated to the yield curve shape, such as regulatory pressure, capital concerns, or deteriorating credit quality. The Federal Reserve’s Senior Loan Officer Opinion Survey is the primary source for this data.
The Federal Reserve Senior Loan Officer Opinion Survey is conducted quarterly and asks senior lending officers at domestic banks and US branches of foreign banks about their credit standards and loan demand across major loan categories, making it the most direct official window into whether supply-side lending conditions are actually tightening or easing.
Tracking these three signals gives you earlier visibility into whether the policy risk is materialising than waiting for headline rate commentary to catch up.
For readers wanting to understand why the bond market has displaced equity prices as the primary forcing mechanism on White House policy, our deep-dive into how bond markets now set the policy agenda covers how yield levels at 4.66%-4.67% on the 10-year simultaneously tighten mortgage rates, corporate borrowing costs, and federal debt servicing.
What the curve is telling you now, and what would have to change for that to shift
With the 3-month to 10-year spread at 0.92 percentage points and moving in a steepening direction, the current signal is one of modestly supportive credit conditions and meaningfully lower near-term recession risk compared with the inversion period of recent years. That reading is reinforced by broad money supply data expanding at a pace in line with mid-1990s growth rates, a benchmark that Fisher Investments considers consistent with non-inflationary expansion rather than overheating.
Recession probability signals in mid-2026, including the Sahm Rule reading of 0.10 and Conference Board LEI data, sit well below the thresholds historically associated with imminent contraction, which is consistent with the yield curve’s current steepening trajectory.
The genuine tension remains. Higher long-term rates do raise borrowing costs for households and businesses, and that demand-side headwind is real. But the net effect of a steepening curve has historically favoured credit expansion, not contraction, because the supply side tends to dominate when the spread is this clearly positive.
The curve’s signal remains constructive as long as the spread stays well above zero and is not being compressed by aggressive short-rate hikes. That is the condition to watch, not the absolute level of the 10-year yield. If you track the spread rather than the headline rate, you will have a clearer read on financial conditions than most of the commentary around you.
This article is for informational purposes only and should not be considered financial advice. Investors should conduct their own research and consult with financial professionals before making investment decisions. These statements are speculative and subject to change based on market developments and policy decisions.