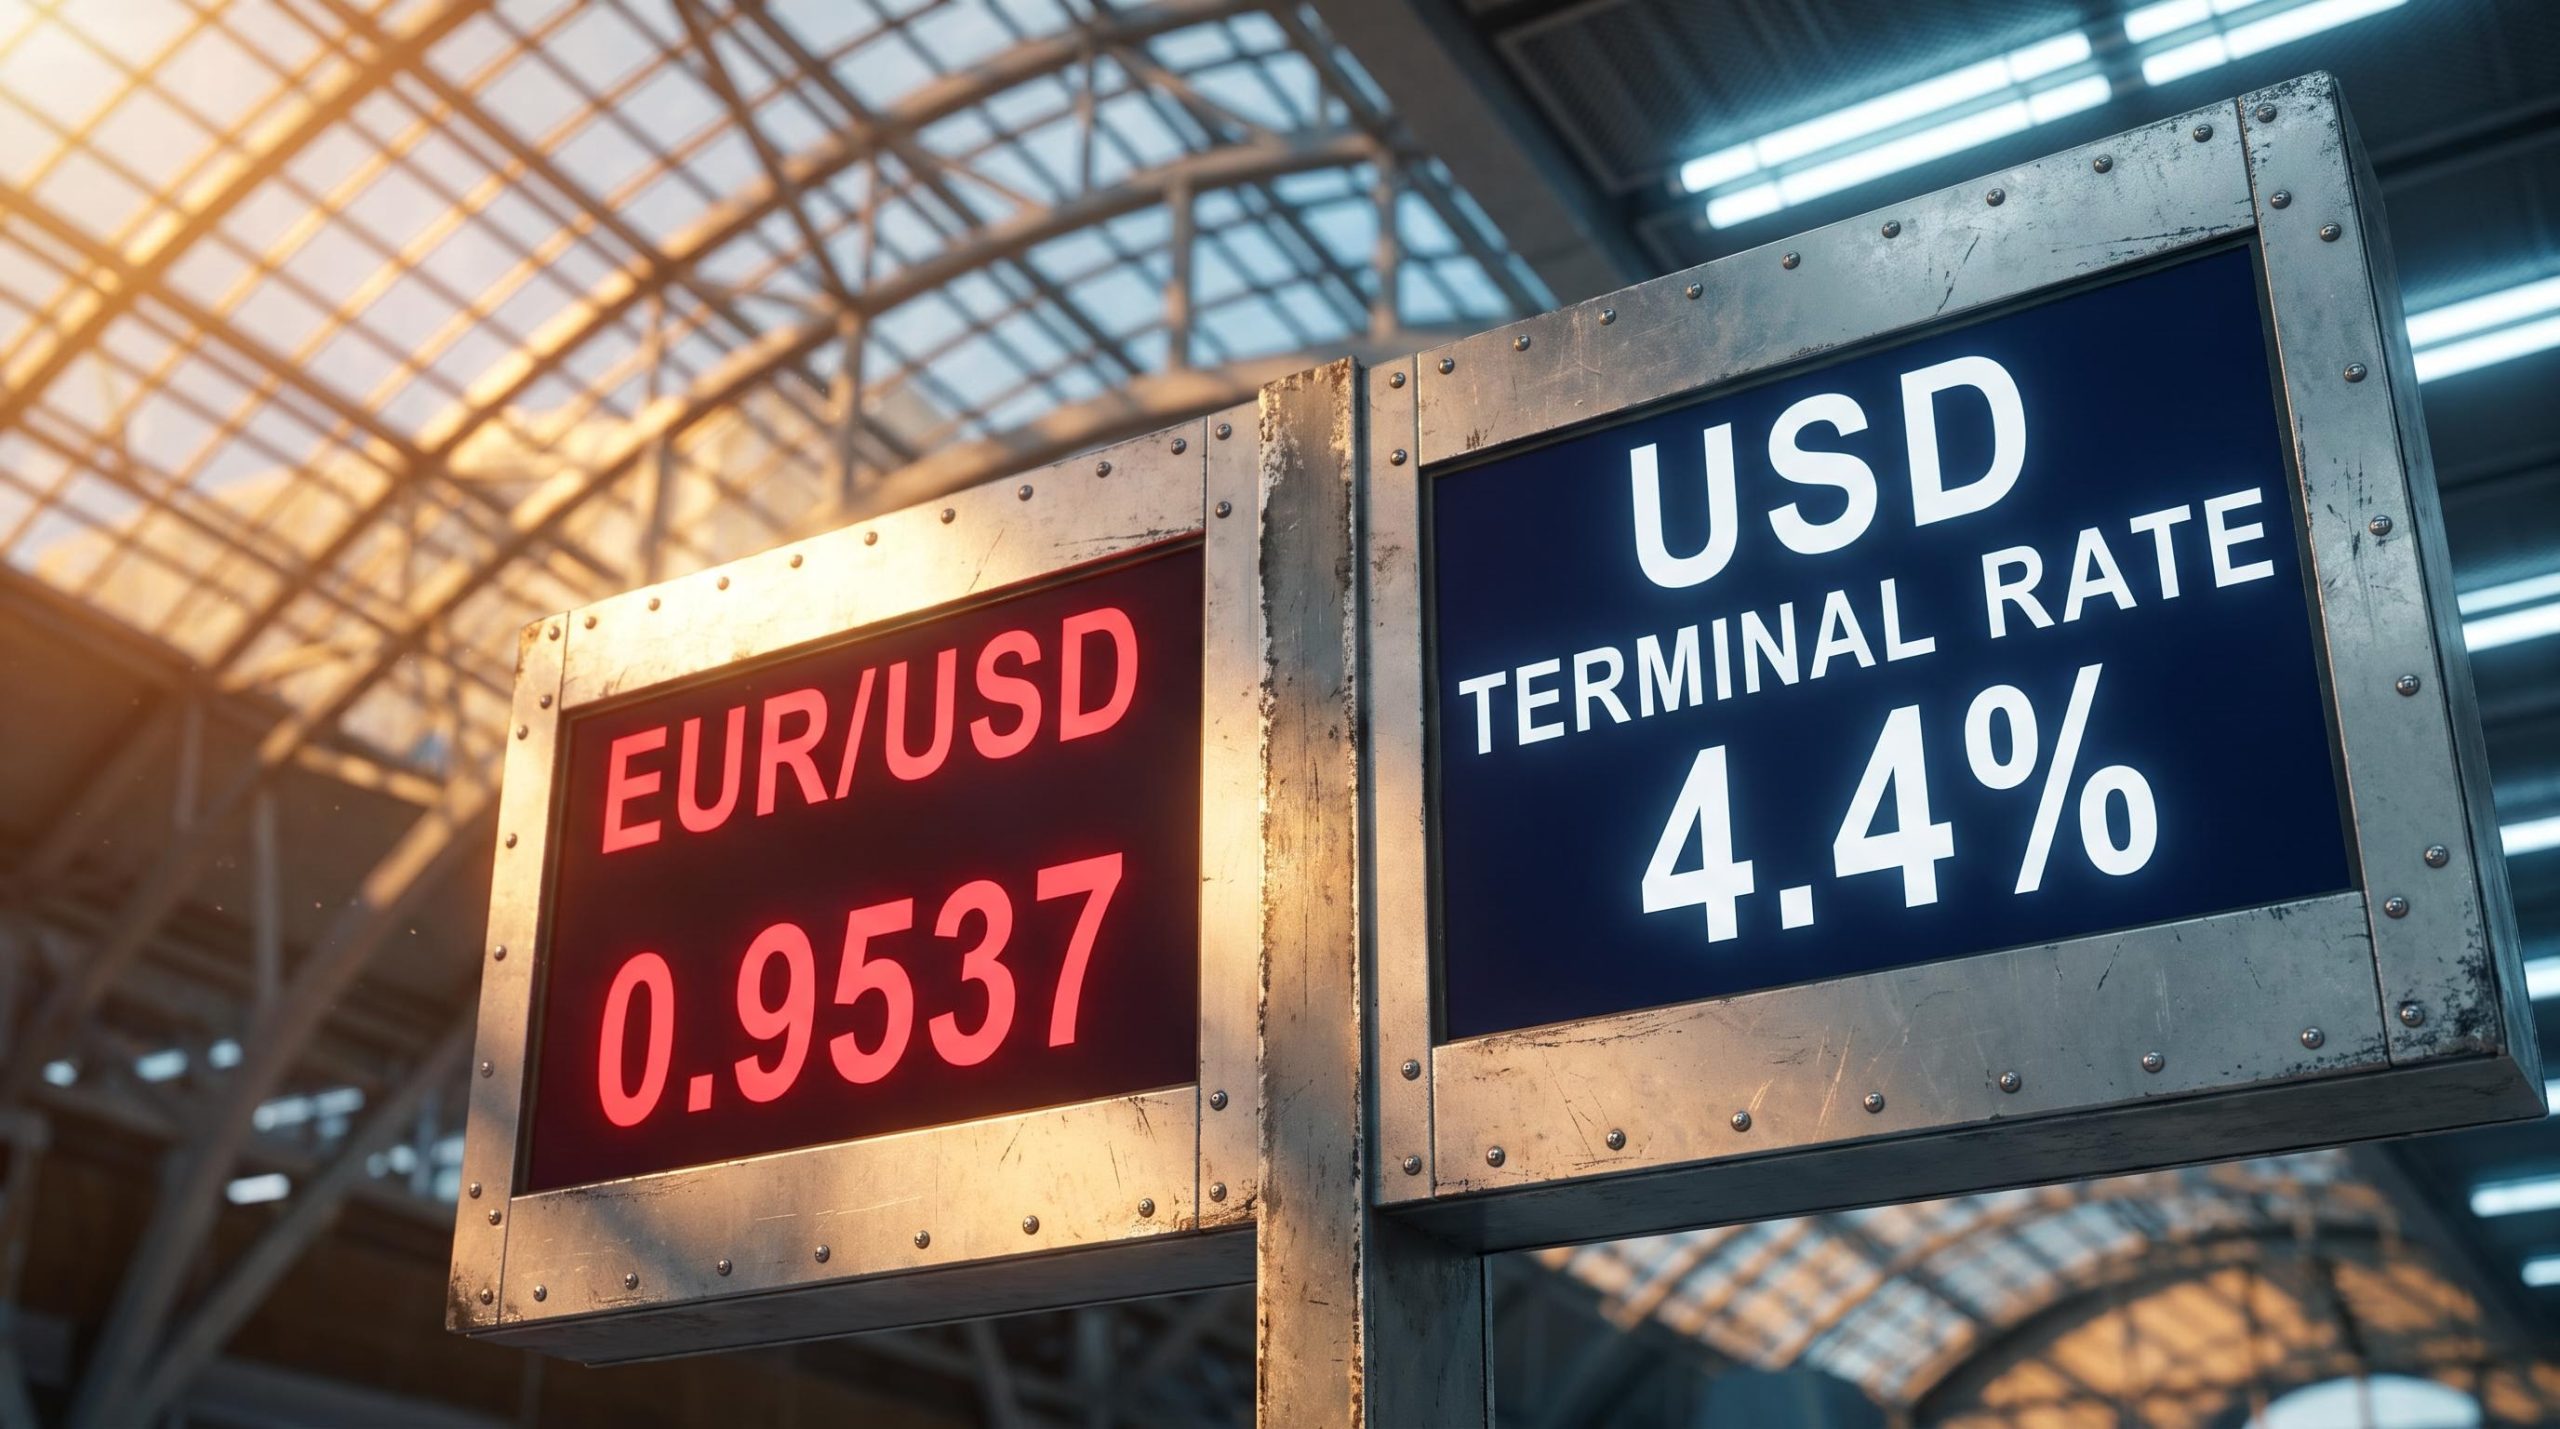
In July 2022, the euro bought less than a dollar for the first time in twenty years. The EUR/USD rate printed below 1.00, and suddenly the single currency that had traded above $1.20 just a year earlier was worth less than the greenback.
That moment looked like a shock. It was actually the visible surface of a deeper force: two of the world’s most powerful central banks, the Federal Reserve and the European Central Bank, moving in different directions at different speeds. This dynamic, known as central bank divergence, is not unique to 2022. It is a recurring structural driver of currency markets, and understanding how it works gives you a tool you can apply to any future rate cycle.
Here is what you will take away. After this piece, you will be able to look at any central bank rate decision and understand, in concrete terms, why the currency of the more hawkish bank tends to strengthen, what the actual mechanism is, and, just as importantly, where that logic breaks down.
What central bank divergence actually means for a currency
Start with something you already understand: money flows toward better returns. If one bank pays you more interest than another for holding the same amount of cash, and both feel equally safe, you move your money to the higher payer. Currencies work on the same intuition at global scale.
Central bank rate mechanics transmit through a floor-ceiling corridor: interest paid on reserves sets the floor, a standing lending facility sets the ceiling, and open market operations fine-tune overnight liquidity, making the policy rate the upstream variable that simultaneously reprices currencies, bonds, and equities the moment guidance shifts.
Central bank divergence is what happens when two major central banks are not just charging different interest rates, but are moving those rates in meaningfully different directions or at materially different speeds. The absolute level matters less than the trajectory. A gap that is widening changes expected returns in real time, and that is what moves capital.
Here is the part that trips most people up. Divergence works through expectations and forward guidance, not just through the rate decisions that actually land. Central banks publish projections, hold press conferences, and choose their words carefully, and markets reprice currencies based on where they think rates are heading before a single basis point is delivered.
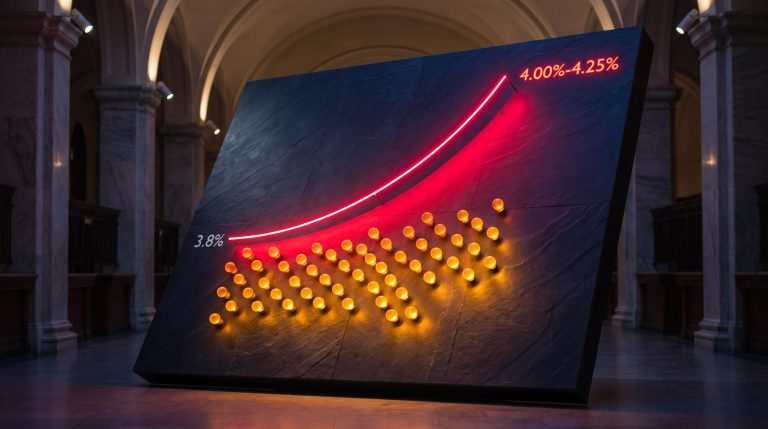
Consider the contrast in September 2022. The Fed’s updated projections showed a median expected federal funds rate of 4.4% for end-2022 and 4.6% for end-2023, revised sharply upward from June figures of 3.4% and 3.8%.
The dot-plot jump that moved the dollar In a single quarter, the Fed’s own projection for end-2022 rates leapt from 3.4% to 4.4%. Markets did not wait for those rates to arrive. They repriced the dollar upward immediately, because the expectation itself is the asset.
The ECB, meanwhile, refused to play the same game. President Christine Lagarde described a meeting-by-meeting, data-dependent approach and explicitly declined to pre-commit to future hikes. One bank was signalling a clear upward path; the other was keeping its options open. That divergence in signalling, not just in rates, is what markets seized on.
Divergence reaches currency markets through three main channels:
- Carry trade reallocation: investors borrow in the lower-yielding currency and park capital in the higher-yielding one, selling the former and buying the latter.
- Forward expectations repricing: markets adjust the currency the moment guidance shifts, ahead of any actual rate change.
- Portfolio flow rebalancing: large institutions rebalance bond and asset holdings toward the economy offering better risk-adjusted returns.
The theoretical backbone here is uncovered interest parity (UIP), the idea that capital should flow toward the higher-yielding currency until expected returns across currencies equalise. Once you see the mechanism, currency moves stop looking like random noise and start reading as signals.
When big ASX news breaks, our subscribers know first
How the Fed and ECB’s 2022 decisions drove EUR/USD toward parity
September 2022 gives you a live divergence event, unfolding in sequence, with the two banks making decisions eight days apart. Watch the tone before you watch the exchange rate.
The Fed’s signal
On 20-21 September 2022, the Fed raised its benchmark by 75 basis points, lifting the target range to 3.00%-3.25%. Chair Jerome Powell delivered inflation-first messaging, stating that price pressures remained too high and the Committee was strongly committed to bringing inflation back to its 2% goal.
The rate hike itself was not the main event. The market-moving element was the upward-revised dot plot, which told investors the Fed intended to keep pushing rates higher and hold them there longer than previously flagged. That forward path, not the single decision, is what repriced the dollar.
The ECB’s counterpart decision
The ECB had moved first, on 8 September 2022, with its own 75-basis-point hike, taking the deposit facility rate to 0.75%. On paper, the two banks had done the same thing.
The difference was in the guidance. Lagarde’s meeting-by-meeting language read as cautious next to the Fed’s explicit forward commitments, reflecting a central bank trying to fight inflation while protecting a growth-vulnerable economy exposed to the energy crisis.
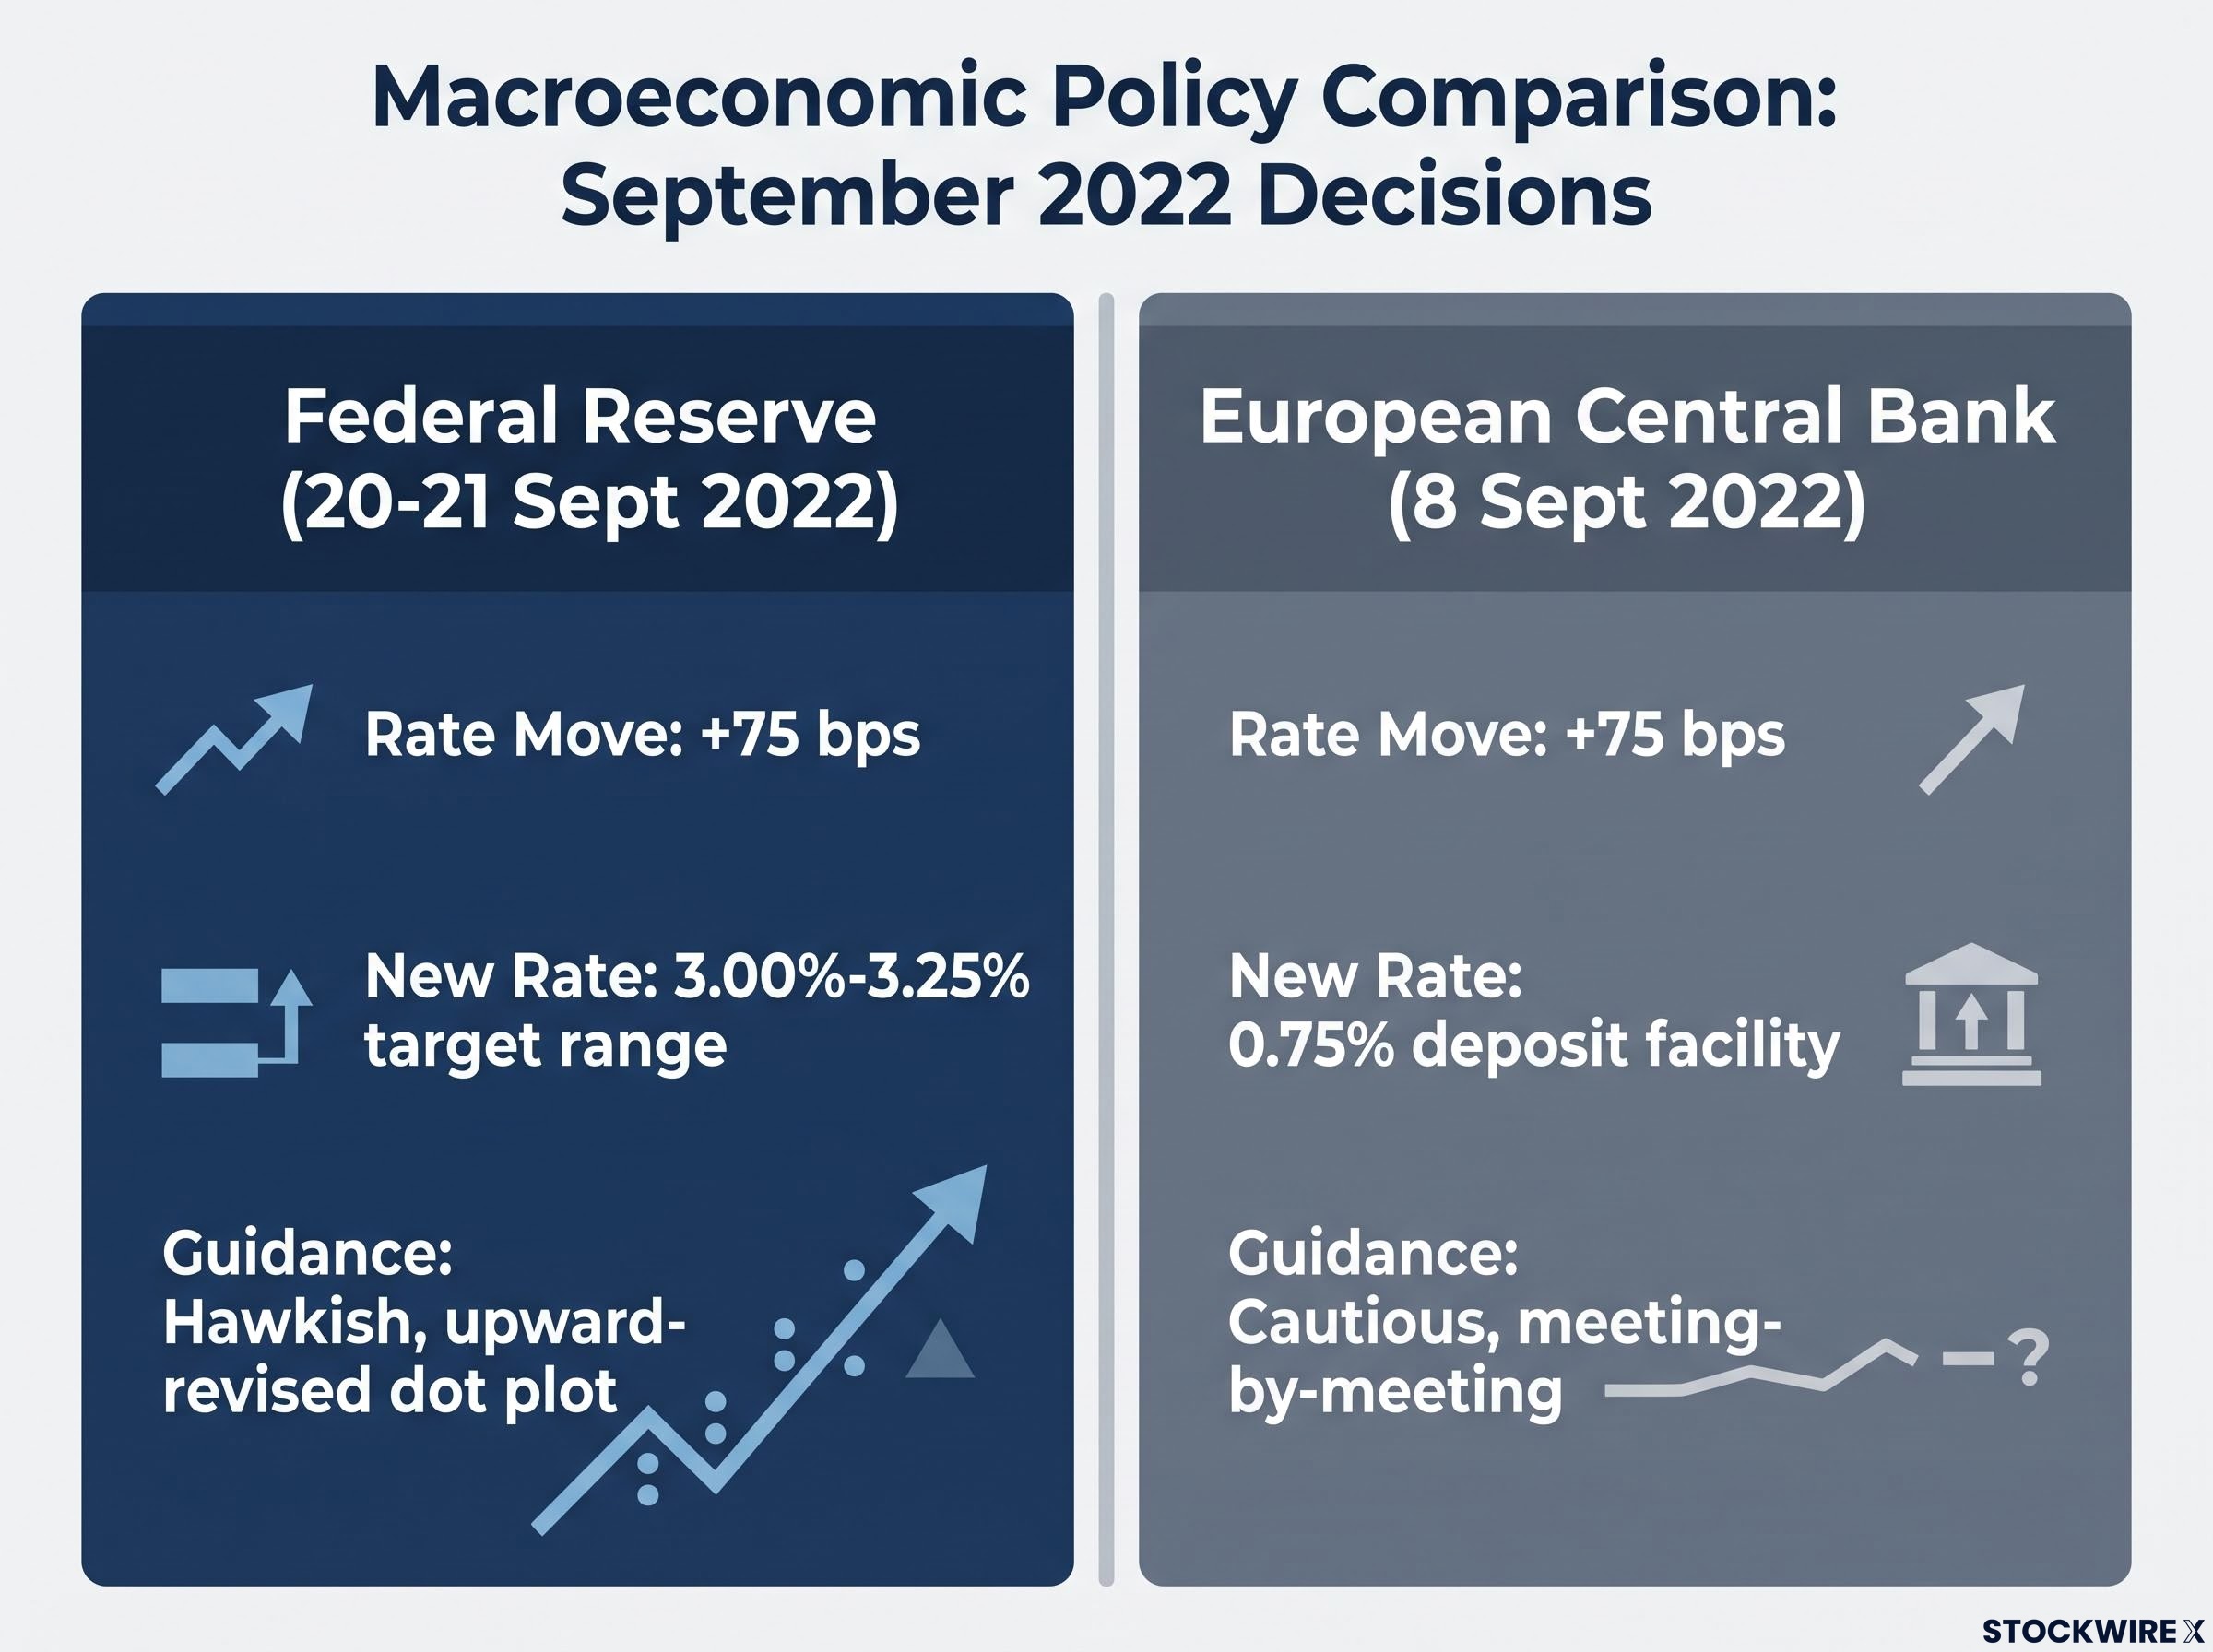
| Central Bank | Date | Rate Move | New Rate Level | Forward Guidance Tone |
|---|---|---|---|---|
| Federal Reserve | 20-21 September 2022 | +75 bps | 3.00%-3.25% target range | Hawkish; upward-revised dot plot, inflation-first |
| European Central Bank | 8 September 2022 | +75 bps | 0.75% deposit facility rate | Cautious; meeting-by-meeting, no pre-commitment |
Around the September Fed meeting, EUR/USD was already trading near 0.99. Then the slide accelerated.
The late-September low EUR/USD touched an intraday low of approximately 0.9537 on 28 September 2022, according to PoundSterlingLive tick-based historical data.
Here is the point that matters. The ECB’s own 75-basis-point hike did not arrest the euro’s decline, because the market was not pricing the size of any individual decision. It was pricing the entire future rate path, and on that dimension the Fed was pulling further ahead. A concurrent shock, the indefinite shutdown of the Nord Stream 1 gas pipeline in September 2022, deepened recession fears and stopped the pair from stabilising even after the ECB’s large move.
Why the rate gap alone does not explain everything: energy, safe havens, and the limits of the model
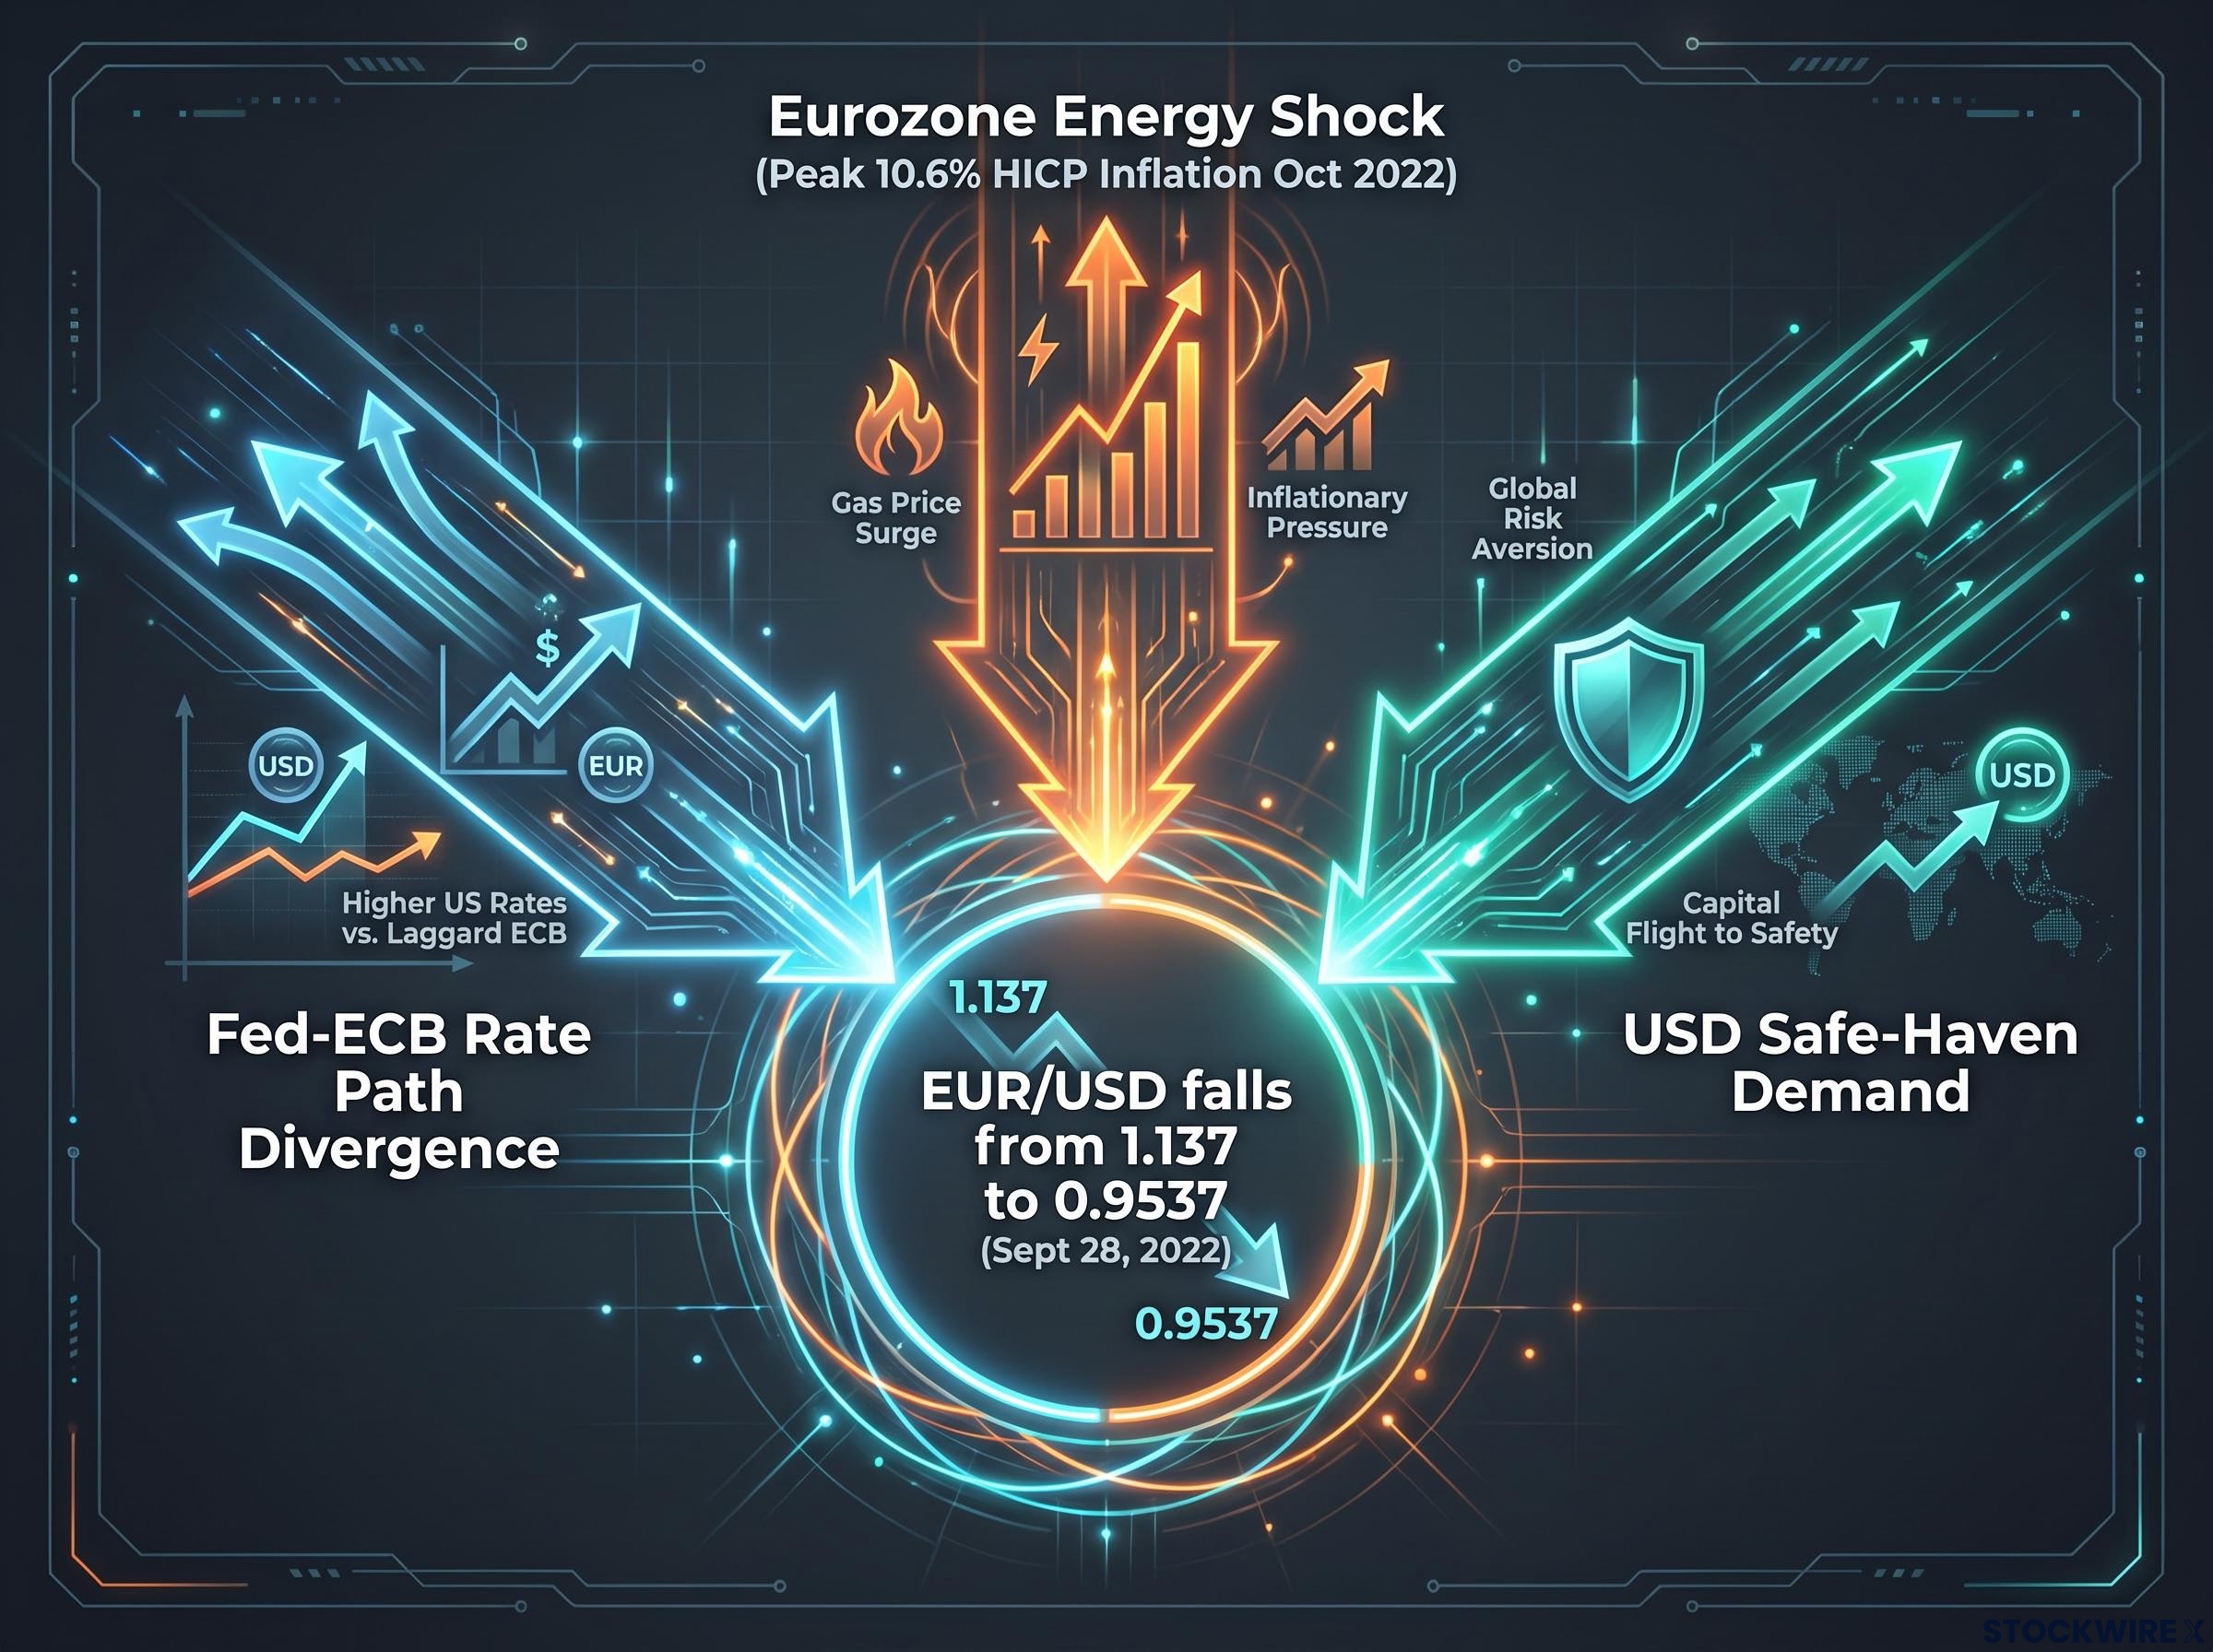
Now for the productive complication. If the rate path were the whole story, the ECB’s matching hike would have offered the euro more support than it did. It did not, because 2022 required three forces working at once to push EUR/USD below parity. The rate gap was necessary, but it was not sufficient.
The euro carried an asymmetric burden. Europe’s heavy dependence on Russian energy meant its industry and households faced direct supply disruption that US counterparts largely avoided, creating a structural growth disadvantage that weakened the euro independently of interest rates.
This shock fed straight into prices. Euro area HICP inflation peaked at 10.6% in October 2022, the highest monthly reading of the year.
The inflation constraint on the ECB Peak Eurozone HICP inflation of 10.6% in October 2022 shows the cost-of-living pressure that boxed in the ECB. It needed to fight inflation aggressively, yet the same energy shock driving those prices was also strangling growth, which is precisely why Lagarde could not commit to a Fed-style path.
The dollar had a second tailwind: safe-haven demand. In periods of global uncertainty, investors buy US dollars as a store of value regardless of rate differentials, and that flow compounded the rate-gap effect throughout 2022.
The three interlocking forces that drove EUR/USD below parity were:
- Fed-ECB rate path divergence: the widening expected-rate gap in the dollar’s favour.
- Eurozone energy and growth shock: a terms-of-trade blow that hit Europe directly and the US far less.
- USD safe-haven demand: flight-to-safety flows into the dollar amid recession and geopolitical risk.
There is also an honesty problem with the underlying theory. Uncovered interest parity is almost universally rejected in empirical research, and rate differentials have weak out-of-sample forecasting power. Worse for the tidy version of the model, the “forward premium puzzle” shows that higher-rate currencies tend to appreciate rather than settle back toward equilibrium, because carry-trade flows chase the yield. That works until it does not; when risk sentiment shifts, those carry positions can reverse sharply and fast.
For readers wanting to examine a recent episode where safe-haven logic broke down in real time, our full explainer on dollar safe-haven dynamics covers how collapsed rate hike odds, coordinated US-Japan intervention, and rerouted safe-haven flows into gold and European currencies operated simultaneously to reprice the dollar in August 2026.
Vector autoregression analysis attributes roughly 26% of the 2022 EUR/USD decline to rising oil and gas prices (a research estimate). The takeaway for you is this: central bank divergence is the most reliable structural signal in currency markets, but it behaves like a dominant wind direction, not a deterministic equation. Other forces can amplify it or partly cancel it, and knowing which ones to watch is the actual skill.
Divergence in historical context: 2014-2015 and the yen in 2021-2022
The 2022 episode was not a one-off. It fits a pattern that predates it, and once you recognise the pattern, you will spot the next one earlier.
The 2014-2015 precedent
As the Fed prepared to end its quantitative easing programme and normalise policy in late 2014, the ECB went the other way. It cut its deposit rate to -0.2% and launched its own asset-purchase programme.
That pronounced divergence produced a sharp move. The euro fell nearly 22% against the dollar over roughly seven months. The gap eventually closed as the ECB’s easing matured and the Fed’s normalisation pace moderated, but the scale of the move confirmed the mechanism: two banks moving in opposite directions at once produce outsized currency shifts.
The yen’s 2021-2022 stress test
The clearest recent example involved the Bank of Japan. While the Fed hiked aggressively, the BoJ held firm on Yield Curve Control (YCC), a policy that kept short-term rates negative, around -0.1%, and capped the 10-year government bond yield near 0.25% (both research estimates).
YCC was the structural anchor that prevented the BoJ from joining the global hiking cycle. The result was a yen that fell 17% to 22% against the dollar, reaching 24-year lows. The pressure eventually forced the BoJ to widen its yield band to plus or minus 0.5% on 20 December 2022, the first crack in the divergence.
| Episode | Diverging Banks | Duration | FX Move | Key Trigger for Reversal |
|---|---|---|---|---|
| 2014-2015 | Fed vs ECB | ~7 months | Euro fell ~22% vs USD | ECB easing matured, Fed pace moderated |
| 2021-2022 | Fed vs Bank of Japan | ~12 months | Yen fell 17%-22% vs USD to 24-year lows | BoJ widened yield band to +/-0.5% (20 Dec 2022) |
| 2022 | Fed vs ECB | ~9 months | EUR/USD from ~1.137 to ~0.9537 | Energy shock eased, Fed near terminal rate |
The pattern is consistent across all three. Large, persistent divergences drive extraordinary currency moves, and the turning point arrives when the gap narrows or the aligned fundamentals begin to reverse. When you see two major central banks publicly diverging on both rate level and trajectory, the historical record suggests treating it as a multi-month currency theme, not a multi-week one.
Reading the next divergence cycle: what to watch and where the signal breaks down
You do not need to predict the next divergence. You need to recognise it early and know when the model is being overridden. Three indicators do most of the work.
Watch the relative trajectory of central bank dot plots and equivalent forward guidance documents; watch yield differentials on short-duration government bonds, which price rate expectations directly; and watch the language shifts in central bank communications, from data-dependent to committed or the reverse.
Yield differentials on short-duration government bonds are the most direct real-time signal of where rate expectations are heading, because two-year Treasury spreads against equivalent sovereign debt price the expected rate path over the next 24 months rather than just the current policy setting.
The signal is strongest under these conditions:
- Multiple fundamentals align with the rate gap: growth differential, inflation differential, and terms of trade all pointing the same way.
- The divergence is still widening, with one bank signalling more and the other signalling caution.
- The currency move has room to run because the market has not yet fully priced the gap.
The signal is compromised under these:
- A risk-off shock triggers safe-haven flows that override carry logic and pull capital toward the dollar regardless of yield.
- The market has already fully priced the divergence, turning the actual rate decision into a “sell the news” event.
The 2022 EUR/USD episode is the archetype where all three forces aligned, driving the pair from 1.137 at the start of the year to a low near 0.9537.
The carry caution The forward premium puzzle is your reminder to stay humble: higher-rate currencies do tend to appreciate through carry flows, but those reversals can be swift and severe when sentiment turns.
Carry trade reversals can compress months of accumulated gains into days: the 2024 yen unwind cleared 40-60% of speculative positioning within weeks, and Japan’s 2026 intervention exceeded $70 billion yet still failed to reverse yen weakness, illustrating precisely how the carry caution noted in the forward premium puzzle plays out when sentiment turns.
The checklist to run through the next time a major central bank delivers a hawkish surprise is short: compare the rate paths, check the direction of yield differentials, confirm whether the fundamentals align, and ask whether the trade is already crowded.
When divergence peaks, so does the trade
The 2022 EUR/USD episode is a complete arc, and its lesson is the most transferable part of everything above. Three forces aligned to produce a historically extreme outcome, and the euro’s recovery began only as those forces individually unwound.
By the following period, EUR/USD had climbed back above parity. The reversal was not random; it tracked the compression of the same forces that drove the fall.
The three conditions that marked the 2022 peak and its reversal were:
- The Fed approaching its terminal rate, slowing the widening of the gap.
- The ECB accelerating its own hiking pace, closing the gap from the other side.
- The energy shock beginning to ease, lifting the pressure on the euro’s fundamentals.
Central bank divergence is a durable structural force in currency markets, but its impact is largest when the gap is widening and smallest, then reversing, when it starts to narrow. So the question to ask at any point in a cycle is not “how wide is the gap now” but “is the gap still widening, stable, or starting to close.” That trajectory, not the absolute level, is what drives currency direction, and it is the one thing you can apply to the next central bank announcement immediately.
This article is for informational purposes only and should not be considered financial advice. Investors should conduct their own research and consult with financial professionals before making investment decisions. Past performance does not guarantee future results.