The Federal Reserve just ended a five-meeting pause with a 25 basis point hike, and the dot plot released alongside it shows 16 of 18 policymakers expect at least one more increase before the year is out. This is not a one-and-done move.
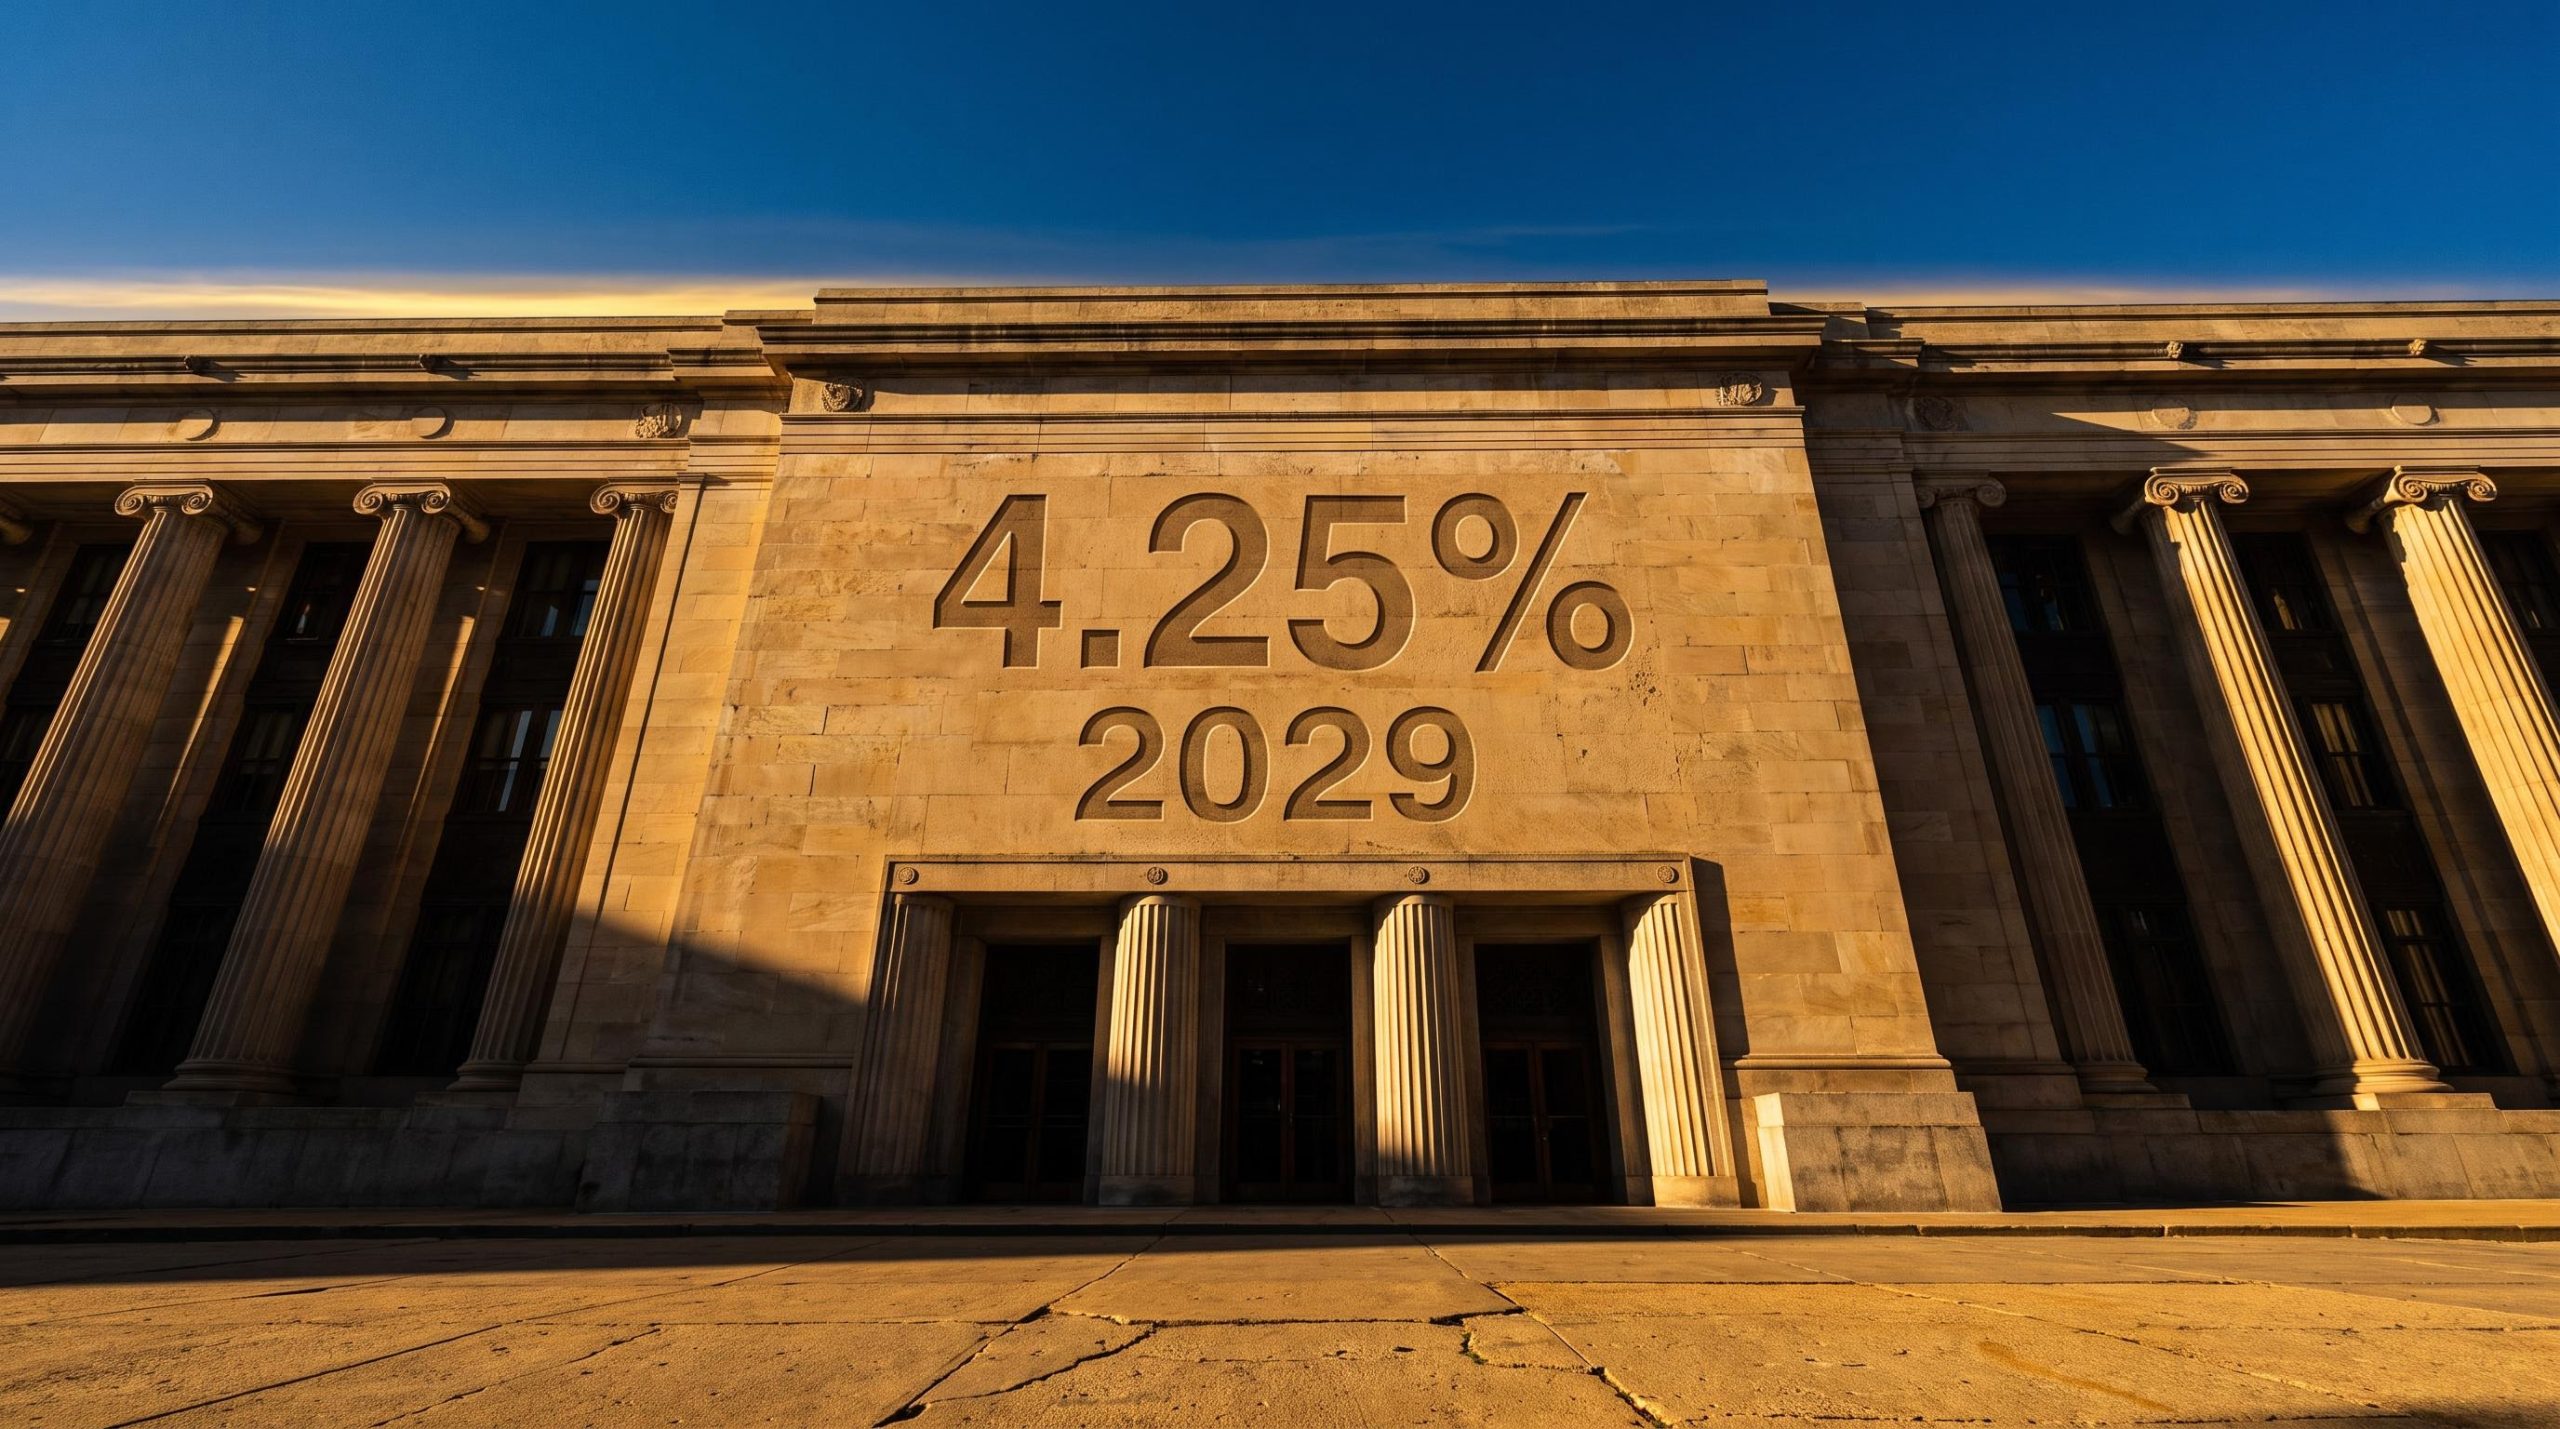
For months, markets debated whether the Fed’s pause at 3.50%-3.75% represented a genuine peak or a temporary hold. The decision on 17 September 2026 and the projections that accompanied it have settled that debate. Chairman Kevin Warsh called inflation “unacceptably elevated” at the press conference, and NBC Economics and Strategy analysts now project the upper bound climbing to 4.25% before policy eases, with no return to prior levels until the end of 2029.
This piece lays out why the Fed moved, what the dot plot and analyst projections actually say about the road ahead, and what a rate environment that stays restrictive through 2029 means for equities, bonds, and the portfolio construction decisions you are weighing right now.
What the September hike actually decided, and what it left open
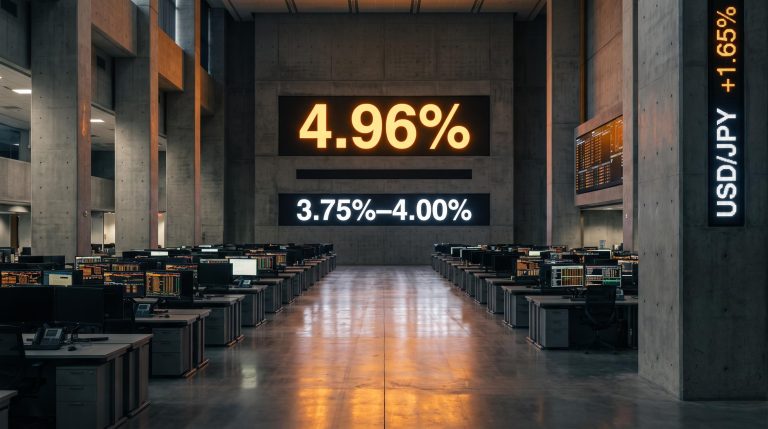
The Fed raised its benchmark rate by 25 basis points on 17 September 2026, lifting the target range to 3.75%-4.00%. That move ended a stretch of inaction that had held rates at 3.50%-3.75% from January through July, five consecutive meetings without a change.
The headline facts are worth stating plainly before the analysis deepens.
- New target range: 3.75%-4.00%, up 25 basis points
- Prior stance: a five-meeting pause at 3.50%-3.75% from January to July 2026
- Dot plot alignment: 16 of 18 policymakers anticipate at least one further hike in 2026
The market read the signal instantly. The US Dollar Index (DXY), which tracks the dollar against a basket of major currencies, traded near a six-week peak of roughly 100.37 after the announcement, a currency move that only makes sense if traders believe higher rates are coming, not stopping.
Warsh reinforced that reading at the press conference. He declined to spell out a specific path for future meetings, but he was blunt about the problem.
“Inflation remains unacceptably elevated,” Warsh said at the post-decision press conference.
That refusal to close the door is the whole point. A single hike could be dismissed as a catch-up move. A near-unanimous dot plot cannot.
Here is what the 16-of-18 alignment tells you: this is an internal consensus, not a split decision waiting to flip. The burden of proof for halting the cycle has shifted onto incoming data, not onto policymaker conviction, because the conviction is already there. For your positioning, that distinction matters enormously. Pricing in one more hike is a tactical adjustment. Pricing in a fundamentally different rate regime that runs for years is a strategic one, and the dot plot is telling you to prepare for the second.
When big ASX news breaks, our subscribers know first
What the dot plot and NBC projections say about the path to 2029
The dot plot is the Fed’s own scorecard of where each policymaker expects rates to sit at future dates. Read one snapshot in isolation and it looks like a forecast. Read three in sequence and a pattern emerges, and that pattern has moved in one direction all year.
The distinction between dot plot vs futures pricing matters because the two instruments measure fundamentally different things: dots reflect each policymaker’s baseline view, while futures contracts price a risk-weighted distribution of all plausible outcomes, including worst-case inflation scenarios that no single FOMC member would publicly endorse as their modal forecast.
In March 2026, the median projection put the federal funds rate at 3.4% by end-2026, with 3.1% pencilled in for both end-2027 and end-2028. By June 2026, every one of those figures had been revised higher.
| Horizon | March 2026 projection | June 2026 projection |
|---|---|---|
| End-2026 | 3.4% | 3.8% |
| End-2027 | 3.1% | 3.6% |
| End-2028 | 3.1% | 3.4% |
| September actual / NBC peak | Upper bound already at 4.00%; NBC projects a 4.25% peak | |
Look at the June end-2026 median of 3.8% against the actual September upper bound of 4.00%. The Fed’s own projection undershot its own action within three months. That is the trend that gives the analyst consensus its shape.
NBC Economics and Strategy analysts now sit at the outer edge of that consensus. They project the tightening cycle peaking with an upper bound of 4.25%, and they do not expect a return to the 3.50%-3.75% range until the close of 2029. Future cuts, in their framing, are conditional on the durability of AI-driven economic expansion rather than automatic.
NBC Economics and Strategy analysts project no return to the 3.50%-3.75% range until the end of 2029.
Translate that into operational terms. “Higher for longer” here means roughly three years of rates at or above where they sit today, with any easing arriving slowly and only if the growth story holds.
The gap between projection and reality is the read you should take from this. When forecasts have consistently trailed the actual path, the sensible move is to treat the NBC 4.25% peak as a floor rather than a ceiling. The 2029 timeline is not an abstraction either. Positioning decisions you make today will operate inside this environment for years, which makes these projections the single most practically relevant data set in this whole discussion.
Why Warsh and his colleagues believe inflation justifies this path
The case for staying restrictive starts with numbers, not preferences. At the Jackson Hole symposium on 28 August 2026, Warsh laid out the figures that anchor the Fed’s stance.
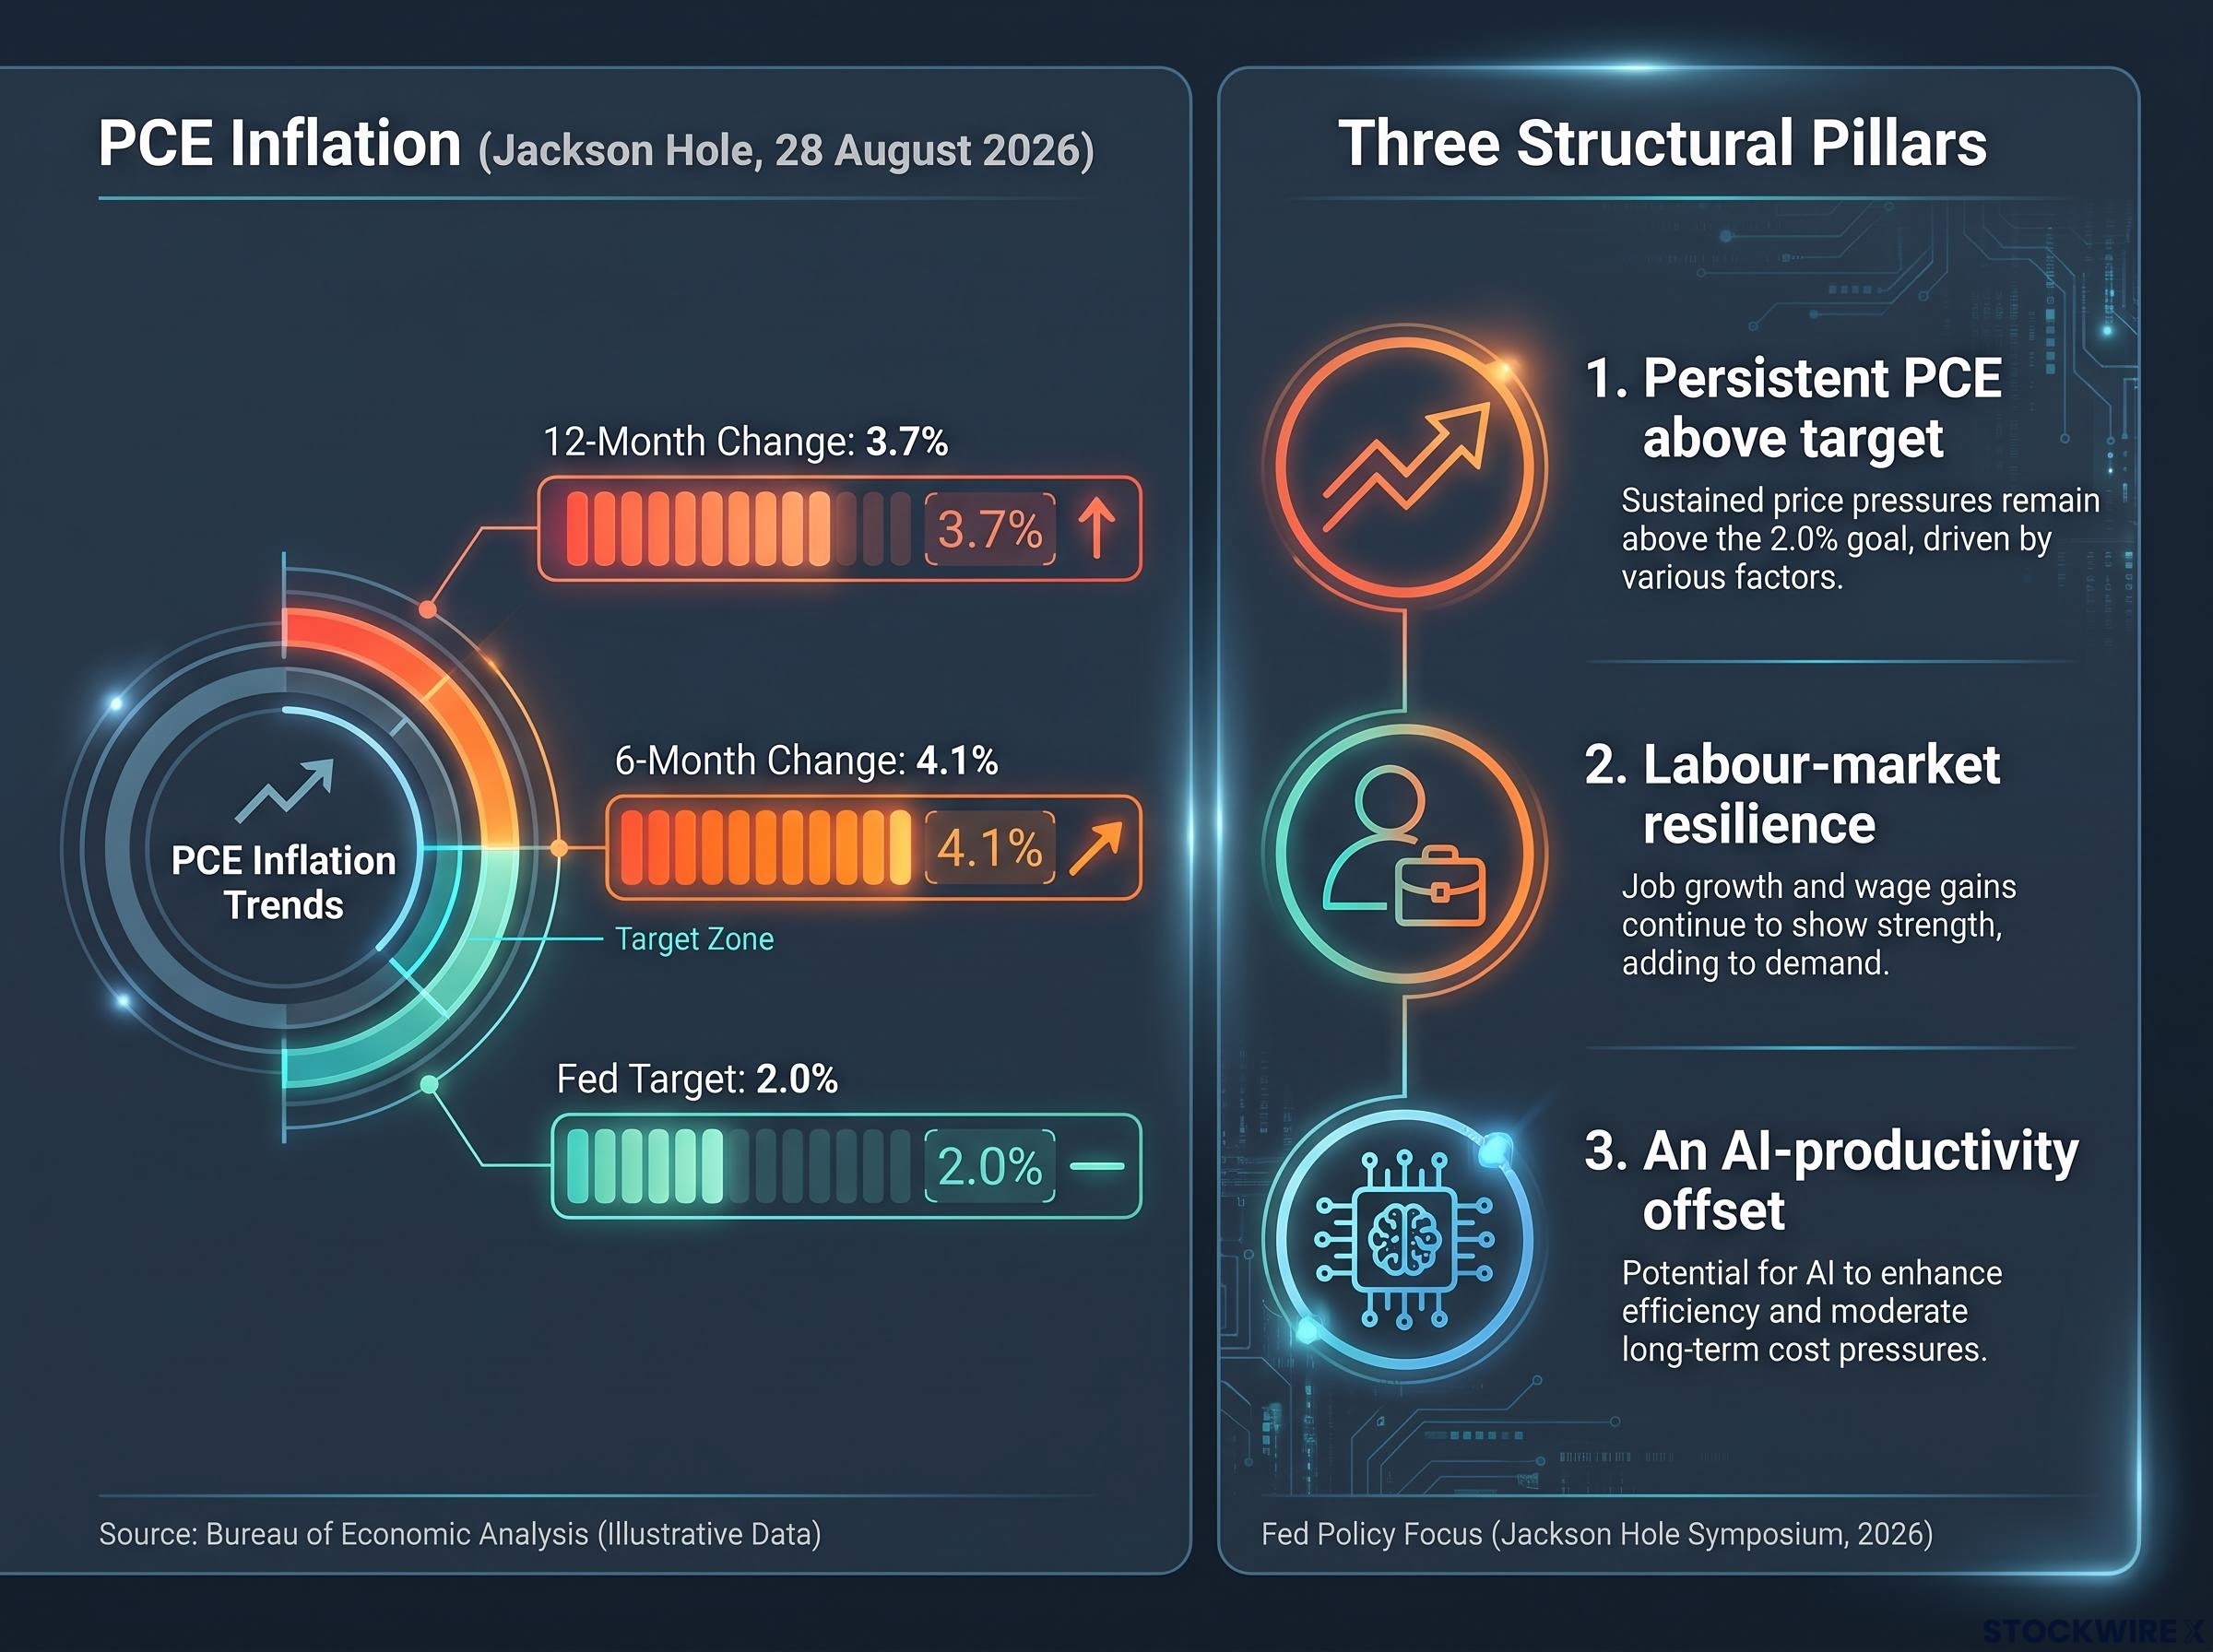
The 12-month change in the Personal Consumption Expenditures (PCE) price index, the Fed’s preferred inflation gauge, stood at 3.7%. The six-month change ran hotter, at 4.1%. Both sit well above the Fed’s 2% target.
That six-month figure is the one that matters most. At 4.1%, recent inflation is running more than twice the target on an annualised basis, and that single reading explains why Warsh has refused to signal any pivot even as some measures softened at the margin over the summer.
Core PCE persistence through July, holding at 3.3% year over year for a second consecutive month, was already telling a consistent story before the September meeting: the underlying trend was drifting lower rather than breaking downward, the precise distinction that separates a patient hold from the start of a genuine cutting cycle.
Beyond the raw data, three structural pillars support the hawkish position.
- Persistent PCE above target, with headline and core measures telling a consistent story
- Labour-market resilience, which removes a key trigger for premature easing
- An AI-productivity offset, which may let the economy absorb tight policy longer without a deep downturn
The stickiness argument deserves unpacking. Services inflation tends to be closely tied to wages, and a resilient labour market keeps wage pressure alive, which keeps services prices elevated. So long as employment holds up, the usual reason to cut early, protecting jobs, is off the table.
Warsh has been sharpening this framing all year. In remarks on 14 July 2026, he described inflation as an “unfair burden” and a “tax on the American people and businesses,” language that signals he views the problem as urgent rather than fading.
“The Fed’s predominant focus right now should be on prices,” Warsh said at Jackson Hole.
The AI thread is what makes the long timeline plausible. Warsh has linked the policy stance to an AI-driven investment boom, arguing that stronger productivity gives the Fed room to lean against inflation without immediately tipping the economy into recession. He has also warned that rates could move higher still if progress on prices stalled.
What this means for your positioning is subtle but important. If the Fed’s conviction rests on durable structural arguments rather than one cyclical soft patch, the higher-for-longer path is far less likely to be interrupted by a single friendly CPI print than markets have historically assumed. Betting on a quick pivot means betting against the Fed’s own stated reasoning.
The case against higher for longer, and what overtightening risk actually looks like
The hawkish consensus is not the only credible view, and treating the counter-argument as a strawman would leave you unprepared for the scenario where it turns out to be right.
The core dovish case rests on lags. Monetary policy works with long and variable delays, and the full effect of tightening that began in 2022, plus the late-2025 cuts, plus the September hike, has not yet fully reached the real economy. Adding pressure to a system still absorbing prior pressure risks doing unnecessary damage to employment and growth. Some commentators point to the late-2025 rate cuts and the 2026 pause as evidence that policy was already restrictive enough.
A prolonged high-rate environment also concentrates specific financial-stability risks.
The rate-sensitive fault lines most exposed to a 4.25% peak include commercial real estate facing a $930 billion maturity wall in 2026 alone, private credit borrowers whose interest costs already exceed earnings, and regional banks carrying CRE concentrations well above 200% of Tier 1 capital, sectors where refinancing stress peaks precisely at the top of the cycle.
- Commercial real estate, where refinancing at higher rates strains valuations and cash flows
- Highly leveraged firms, whose debt costs climb as maturing borrowing rolls over
- Shadow banking segments, non-bank lenders facing funding pressure outside the traditional banking system
With NBC projecting a 4.25% upper bound, these refinancing stresses would peak precisely at the top of the cycle. The 2022 episode offers the cautionary parallel: a sharp de-rating of long-duration assets as the risk-free rate climbed. Overtightening now would risk replaying that dynamic.
Three signals that would change the calculus
The overtightening risk is real but conditional. It becomes binding only if inflation moderates faster than the dot plot expects, which is why the counter-case is best treated not as a reason to dismiss higher-for-longer, but as a checklist of what would prove the consensus wrong.
- PCE falling on a sustained basis, which would open a genuine debate about the pace of the next cut
- A meaningful softening in labour-market conditions, removing the wage-driven support beneath services inflation
- Evidence that AI-productivity gains are not materialising at the pace the Fed’s structural argument assumes
Knowing the conditions under which this consensus breaks is as valuable as knowing the consensus itself. Those three signals are the inflection points that would justify repositioning before the Fed formally pivots, rather than after.
Positioning a portfolio for a rate environment that runs through 2029
With a projected upper bound of 4.25% persisting toward end-2029, the practical question is not whether rates matter but which of your holdings get repriced, and by how much.
Start with equities. A persistently higher discount rate, the rate used to value future earnings in today’s terms, compresses valuations most severely for long-duration growth and speculative stocks whose payoffs sit far in the future. The post-2022 cycle showed the pattern clearly: growth and speculative names de-rated, while value, dividend, and financials-oriented positions held up better. For the duration of this window, that relative advantage is likely to persist.
| Asset class | Higher-for-longer pressure | Relative opportunity | Key risk |
|---|---|---|---|
| US equities (growth) | Valuation compression from elevated discount rate | Limited near term | Further de-rating if peak rate exceeds 4.25% |
| US equities (value/financials) | Lower sensitivity to discount-rate moves | Relative outperformance, better funding-cost absorption | Vulnerable if growth slows into recession |
| Long-duration bonds | Mark-to-market losses as yields stay high | Limited until easing begins | Extended plateau delays price recovery |
| Short-duration bonds/Treasuries | Minimal price risk at the front end | Positive real yields for new buyers | Reinvestment risk if cuts arrive sooner |
| Cash/money market instruments | None; benefits from elevated front-end yields | Genuinely competitive with risk assets | Opportunity cost if rates fall faster than projected |
Fixed income and cash in a 4%-plus world
The bond story splits sharply between who you are. If you already hold long-duration bonds bought at lower yields, you face mark-to-market pressure, the paper loss that appears when rising yields push existing bond prices down. That pressure lingers as long as the front end stays elevated and the curve stays flat or inverted.
If you are a new buyer, the picture inverts. Short-duration Treasuries and high-grade instruments now offer meaningfully positive real yields, meaning yields that exceed inflation, for the first time in years. That is a return of capital preservation with actual purchasing-power growth attached, not just nominal income.
Cash sits in the same favourable spot. Elevated front-end yields make cash and money market instruments genuinely competitive with risk assets, which changes the opportunity-cost calculation entirely. During the zero-rate era, holding cash meant surrendering returns. In a 4%-plus environment, cash pays you to wait.
The structural point is this: a risk-free rate near 4.25% embedded in every valuation model, holding through roughly 2028-2029, sits higher and lasts longer than most portfolio frameworks were built to handle. That is the argument for reviewing your duration and sector exposure now, against the 2029 timeline, rather than after the next dot plot forces the issue.
For investors holding intermediate-duration bonds bought at lower yields who want to model the specific recovery mechanics, our dedicated guide to rising bond yield positioning walks through three investor scenarios with a documented five-year outcome gap driven purely by the hold-or-sell decision.
What the next data releases will tell you about whether this consensus holds
The analytical frame is set. The forward question is which data actually confirms or challenges it, so your attention lands where it matters rather than on every headline.
Three signals deserve monitoring above the rest.
- PCE readings, currently 3.7% over 12 months and 4.1% over six months. Sustained movement toward the Fed’s 2% target is the threshold that would reopen the debate about the pace of cuts.
- AI-productivity evidence, the longer-horizon wildcard. If AI investment fails to translate into measured productivity gains, the Fed’s structural rationale for tolerating extended restriction weakens.
- The next FOMC dot plot, where any fracture in the 16-of-18 consensus would first appear.
That consensus figure is the anchor. A single soft inflation print will not move a trajectory that 16 of 18 policymakers already agree on. Repositioning on one data point would be reacting to noise, not signal.
The 2022 precedent reinforces the caution. Through that cycle, projections consistently undershot the actual rate path, which is exactly why the market is now pricing toward the NBC 4.25% peak rather than betting on an early reversal.
NBC Economics and Strategy analysts project no return to the 3.50%-3.75% range until the end of 2029.
Knowing which signals matter and which are noise is what separates reactive portfolio management from strategic positioning. The sensible posture is to calibrate to the base case, the higher-for-longer path, while watching the three signals above for the specific evidence that would justify a shift.
This article is for informational purposes only and should not be considered financial advice. Investors should conduct their own research and consult with financial professionals before making investment decisions.
Past performance does not guarantee future results. Financial projections, including the NBC Economics and Strategy rate forecasts referenced here, are subject to market conditions and various risk factors, and are speculative in nature.