Australian investors have funnelled close to A$5 billion into a strategy that deliberately puts a ceiling on how much they can gain, and the money keeps arriving. That is not an oversight. It is a calculated exchange, and the people making it are among the most income-focused investors in the market.
The reason so many are willing to trade away part of their upside comes down to a single word: income. Covered call ETFs have crossed over from a tool used mostly by institutions into a mainstream product listed on the ASX. According to Global X ETFs Australia, the capital allocated to these strategies domestically has grown roughly tenfold over the past five years, echoing an earlier wave of adoption in the United States, where the broader category now exceeds US$145 billion in net assets.
So what exactly are these investors giving up, and why do so many consider it a fair deal? After reading this, you will know how covered call ETFs in Australia generate their income, precisely what you surrender to collect it, and whether your own situation is one where that swap makes sense.
What a covered call strategy actually does to your returns
A covered call is simpler than the name suggests. You hold a portfolio of shares, and you sell call options against those exact positions. A call option gives its buyer the right to purchase your shares at a fixed price by a set date, and in return for granting that right, you receive a cash payment upfront called a premium.
That premium is income, and you keep it no matter what the market does.
The word “covered” is doing important work here. It means you already own the shares the option is written against, which removes the risk of a margin call, the demand for extra cash that hits an investor who has sold options without owning the underlying stock. Global X’s AYLD fund runs exactly this structure: it holds ASX 200 constituents and sells quarterly at-the-money call options on the index, for a management fee of 0.60% (BestETF, August 2026).
That fee is the price of having a fund run the strategy for you rather than managing the options, strikes, and expiries yourself.
AYLD’s income comes from three distinct sources:
- Dividends paid by the underlying Australian companies it holds.
- Franking credits attached to those dividends, a tax benefit unique to Australian investors.
- Options premiums collected from the systematic call overlay it writes each quarter.
That third source is the one that changes everything. When you buy a covered call ETF, you are not simply receiving a bigger dividend. You are monetising the market’s expectation of future volatility, and that income behaves very differently to a dividend across changing market conditions. When markets expect large price swings, premiums rise; when they expect calm, premiums shrink.
Franking credits sit at the centre of why Australian covered call ETFs behave differently to their US counterparts; the imputation system lets eligible investors gross up after-tax income materially, and SMSF trustees in pension phase receive the full credit as a cash refund from the ATO rather than simply a reduction in tax payable.
The strike price and the upside cap
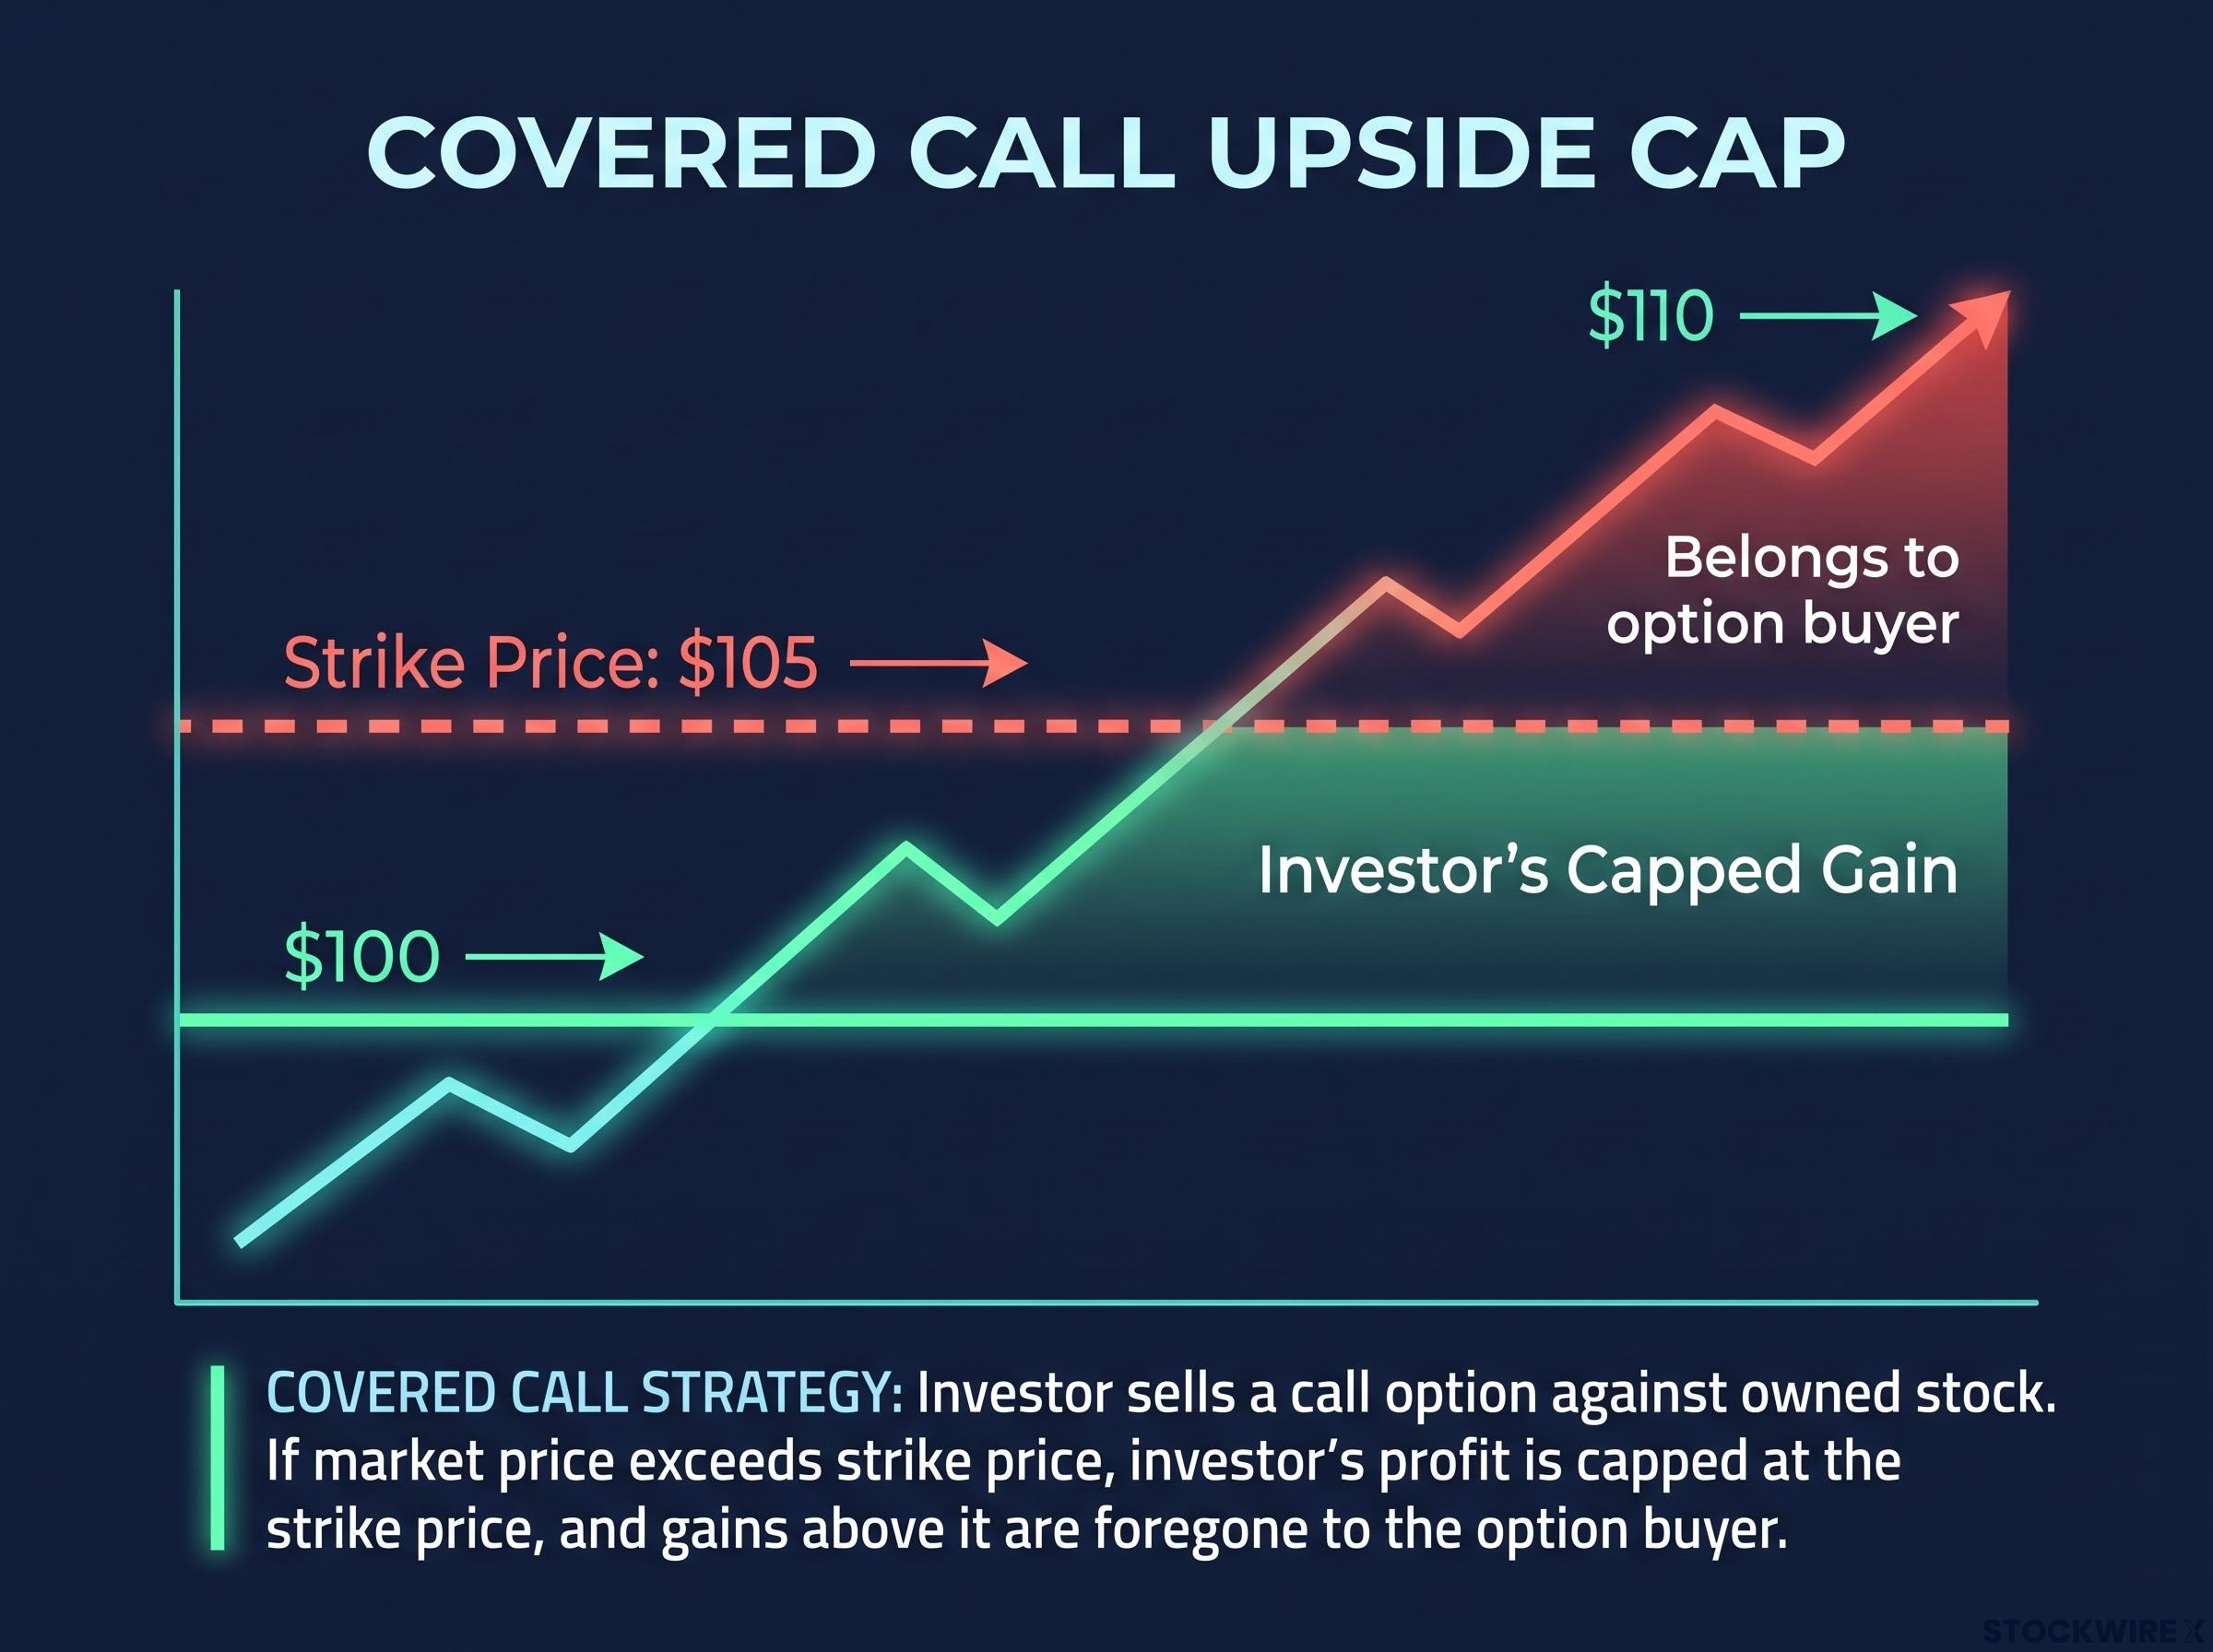
The strike price is the ceiling on your gains. Say you hold shares worth $100 and the fund sells a call with a $105 strike. If the market rallies to $110, everything above $105 belongs to the option buyer, not you.
The core trade-off: you sell the right to future gains above a set price in exchange for cash you receive today.
AYLD uses at-the-money calls, meaning the strike sits at or very near the current index level. This choice typically generates a larger premium, which is good for income, but it also imposes a tighter cap on upside. The more income you harvest today, the less room you leave for capital growth tomorrow.
That upside cap is not a theoretical abstraction; the Cboe S&P 500 BuyWrite Index data shows covered call structures captured approximately 64% of S&P 500 upside while absorbing around 70% of its downside over a decade, an asymmetry that compounds meaningfully against investors who stay in these strategies across full bull cycles.
When big ASX news breaks, our subscribers know first
How the income and volatility numbers stack up for AYLD
The headline number is the yield, and it is a big one. AYLD carried a trailing 12-month yield of 9.2% as of August 2026 (Global X), a figure corroborated across measurement approaches: Trackinsight reported 9.48% as of 11 September 2026, and BestETF listed 9.86% in August 2026.
A yield near 10% in a market where the ASX 200 pays roughly a third of that is genuinely eye-catching.
But yield alone is a trap if you stop there. What matters is total return, the yield plus or minus what happens to your capital, and that is where the picture gets more textured. According to InvestSmart data to 31 August 2026, AYLD has both outrun and trailed the broad market depending on the window.
| Period | AYLD Total Return | ASX 200 Total Return |
|---|---|---|
| 1 month | 1.75% | 1.54% |
| 3 months | 3.75% | 4.54% |
| 6 months | 7.09% | 0.32% |
| 1 year | 10.72% | 4.40% |
Over the one-year window, the income component alone contributed 5.19% of that total return, showing how much of AYLD’s result came from distributions rather than capital growth. Over six months and a year, the fund beat the index handsomely. Over three months, it lagged.
That inconsistency is the whole point, and one earlier data set makes the risk unmistakable.
As of 26 September 2025 (Pearler): AYLD returned just 0.48% year-to-date while the A200 ETF returned 7.73%, even as AYLD paid a 9.98% distribution yield against A200’s 3.23%.
That is the bull-market scenario you need to stress-test before you buy. When the market runs hard, a covered call fund collects its income and hands the capital growth to the option buyers. If your portfolio is in a phase where capital growth matters more than cash flow, that is a poor trade.
Global X covered call strategy analysis outlines how at-the-money strike selection, the approach used in AYLD, tends to maximise premium income relative to out-of-the-money structures while imposing a tighter ceiling on capital appreciation in rising markets.
There is a counterweight, though: reduced volatility. Selling a call narrows the range of possible outcomes because you take in premium upfront and cap the right tail of gains. Practitioner research suggests this can lower a position’s return standard deviation, a measure of how widely returns swing around their average, by 20-40% relative to an uncovered holding, depending on the strike and maturity chosen.
So the honest read is this: AYLD offers meaningful income and a smoother ride in exchange for lagging a strong bull run. Neither the yield figure nor the total return figure tells the full story on its own.
Why nearly A$5 billion has found its way into this strategy in Australia
Start with who actually wants this. The demand is not abstract; it comes from a specific and growing cohort of Australians with a clear problem to solve.
Three drivers explain most of the local appetite:
- Retiree and near-retiree income needs. BestETF’s August 2026 profile of AYLD names retirees and near-retirees needing regular cash flow as the core audience, and Australia’s ageing population keeps expanding that group.
- Adviser adoption replicating US patterns. Global X noted in May 2025 that financial advisers are increasingly using covered call ETFs to supplement traditional dividend portfolios, following a path already worn in the United States.
- Frustration with low plain-equity yields. Morningstar observed in June 2025 that income-oriented investors turn to funds like AYLD and BetaShares’ YMAX to convert ordinary equity holdings into higher-yielding income streams.
That demand adds up to the near-A$5 billion figure Global X cites for covered call strategies domestically, roughly ten times the level of five years earlier. It is worth understanding why that number is so much larger than the A$1.6 billion ReviewETF counted across nine ASX-listed funds in April 2026: the broader figure sweeps in institutional mandates and managed accounts that sit outside the listed ETF universe.
Among the listed funds themselves, AYLD is still a relative minnow.
| Fund | AUM (April 2026) |
|---|---|
| YMAX | A$644M |
| UMAX | A$276M |
| HVST | A$275M |
| JEPI | A$171M |
| AYLD | A$90M |
Zoom out and the Australian story looks like an early chapter of a much larger international one. Reuters reported in July 2025 that US derivative income funds, which predominantly use covered call strategies, had reached a record US$145 billion in net assets. A Nasdaq special report in February 2026 put the global covered call ETF category at roughly US$227 billion.
The tenfold growth in five years tells you this is no speculative fringe. The strategy has become a mainstream fixture for income-seeking Australians, which means understanding it is now close to a practical necessity for anyone building or advising on an income portfolio, whether or not you ultimately use it.
When covered call ETFs earn their place in a portfolio, and when they do not
This is not a balanced pros-and-cons list. It is a test, and the outcome depends almost entirely on which phase of your investing life you are in.
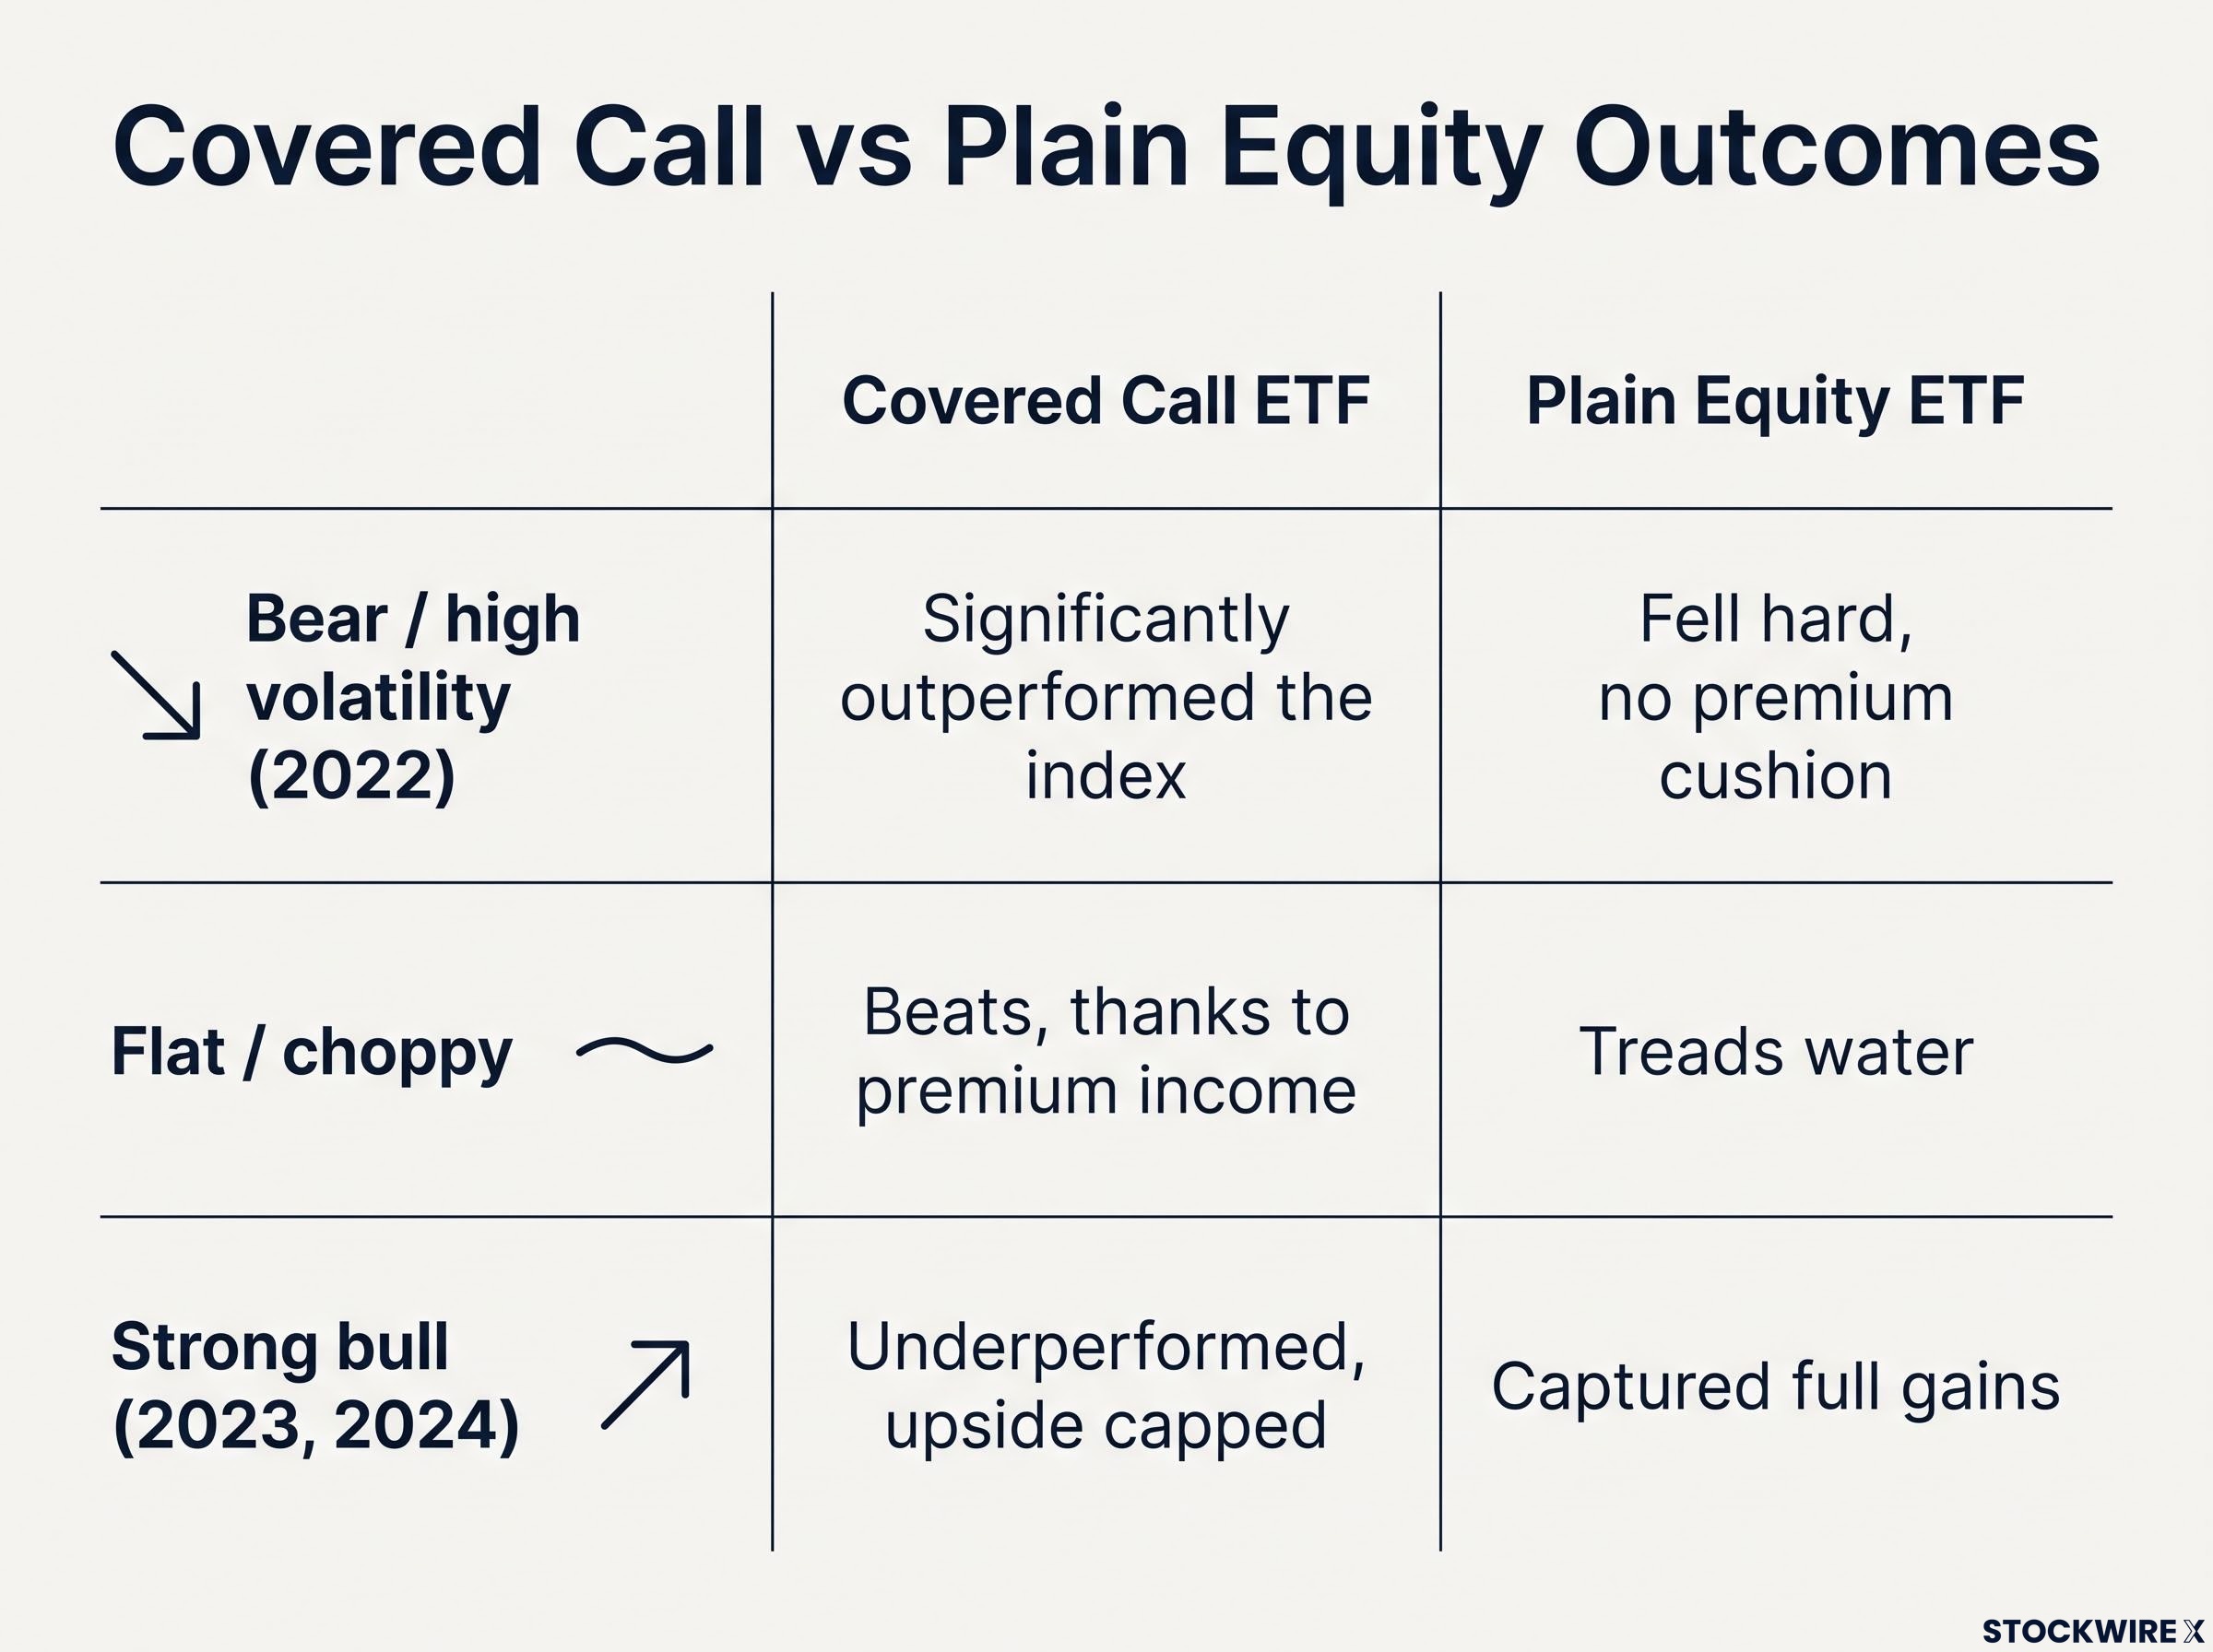
Covered call ETFs behave predictably across three broad market environments, according to DividendVision’s July 2026 modelling. In flat or choppy markets they outperform, because the premium income keeps working while plain equity treads water. In strong bull runs they lag, because the upside cap surrenders the gains. In downturns they lose less but still lose, since the premium cushions rather than protects.
The cleanest real-world evidence comes from CoveredRank’s April 2026 cross-cycle study.
| Market Condition | Covered Call ETF Outcome | Plain Equity ETF Outcome |
|---|---|---|
| Bear / high volatility (2022) | Significantly outperformed the index | Fell hard, no premium cushion |
| Flat / choppy | Beats, thanks to premium income | Treads water |
| Strong bull (2023, 2024) | Underperformed, upside capped | Captured full gains |
Every covered call ETF in CoveredRank’s universe beat its index in 2022, then trailed in both 2023 and 2024. If the next couple of years look more like 2022, a covered call allocation earns its keep. If the market keeps trending up, the opportunity cost of that upside cap compounds year after year.
There is a subtler danger too. ReviewETF’s April 2026 analysis argues that many of these funds have delivered weak five-year total returns despite lofty headline yields, partly because distributions can include a return of capital, a payout drawn from your own invested money that quietly erodes the fund’s net asset value.
ReviewETF’s warning: many covered call funds have “destroyed” five-year total returns while advertising yields of 8-15%.
That is why allocation size matters so much. ReviewETF suggests 5-10% of a portfolio is a sensible range for retirement drawdown and income diversification, while allocations of 30-50%, often driven by mistaking a 10% yield for a 10% total return, risk serious capital erosion.
Covered call ETF selection changes substantially depending on whether you plan to spend or reinvest your distributions; an investor compounding distributions back into the fund faces a structural drag from capped upside that an income-spending retiree never encounters, meaning the same yield figure points toward very different outcomes for two investors with different cash flow needs.
For Australian investors, the tax picture is not identical to the US critique. Much of the American commentary centres on how selling calls converts preferentially taxed capital gains into ordinary income. Franking credits soften that concern here, though they do not erase every tax consideration, so treat them as a genuine differentiator rather than a complete offset.
Who should consider these funds and who should be cautious
Three investor profiles help you locate yourself:
- Retirees in drawdown. The most suited group. Regular cash flow and lower volatility are exactly what a drawdown phase needs, and BestETF names this cohort as AYLD’s primary audience.
- Near-retirees building income layers. Well-suited in a modest allocation, adding an income stream while capital growth still matters somewhat.
- Long-term accumulators in their 30s and 40s. Least suited. Over a full market cycle, plain equity index funds are likely to build more wealth.
On that last group, ReviewETF and critical voices such as Keystocks and The Bellwether Research converge on the same caution: systematically selling your upside converts potential capital gains into taxable income and can meaningfully reduce your terminal wealth over decades.
What the numbers tell you before you decide
Step back and the near-A$5 billion Australians have committed to covered call strategies reads as a genuine signal, not a marketing illusion. It reflects real utility for a specific cohort, but that utility is entirely conditional on being in the right phase of your financial life.
AYLD’s own record backs this up. Its since-inception annualised total return sits at 10.58% (InvestmentMarkets/Morningstar, September 2026), earned across a stretch that included a sharp bear market in 2022 and two strong bull years in 2023 and 2024. That is a competitive result over a mixed cycle, but the composition of those returns, more income and less capital growth, is what determines whether it suits your tax position, income need, and time horizon.
Before you allocate a cent, answer three questions:
- Do I need regular cash income now?
- Is my portfolio in drawdown or accumulation?
- Am I comfortable with a strategy that performs best when the market does not?
With a global category worth roughly US$227 billion (Nasdaq, February 2026) and an ageing Australian population steadily expanding the retiree cohort, this category will almost certainly keep growing. That makes understanding it worthwhile even if you decide it is not for you.
For investors wanting to understand why Goldman Sachs committed more than $4 billion to acquire options ETF platforms in 2026, our deep-dive into the institutional forces driving covered call ETF growth examines the fee economics, demographic demand, and asset stickiness dynamics that explain why major institutions are betting on the category’s durability.
This article is for informational purposes only and should not be considered financial advice. Investors should conduct their own research and consult with financial professionals before making investment decisions.
Past performance does not guarantee future results. Financial projections are subject to market conditions and various risk factors.