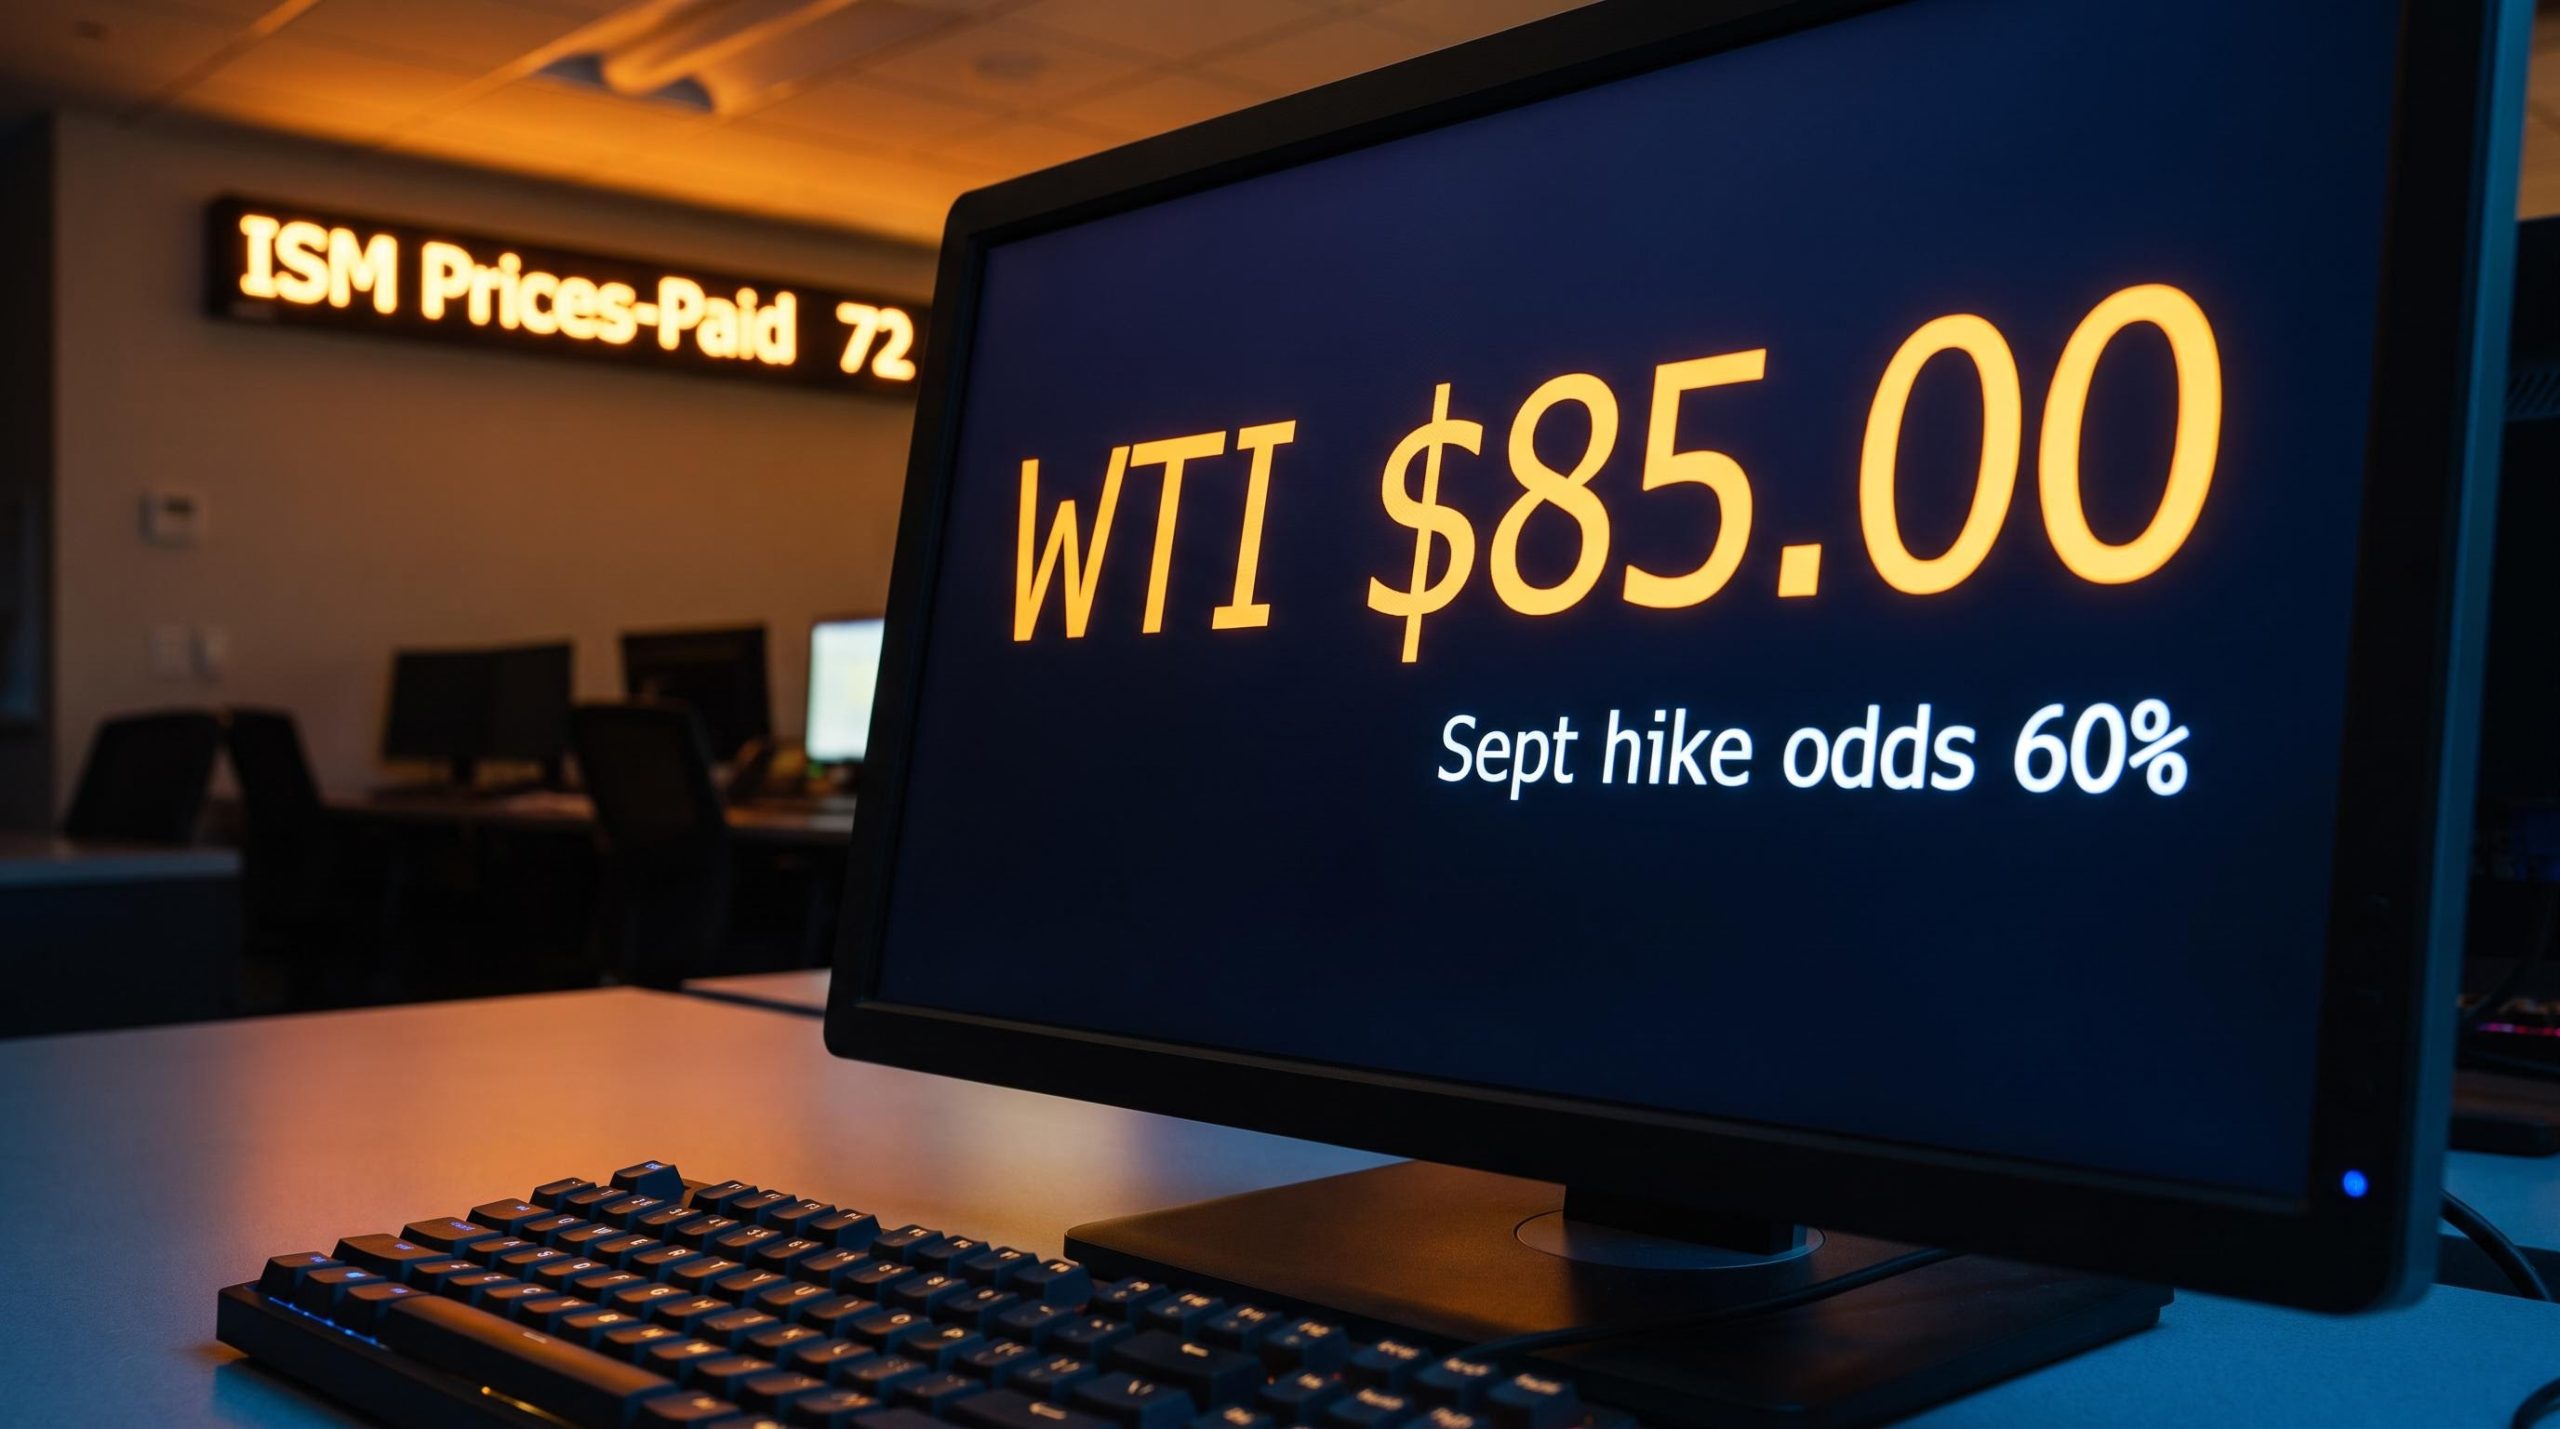
Crude oil pushes toward $85 a barrel and the instinct is to think energy trade. The more consequential move is not in barrels; it is in what happens to rate expectations, the dollar, and the discount rate applied to every position in your portfolio over the next six to eight weeks.
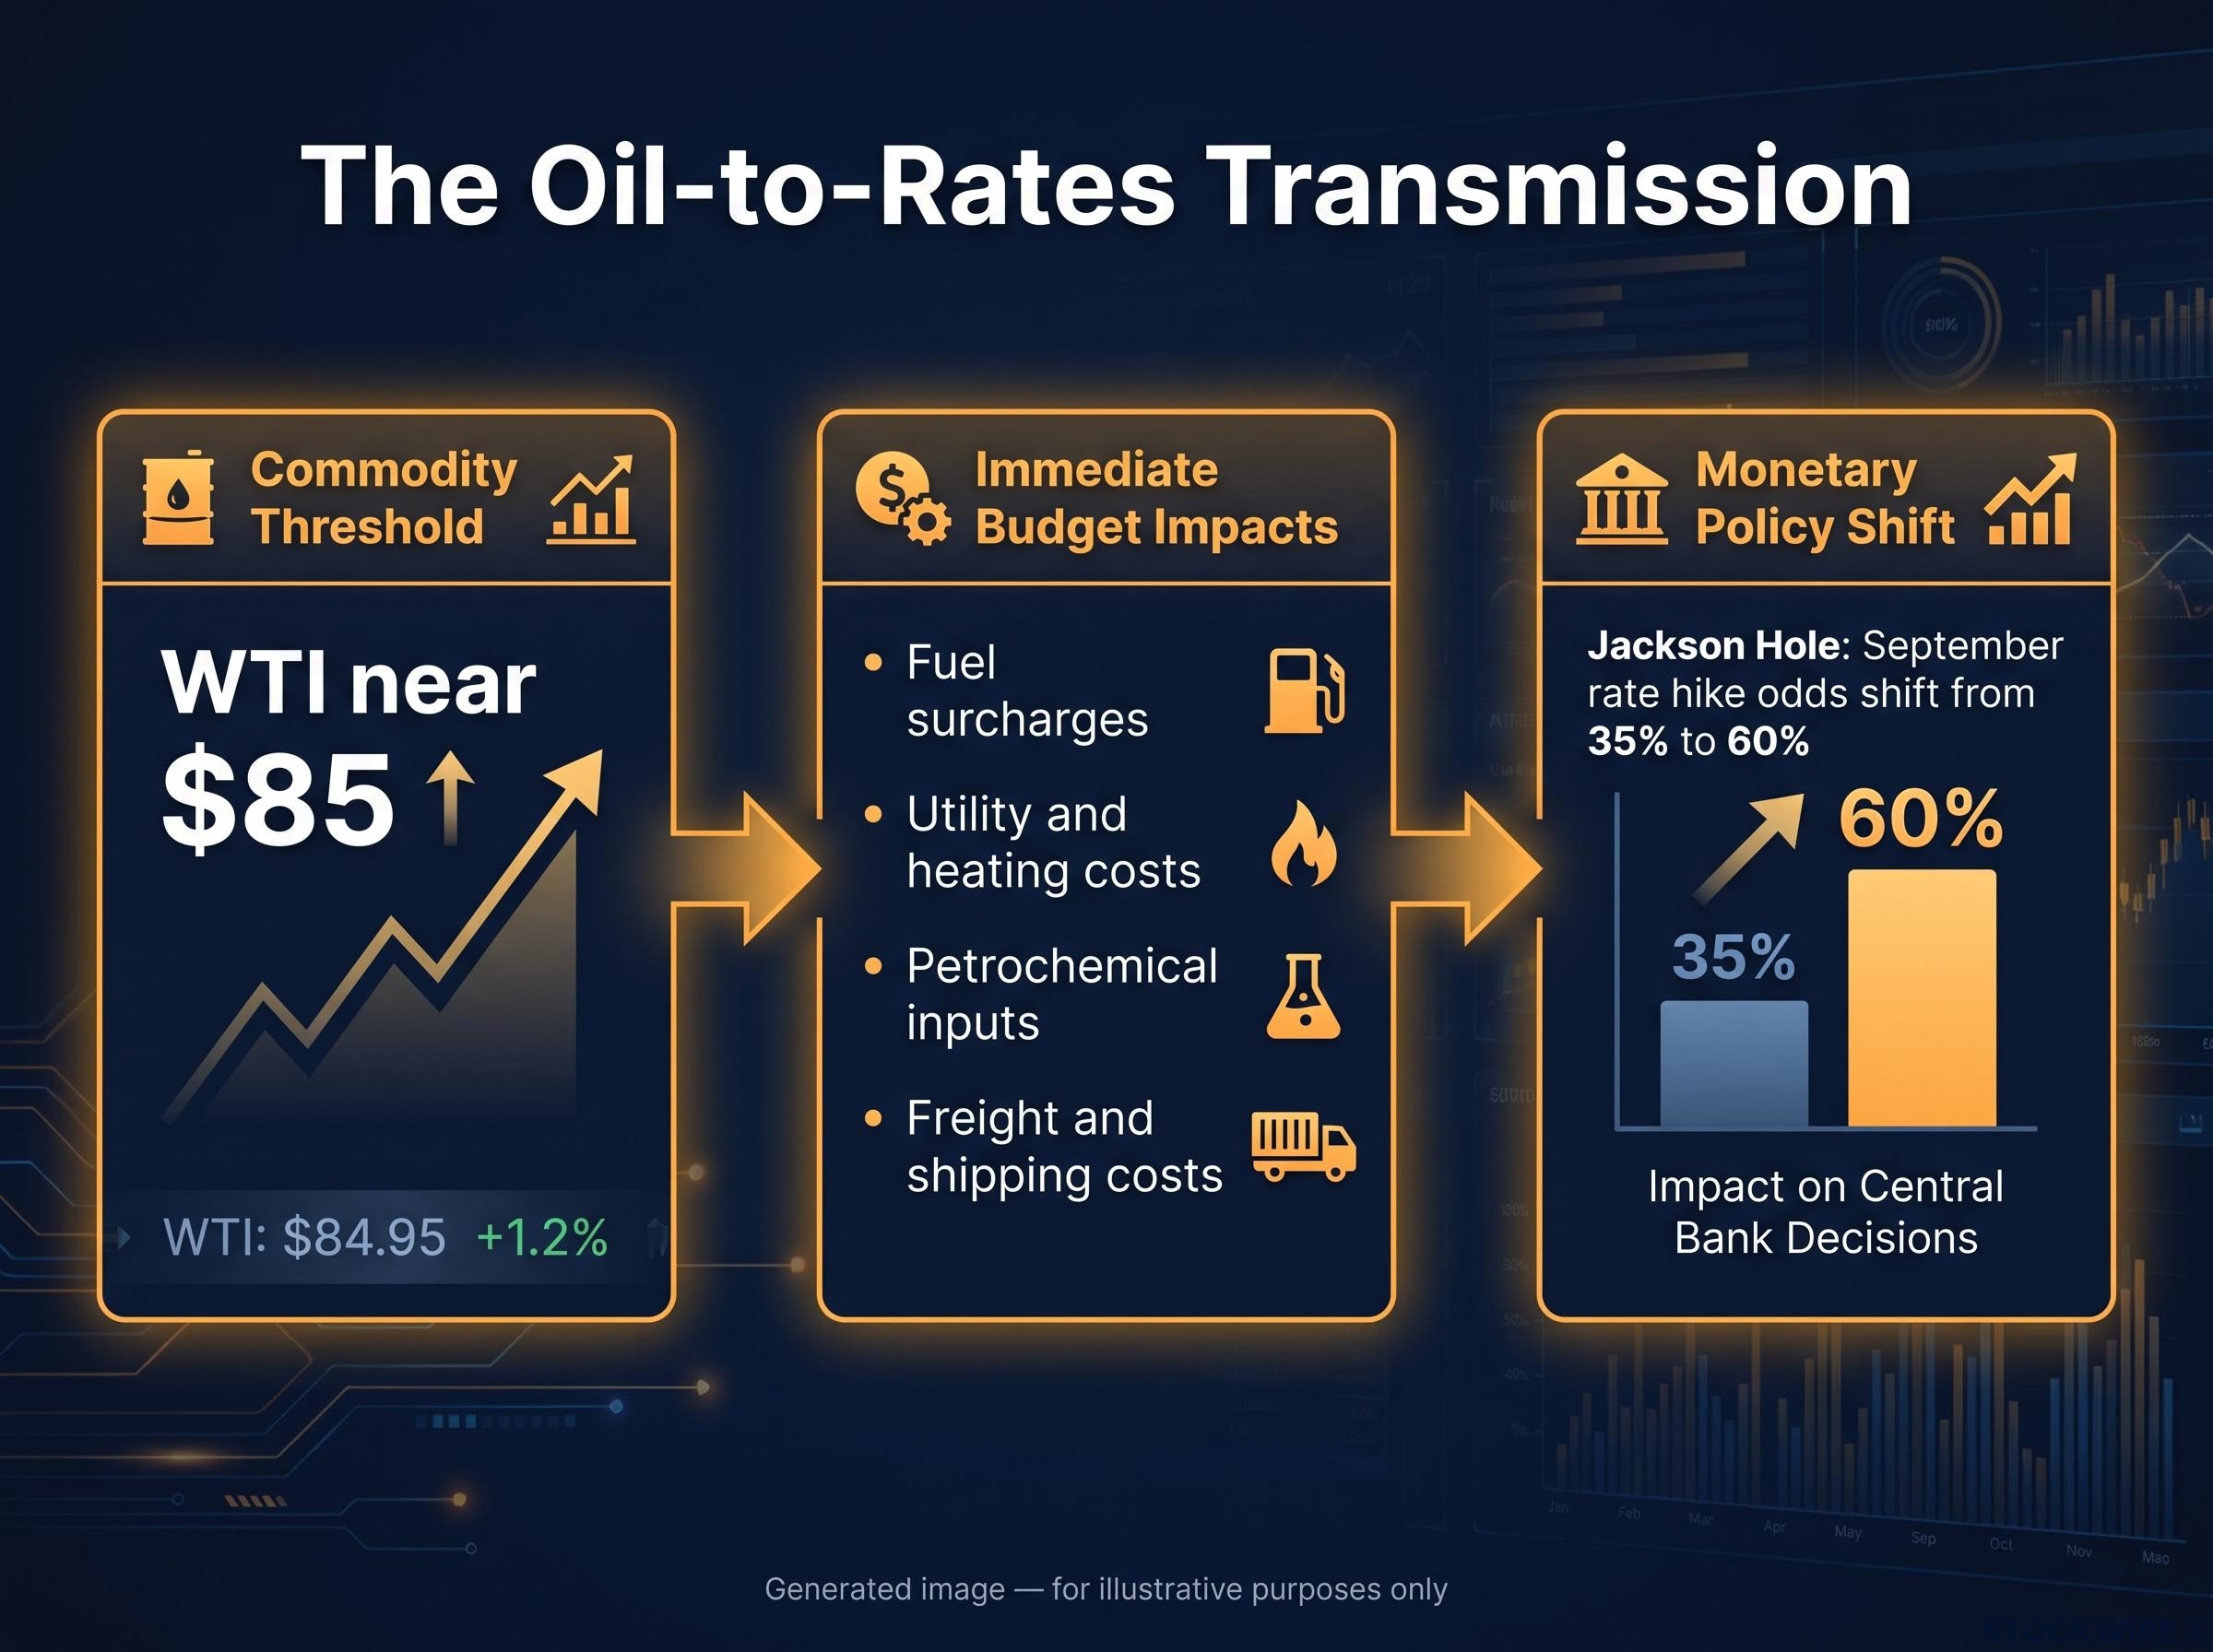
Oil’s macro significance in 2026 goes well beyond supply and demand. With WTI near $85 and Brent near $90, energy costs have crossed the threshold at which they register in business survey data, shift Federal Reserve rate probability pricing, and drive dollar strength. The speed of this transmission is not theoretical. After the Jackson Hole keynote, September rate hike odds shifted from around 35% before the speech to around 60% afterward, a 25-point move compressed into a single trading session. That is what happens once the data sequence starts running.
Here is how the chain actually works, step by step, using this week’s data releases as the live test. By the end, you will be able to trace a move in crude forward through the calendar to its likely landing place in rate expectations and portfolio positioning.
Why a crude move is really a monetary policy signal in disguise
Your instinct to watch oil is correct. Where that instinct goes wrong is in treating the energy trade as the first-order story. It is not. When crude trades meaningfully above prior ranges, the initial move is felt in operating budgets, not in share prices of oil producers. And it is the operating budget impact that triggers the chain reaction into monetary policy.
When WTI holds above the mid-$80s, the cost increases hit four categories almost immediately:
- Fuel surcharges in logistics and transportation
- Utility and heating costs across commercial operations
- Petrochemical inputs for industrials, chemicals, and consumer goods manufacturing
- Freight and shipping costs rippling through supply chains
These are real costs that show up on invoices and purchase orders within days of a sustained crude move. Official inflation data, specifically the Consumer Price Index (CPI, the government’s primary measure of consumer inflation) and Personal Consumption Expenditures (PCE, the Fed’s preferred inflation gauge), follows on a lag of several weeks.
The forward guidance removal enacted at the June 2026 FOMC meeting means each incoming data print now carries more market-moving weight than in prior cycles; Chair Warsh’s strict meeting-by-meeting framework is precisely why a single prices-paid surprise can reprice September hike odds by 25 points within a single session.
The lag that moves markets before the data does
That lag is the single most important structural feature for you to understand. Survey-based measures of business costs capture what firms are paying right now. CPI and PCE capture what consumers paid last month. By the time the headline inflation number moves, the Fed’s posture has often already shifted, and investors reading only official data are a full data cycle behind the trade.
This is not a flaw in the system. It is its normal rhythm. The difference between reactive positioning (waiting for CPI) and anticipatory positioning (watching the survey data that precedes it) is the difference between catching the repricing and chasing it.
When big ASX news breaks, our subscribers know first
How purchasing managers’ surveys become the Fed’s early warning system
An ISM prices-paid reading above 70 on your screen is not just another data point. It is the specific mechanism by which oil costs enter Federal Reserve thinking before official inflation data confirms them, and understanding why it carries that weight gives you a timing edge that most investors overlook.
The Institute for Supply Management (ISM) publishes monthly purchasing managers’ indices for both manufacturing and services. Each includes a prices-paid subindex, a component that measures what firms are actually paying for inputs in the current reporting period. Unlike CPI, which reflects prices from the prior month, prices-paid captures what managers are spending now. That makes it structurally faster. Historically, these subindices have led official inflation readings by several months.
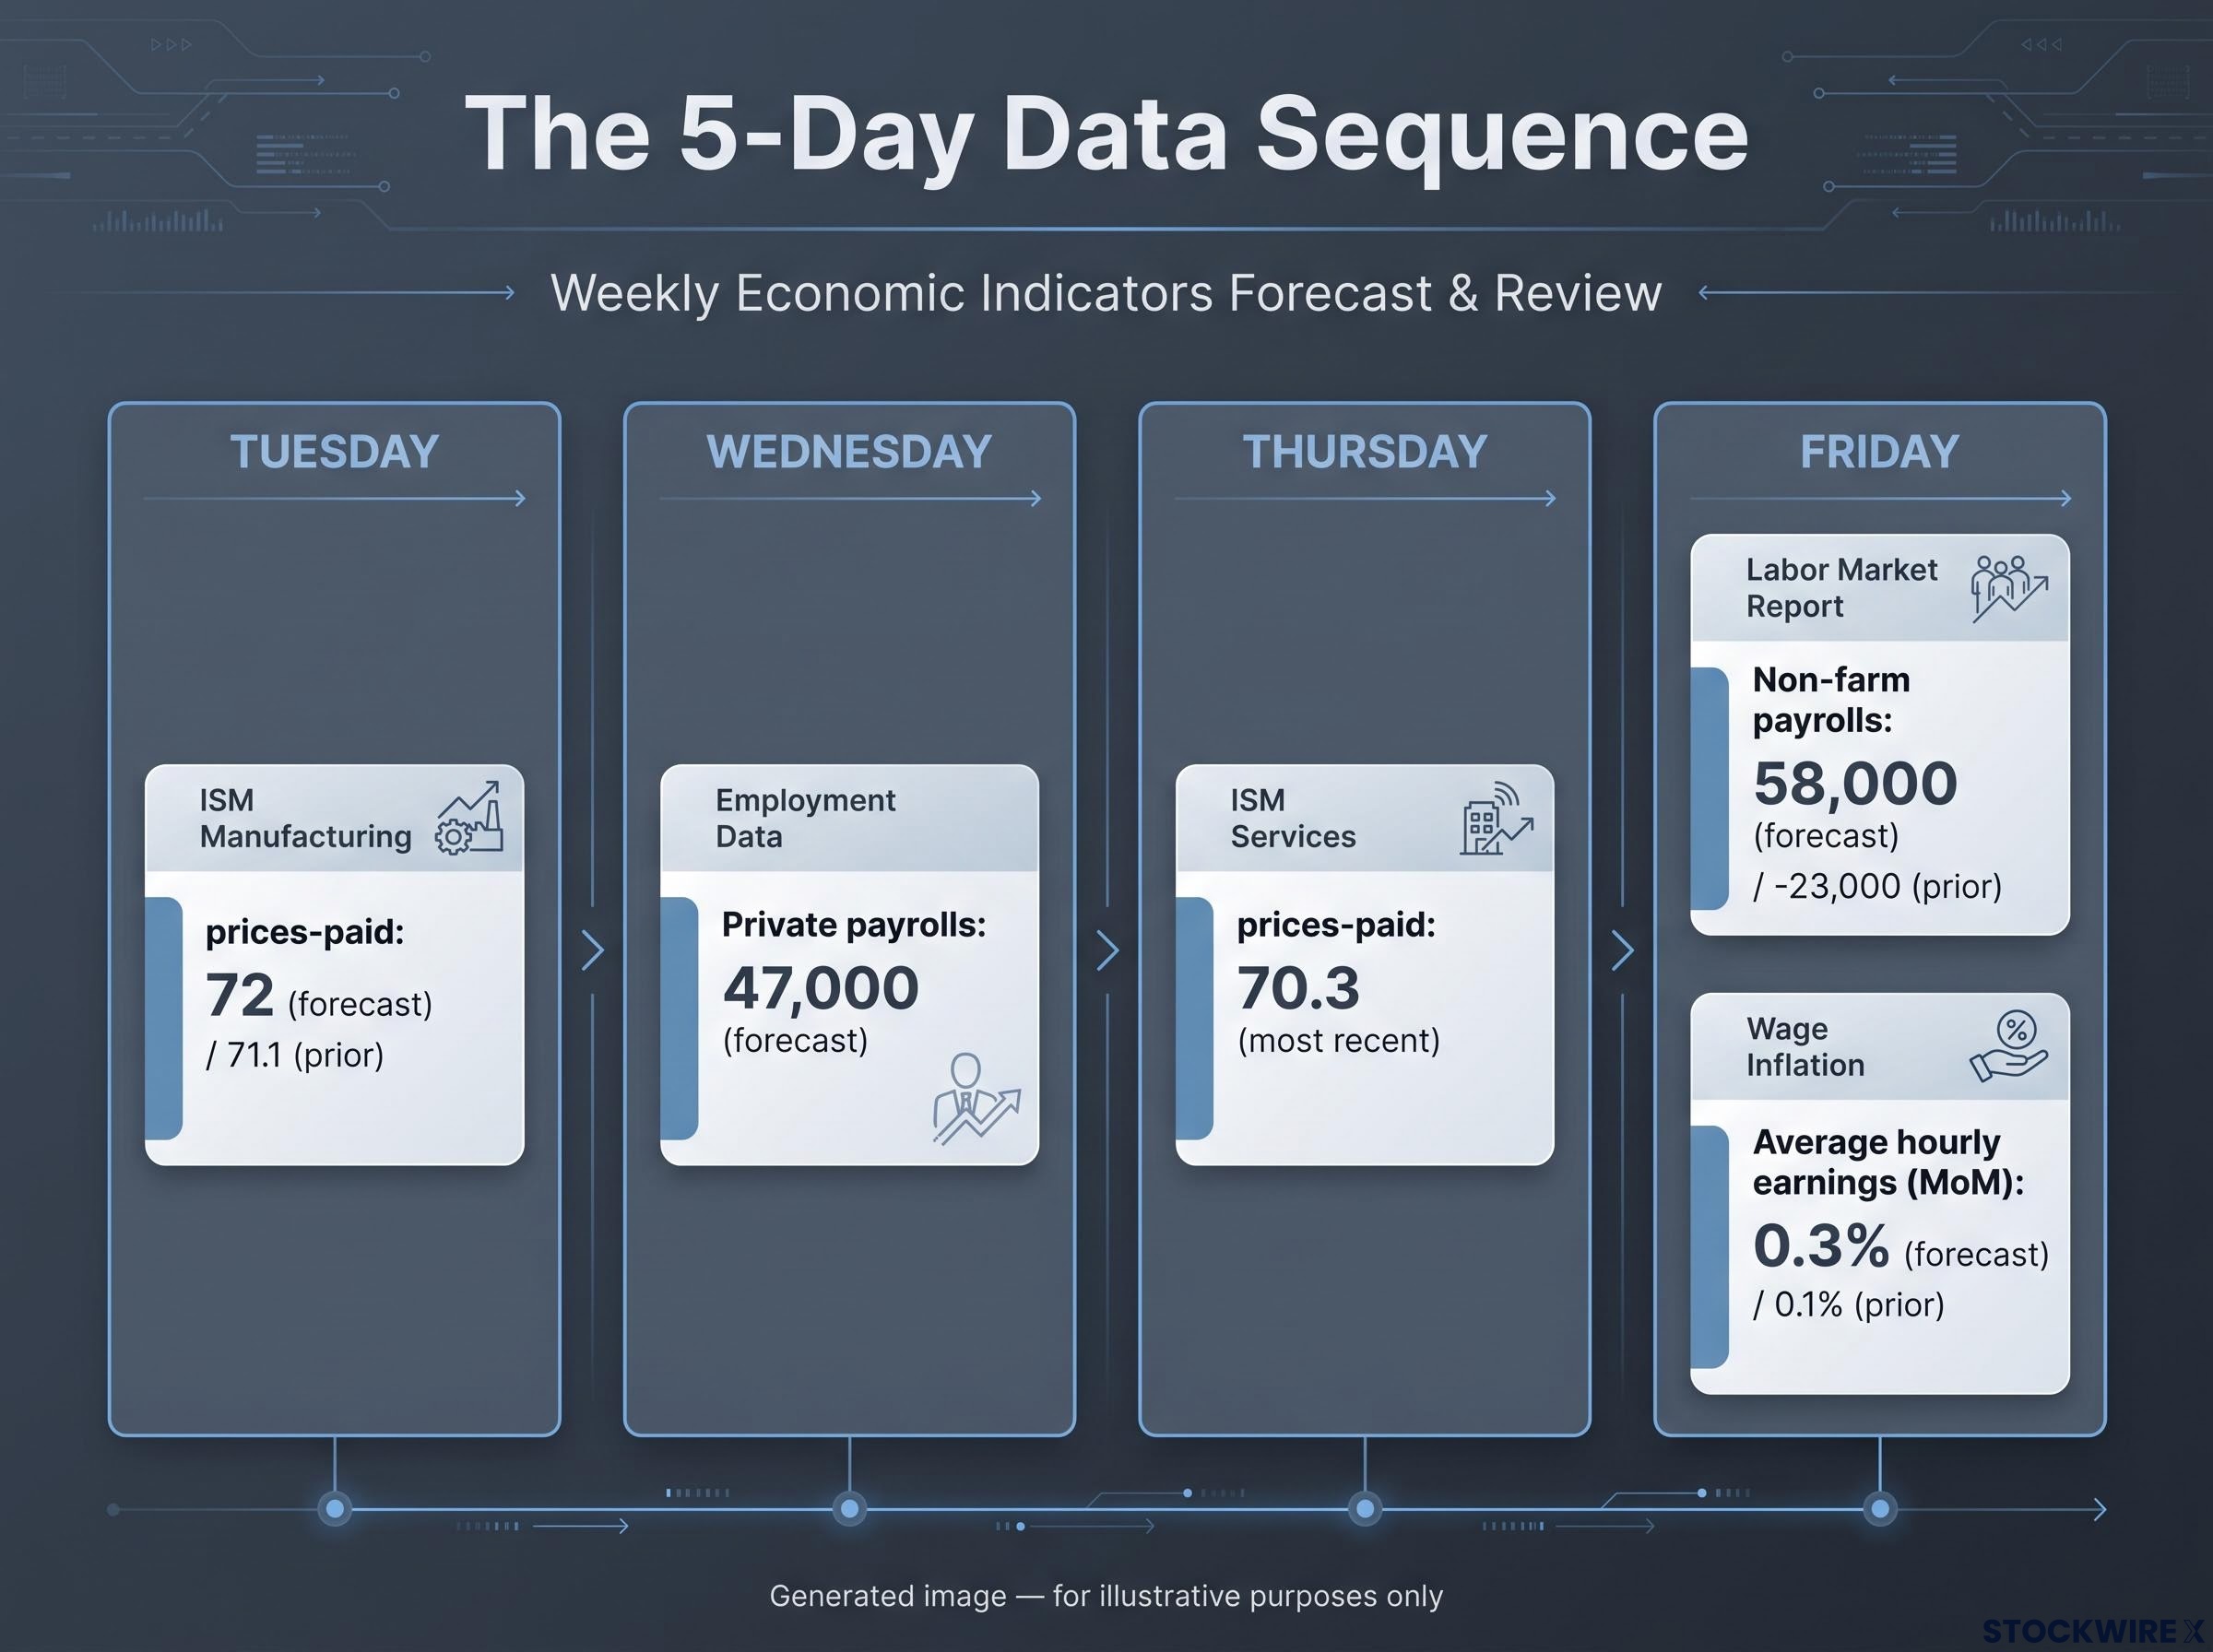
The current readings tell you the oil-to-inflation channel is already active. For the Tuesday release, the ISM Manufacturing prices-paid subindex carries a consensus forecast of 72, compared with a prior reading of 71.1. On the services side, the prices-paid component last came in at 70.3, with the Thursday update due shortly. Both are elevated. Both are consistent with energy costs feeding through into broader input inflation.
| Indicator | Release day | Forecast / most recent | Prior reading |
|---|---|---|---|
| ISM Manufacturing prices-paid | Tuesday | 72 (forecast) | 71.1 |
| ISM Services prices-paid | Thursday | 70.3 (most recent) | — |
| Private payrolls | Wednesday | 47,000 (forecast) | — |
| Non-farm payrolls | Friday | 58,000 (forecast) | -23,000 |
| Average hourly earnings (MoM) | Friday | 0.3% (forecast) | 0.1% |
The connection between these survey readings and rate expectations is not coincidental. It is causal. When prices-paid run hot and labour data confirms that firms have the demand backdrop to absorb and pass through higher costs, the Fed’s inflation assessment tilts hawkish. That is exactly what drove the post-Jackson Hole repricing.
The FOMC hawkish dissent recorded on 29 July 2026, three officials voting for an immediate hike in a 9-3 split, is the institutional backdrop against which this week’s prices-paid and payrolls data lands; swap markets have already priced roughly 60% odds of a September hike, meaning a hot Tuesday print does not move the needle from zero.
The Jackson Hole keynote shifted the September rate hike probability from around 35% to around 60%, a 25-point swing that played out within a single trading session.
A prices-paid print at or above 72 this Tuesday is confirmation that stage one and stage two of the oil-to-Fed loop are already running. It tells you the probability of further rate hawkishness is tilted upward before Friday’s employment report even lands.
How dollar strength caps oil gains, and when that cap fails to hold
Here is where the loop closes, and where it sometimes does not.
Higher Fed rate expectations widen the gap between US interest rates and those of other major economies. That differential attracts capital into dollar-denominated assets, strengthening the US dollar. A stronger dollar then pressures crude through two distinct channels:
- The pricing channel: Oil is invoiced globally in US dollars. When the dollar appreciates, crude becomes more expensive in local-currency terms for non-US buyers, which dampens demand at the margin.
- The liquidity and asset-allocation channel: Dollar strength typically coincides with tighter global financial conditions and a rotation toward safe or yield-bearing dollar assets, weighing on commodities broadly.
The result is a self-correcting ceiling. The very oil strength that lifts inflation expectations and rate pricing ultimately builds the dollar strength that makes further oil gains harder to sustain. Empirical research has documented a generally inverse relationship between the dollar and crude over medium-term horizons, even when short-term deviations occur. In a clean version of the loop, oil spikes, rates reprice, the dollar rises, and crude comes back down.
When the ceiling does not close on schedule
The loop is running right now. But there is a complication that could delay the self-correction, and you need to know about it.
In late August 2026, the US Treasury launched “Operation Economic Outcast,” a sanctions action covering roughly 60 individuals, entities, and vessels connected to Iranian oil export networks. The sweep covered shipping companies, vessel brokers, bunkering providers, financial intermediaries, and shadow fleet operators involved in transporting and monetising Iranian crude. The Treasury Secretary has indicated that further secondary sanctions packages will follow at roughly weekly intervals.
Unlike a sudden supply outage or an OPEC headline, sanctions work slowly. They gradually remove barrels from effective market access through compliance risk and financing constraints. Physical tightness can increase even as the dollar strengthens.
Sanctions credibility pricing is why Brent crude fell 2.4% on the day of the Operation Economic Outcast announcement rather than spiking: markets assigned probability to enforcement timelines rather than treating the headline as a confirmed supply removal, a distinction that shapes how long the disrupted loop can persist before the self-correcting ceiling reasserts.
For your portfolio, this means you cannot simply wait for dollar strength to bring oil back down. In a regime where supply is being administratively constrained, high oil prices and high rates can coexist for an extended period. That is the compounding headwind: energy-intensive sectors face margin compression from input costs while long-duration assets face valuation pressure from elevated discount rates, both at the same time.
The tell for this regime is straightforward. If high oil and a rising dollar persist together for weeks rather than the usual inverse pattern reasserting quickly, the sanctions constraint is likely overriding the self-correcting ceiling.
Putting the framework to work: what to watch and in what order
The abstract loop becomes a practical tool when you attach it to a calendar. Here is the four-step sequence you can run this week, and any week crude is trading above the mid-$80s:
- Track crude relative to the mid-$80s threshold. WTI near $85 is the level at which energy costs become macro-relevant rather than just volatile. Below that range, the loop is dormant. Above it, the data sequence that follows starts to matter.
- Watch ISM prices-paid as the fastest pass-through signal. Manufacturing prices-paid lands Tuesday; services prices-paid lands Thursday. These are your earliest confirmation that oil costs are feeding into broader input inflation.
- Pair prices-paid with labour data to assess sustainability. Wednesday’s private payrolls figure (consensus 47,000) and Friday’s non-farm payrolls (consensus 58,000), alongside average hourly earnings expected at 0.3% month-over-month against a prior 0.1%, tell you whether firms have enough demand to sustain price pass-through without demand destruction.
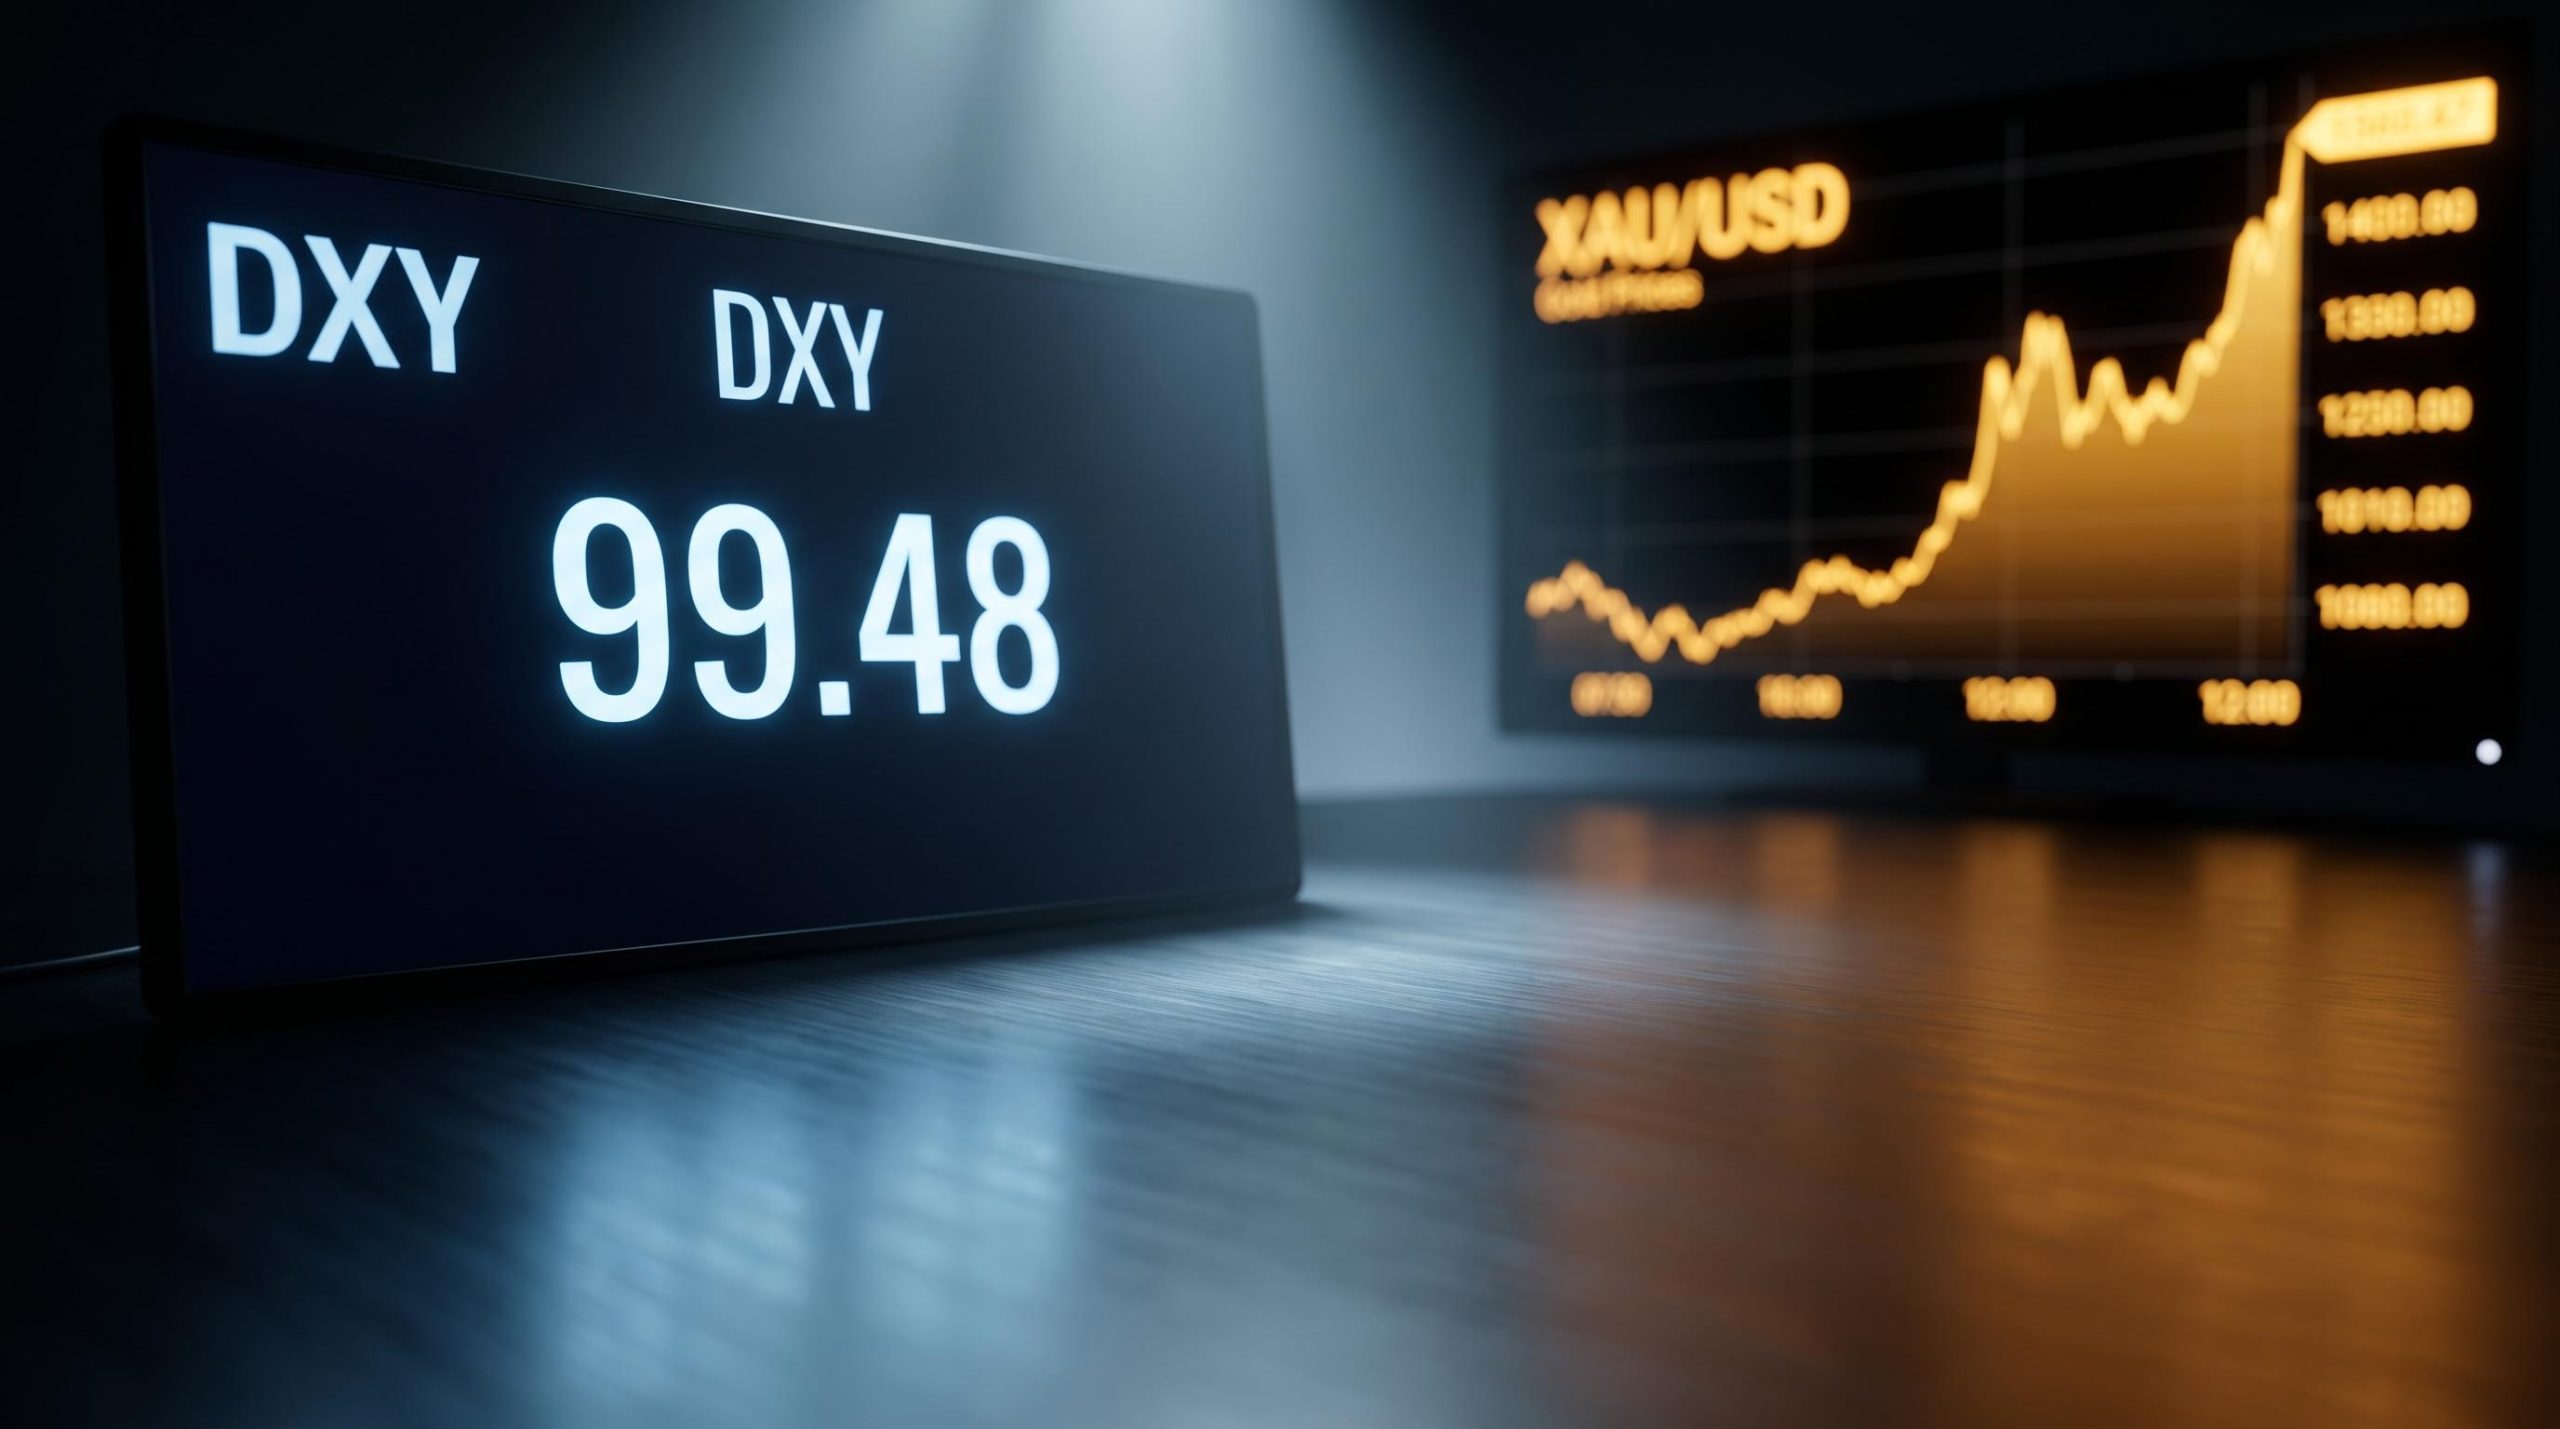
- Monitor rate hike probabilities, Treasury yields, and the dollar index as the aggregated market response. These are where the loop’s output concentrates. If all three are rising together, the feedback loop is tightening.
This week’s data calendar is a live rehearsal of the entire sequence. You can watch all four steps unfold in real time over a single five-day window.
Investors who want a systematic tool for managing exposure across rate-sensitive positions during a tightening loop will find our dedicated guide to beta-weighted position sizing useful; it covers how to convert dollar allocations into market-risk equivalents and apply volatility targeting to scale total exposure as conditions shift.
Firm prices-paid plus resilient payrolls plus accelerating wages is the data configuration in which the Fed is least comfortable telegraphing near-term easing.
If Friday’s employment report confirms strong payrolls and accelerating wages against a backdrop of elevated prices-paid earlier in the week, you should expect rate hike probability to push further above 60%, the dollar to find additional bid, and long-duration equity and fixed income positions to face renewed pressure. Not because of any single data point, but because the full loop will have run its course in five days.
Reading the loop in real time, before the consensus catches up
The chain runs in four stages: oil costs hit business budgets, survey data flashes the pass-through, the Fed leans hawkish and the dollar strengthens, and that dollar strength either caps crude or, in the presence of supply constraints like the current sanctions regime, fails to close the ceiling on schedule.
There are two regimes to distinguish. In the clean loop, oil strength is self-correcting via dollar appreciation. In the disrupted loop, administrative supply constraints sustain oil and dollar strength simultaneously. You identify which regime is active by watching oil and the dollar together, not in isolation. The post-Jackson Hole move, in which September hike odds climbed from 35% to 60% within a single session, is the most recent concrete evidence that this loop is active right now, not theoretical.
The practical edge this framework provides is not in predicting where crude goes. It is in knowing, before the broader market catches up, whether a move in oil is likely to stay in the energy sector or migrate into monetary policy pricing, the dollar, and the valuation of every rate-sensitive position in your portfolio. By the end of this week, the data will tell you whether the macro environment is tightening further or whether the loop is beginning to self-correct.
The investor who reads prices-paid on Tuesday is operating on a different timeline from the one who waits for CPI three weeks later.
This article is for informational purposes only and should not be considered financial advice. Investors should conduct their own research and consult with financial professionals before making investment decisions. Past performance does not guarantee future results. Financial projections are subject to market conditions and various risk factors.
—